Auckland Marine Dredging - Economic Assessment of Disposal Options 27 November 2018 -final - EPA NZ
←
→
Page content transcription
If your browser does not render page correctly, please read the page content below
Auckland Marine Dredging
Economic Assessment of Disposal
Options

27 November 2018 –final
Auckland Marine Dredging
Economic Assessment of Disposal
Options

Prepared for
Coastal Resources Limited

Document reference:     KAI002.18/Report/ME_report_Nov18FINAL.docs
Date of this version:   27/11/2018
Report author(s):       Susan Fairgray
                        Greg Akehurst
Director approval:      Greg Akehurst (27/11/2018)
www.me.co.nz

Disclaimer: Although every effort has been made to ensure accuracy and reliability of the information
contained in this report, neither Market Economics Limited nor any of its employees shall be held liable for
the information, opinions and forecasts expressed in this report.
Contents
1     INTRODUCTION ................................................................................................................. 1

1.1   APPLICATION FOR CONSENT AND THE EPA.................................................................................. 1

1.2   CONTEXT OF REPORT .............................................................................................................. 1

1.3   KEY MATTERS RAISED IN THE SAPERE REVIEW ............................................................................. 2

1.4   STRUCTURE OF REPORT ........................................................................................................... 2

2     ASSESSMENT OF ALTERNATIVE MARINE SEDIMENT DISPOSAL OPTIONS........................... 3

2.1   SEDIMENT DISPOSAL OPTIONS.................................................................................................. 3

2.2   DRY AND LANDFILL OPTION COSTS ............................................................................................ 3

2.3   CEMENT MIXING AND LANDFILL................................................................................................ 5

2.4   CEMENT MIXING AND RE-USE ................................................................................................. 6

2.5   NORTHERN DISPOSAL AREA (NDA) OPTION ............................................................................... 7

2.6   SUMMARY OF SEDIMENT DISPOSAL OPTIONS .............................................................................. 7

2.7   POTENTIAL CHANGES TO DISPOSAL COSTS .................................................................................. 8

3     DEMAND FOR SEDIMENT DISPOSAL ................................................................................ 10

3.1   MARINA DEMAND AND CAPACITY ........................................................................................... 10

3.2   MAINTENANCE DREDGING DEMAND AT MARINAS ..................................................................... 15

3.3   CHANGE IN MARINA DEMAND WITH CHANGE IN SEDIMENT DISPOSAL PRICES ................................. 19

3.4   MAINTENANCE DREDGING AT PORTS OF AUCKLAND LTD (POAL) ................................................. 21

3.5   CAPITAL DREDGING FOR AMERICA’S CUP.................................................................................. 22

3.6   SUMMARY OF DEMAND FOR SEDIMENT DISPOSAL ...................................................................... 24

4     WIDER TRANSPORT ENVIRONMENTAL COSTS OF SEDIMENT DISPOSAL .......................... 25

4.1   TRUCK MOVEMENTS ............................................................................................................ 25

4.2   TRUCK KILOMETRES TRAVELLED .............................................................................................. 29

4.3   TRAVEL EXTERNALITIES.......................................................................................................... 29

5     CONCLUSIONS ................................................................................................................. 33

Tables
TABLE 1: SEDIMENT DISPOSAL COSTS FOR DRYING AND LANDFILL OPTION ......................................................... 5

TABLE 2: SEDIMENT DISPOSAL COSTS FOR CEMENT MIXING AND LANDFILL OPTION ............................................. 6

TABLE 3: SEDIMENT DISPOSAL COSTS FOR THE NORTHERN DISPOSAL AREA OPTION ............................................ 7

TABLE 4: SUMMARY OF SEDIMENT DISPOSAL COSTS BY DISPOSAL OPTION ......................................................... 8

TABLE 5: ADDITIONAL DEMAND FOR MARINA BERTHS IN AUCKLAND AND THE WHANGAREI AND THAMES-
COROMANDEL DISTRICTS, 2019-2029 ....................................................................................................... 11

TABLE 6: ESTIMATED ADDITIONAL CAPACITY FOR MARINA BERTHS BY AUCKLAND/WHITIANGA MARINA, 2018 .... 13

TABLE 7: ESTIMATED ADDITIONAL CAPACITY FOR MARINA BERTHS – MARINAS AND OTHER IDENTIFIED AREAS OF
CAPITAL DREDGING DEMAND .................................................................................................................... 14

TABLE 8: COMPARISON OF M.E ESTIMATED MARINA DREDGING DEMAND WITH CRL STATED CAPITAL DREDGING
DEMAND ................................................................................................................................................ 15

TABLE 9: HISTORIC RATES OF MAINTENANCE DREDGING AT CRL-SERVED MARINAS, 2013-2018 ...................... 16

TABLE 10: ESTIMATED FUTURE MAINTENANCE DREDGING VOLUMES BY CRL-SERVED MARINAS, 2019-2029 ..... 17

TABLE 11: ESTIMATED MAINTENANCE DREDGING DEMAND FOR OTHER MARINAS, 2019-2029 ........................ 19

TABLE 12: COMBINED TOTAL DEMAND FOR SEDIMENT DISPOSAL, 2019-2029 ............................................... 24

TABLE 13: ESTIMATED TOTAL TRUCK MOVEMENTS AND KILOMETRES TRAVELLED FOR SEDIMENT DISPOSAL, 2019-
2029 .................................................................................................................................................... 26

TABLE 14: ESTIMATED COST OF EMISSIONS FROM TRUCK TRANSPORT FROM SEDIMENT DISPOSAL, 2019-2029 ... 31
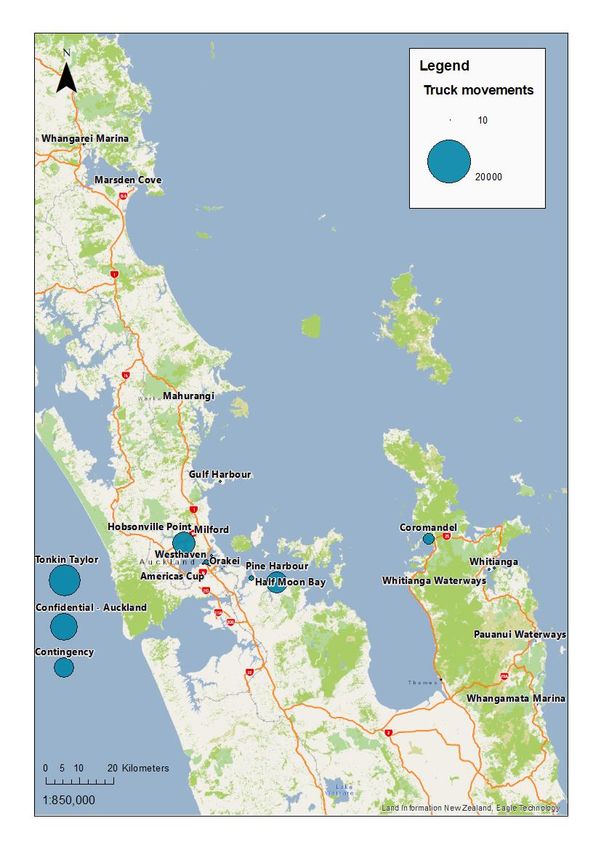
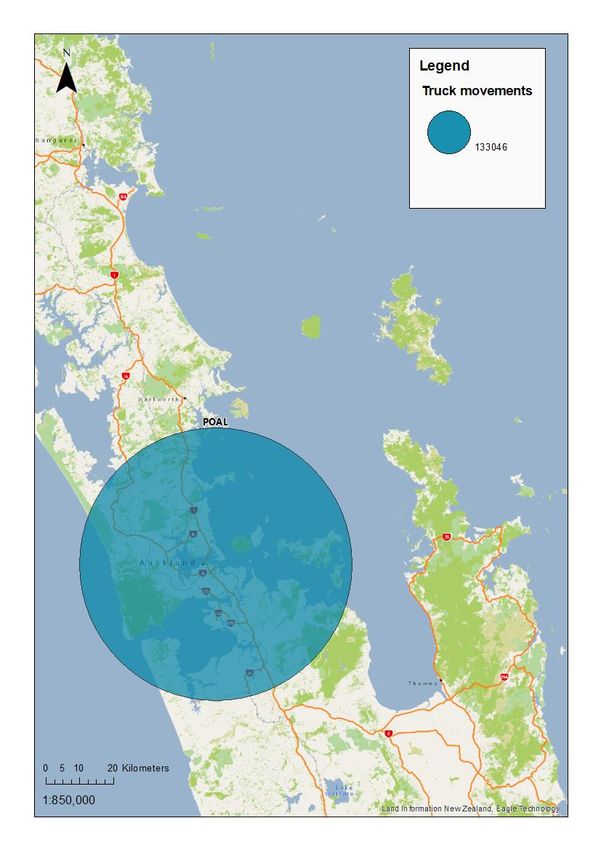
Figures
FIGURE 1: DISTRIBUTION OF ESTIMATED TRUCK MOVEMENTS BY POINT OF ORIGIN UNDER THE ‘LANDFILL DRYING’
OPTION, 2019-2029 .............................................................................................................................. 27

FIGURE 2: DISTRIBUTION OF ESTIMATED TRUCK MOVEMENTS BY POINT OF ORIGIN UNDER THE ‘LANDFILL CEMENT
MIXING’ OPTION, 2019-2029 ................................................................................................................. 28

FIGURE 3: STYLISED ILLUSTRATION OF THE TRAVEL CONGESTION EXTERNALITY .................................................. 32
1            Introduction
Coastal Resources Limited (CRL) have an application for consent to dispose up to
250,000m3 annually at the Northern Disposal Area (NDA), before the Environmental
Protection Agency. The Agency has asked CRL to provide a more detailed assessment of
demand and alternatives in response to a Sapere Research Group review of the initial
demand assessment. This report provides that assessment.

1.1          Application for Consent and the EPA
CRL have lodged an application for consent with the Environmental Protection Agency (EPA) to increase
the quantity of marine sediment that it disposes of at the NDA. The NDA is an existing marine sediment
disposal area that is located 25km east of Great Barrier Island, whereby marine sediment is disposed of
using a bottom dump barge.
CRL dredge marine sediment from a number of locations and dispose a share of it at the NDA. It currently
has consent to dispose of up to 50,000m3 of sediment per annum at the NDA for the next 17 years (till the
end of 2032). It is seeking consent to increase the annual limit to 250,000m3 for the next 35 years (till the
end of 2050).
The EPA, when assessing the application, must consider a number of factors, including:
         “any alternative methods of disposal of the waste, other matter, or pipeline that could be used; and
         (Clause 59(2B)(c)) whether there are practical opportunities to reuse, recycle, or treat the waste,
         other matter, or pipeline (Clause 59(2B)(d))1”.
It must refuse an application for a marine dumping consent if it
         “…considers that the waste or other matter may be reused, recycled, or treated without (ii) imposing
         costs on the applicant that are unreasonable in the circumstances; or (Clause 62(1A)(a)(ii)) the
         marine consent authority considers that dumping the waste or other matter or abandoning the
         pipeline is not the best approach to its disposal in the circumstances (Clause 62(1A)(c)”.

1.2          Context of Report
CRL initially commissioned Property Economics Ltd (PEL) to provide an economic analysis (the “PEL
report”)2 to understand the costs and benefits of the different disposal options for marine sediment related
to the proposal. The report was submitted as part of the consent application. Sapere Research Group
undertook a peer review (the “Sapere review”)34 of the PEL report for the EPA. It identified a number of

1 Exclusive Economic Zone and Continental Shelf (Environmental Effects) Act 2012.
2 Property Economics Limited, 2018 Economic Assessment of Deep Sea Dredging Disposal in Auckland, prepared for Coastal
Resources Limited, April 2018.
3 Murray, K. 2018 Review of economic analysis submitted in support of Coastal Resources Limited marine dumping consent

application, prepared for the Environmental Protection Agency, Sapere Research Group, 1 November 2018.
4 A further addendum (on the review of the PEL report) was provided by Sapere: Murray, K. 2018 Addendum to: Review of economic

analysis submitted in support of Coastal Resources Limited marine dumping consent application, prepared for the Environmental
Protection Agency, Sapere Research Group, 15 November 2018.

Page | 1
areas where further economic analysis was required for the EPA to understand the effects of the proposal.
These are outlined in the following section.
CRL have now commissioned M.E to undertake further economic analysis to respond to the key matters
raised in the Sapere review.
1.3 Key Matters Raised in the Sapere Review
The Sapere review has recommended the EPA seeks further economic analysis that:
• “assesses the questions asked in the survey which informed the CRL prediction of future demand
for disposing of dredged material, and evaluates the results obtained and the quantum of the
contingency5 added by CRL.
• tests how sensitive the predicted quantities are to the assumptions supporting those predictions,
including assumptions as to the price that would be charged for the Northern Disposal Area relative
to other options.
• considers the geographical source of the material, and the composition of the dredged material
from that source, and the (sic) hence the alternatives for that dredged material (p5)”.
In addition, the Sapere review makes the following assertions:
• The total cost of sediment dumping at the NDA to society is higher than the price paid by CRL given
the presence of externalities associated with dumping in the marine environment.
• The cost of dumping at the NDA is likely to increase from the current cost with an increase in
volume due to:
o an increase in scarcity of the dump site as a location to dispose of large volumes of
material.
o an increase in infrastructure costs to up a dumping operation of a larger scale.
• The demand for dumping is a derived demand from a combination of benefits from dredging and
the cost of dumping at sea relative to other options.
1.4 Structure of Report
The remainder of the report is structured as follows. Section 2 outlines and assesses the costs of the
different options for sediment disposal. Section 3 provides M.E’s evaluation of the demand for sediment
disposal from each of the sub-components of demand. Section 4 applies the truck movements identified in
each option to the total estimated demand from each sediment source to calculate the total truck
movements likely to be generated from the land-based sediment disposal options. It then quantifies the
environmental externalities of air pollution arising from these options. A summary and synthesis of the
demand and costs of sediment disposal to meet the future needs of marinas and other port activity across
the wider area is provided in Section 5.
5 Approximately 60% of the demand (1,500,000m3 of sediment) for dredging in the PEL report is allocated to ‘other capital’ and
‘other maintenance’, with the remainder allocated to specific locations.
Page | 22 Assessment of Alternative Marine
Sediment Disposal Options
M.E have assessed the costs associated with four alternative options for sediment disposal.
The assessment has been undertaken on a disaggregated basis by sediment source
location, as well as a disaggregation of costs by each component of the process. The intent
is to provide further information to the EPA on the alternative options and greater
certainty around the overall cost estimates (to the user) of each option.
2.1 Sediment Disposal Options
There are four options for disposal of sediment that is dredged from the different locations (marinas and
the Ports of Auckland Ltd (POAL)). These are:
• Dry and landfill option – sediment is dredged from the source location, dried out at/near the source
location, then transported by truck and disposed of at a landfill.
• Cement mixing and landfill option – sediment is dredged from the source location, transported by
barge to POAL, mixed with cement to a ‘spadeable’ consistency, then transported by truck and
disposed of at a landfill.
• Cement mixing and reuse option – sediment is dredged from the source location, transported by
barge to POAL, mixed with cement, then reused in another application, which may require
transport by truck.
• Northern Disposal Area (NDA) option – sediment is dredged from the source location then
transported by barge to the NDA and disposed of via bottom dump barge.
The costs of each option are outlined in the following sub-section. The cost estimates exclude the cost of
the dredging itself as this is common across all options.
2.2 Dry and Landfill Option Costs
Under this option, sediment is dredged from the source location, then dried out on land at or close to the
source location. Once it reaches a certain consistency, it is loaded and then transported by truck and
disposed at the landfill.
The first stage of this option – drying the sediment – requires a land area adjacent to the source6 to dry the
sediment prior to transport to a landfill. CRL have estimated the land cost component to equate to $50 per
m3 of sediment, based on applying this option at Pine Harbour Marina. Specifically, this is based on an
estimated land value of $500 per m2, with 2ha of land required for 6 months to dry 7,000m3 of sediment
6This analysis primarily considers a land area adjacent to the source location. An alternative land area would require transport of
wet sediment via sealed truck units from the source to the land drying area. This is seldom undertaken as it involves considerable
cost (for sealed truck units) and higher levels of environmental risk (if the sediment were to leak during transport).
Page | 3at a land rent yield of 7% per annum. If different land costs are applied, ranging from $200 to $1,000 per m2 across the different source locations, then the cost per m3 of sediment ranges from between $20 and $100 (with an average of $54 per m2). Establishing a drying area also incurs a resource consent cost. For the same Pine Harbour Marina example, CRL have estimated this at $200,000 for 70,000m3 of sediment (i.e. 7,000m3 for 10 years of the consent), equating to $2.86 per m3. CRL also estimate further cost to establish, process and disestablish the sediment bund and loading and unloading the sediment (at $58 per m3). In total, the costs associated the land drying component of the process equate to between $80 and $160 per m3 of sediment. The variation in costs for this component reflects the difference in land value at each source location. If sediment were instead transported to cheaper land at a different location, this would result in land costs of around $70 (assuming a land value of $100 per m2), a difference of $10 to $90 per m3. However, this would require higher numbers of truck movements and use of sealed truck units/tankers, which are likely to outweigh the cost difference. It is noted that in many cases appropriate land is not available at the sediment source location – making this not a practicable option. Once the sediment has dried, it is then transported to a landfill. The landfill options for sediment disposal include Redvale and Hampton Downs, and the same disposal costs (at the landfill site) have been assumed for each. These equate to $129 (as advised by CRL). We note that a disposal cost of $250 per m3, as outlined in Mr Male’s evidence, is seen as reasonable within the Sapere review (para 42: p16). This analysis considers each of these options (Redvale and Hampton Downs) in relation to the location of the sediment source area7 as there are likely to be significant differences in transport costs for each option, and consequent differences by location between using each landfill. Transport costs have been assumed to equate to $12.00 per truck kilometre travelled (for each truck)8, with each truck carrying 21m3 of sediment. A further $18 per m3 of sediment has been assumed for the Redvale landfill to take into account timing and access volume constraints at this location (as advised by CRL). Overall, transport costs equate to between $32 and $110 per m3 of sediment from each location. Table 1 provides a summary of the cost ranges involved at each stage of this process, and the overall range of total costs. These have been expressed on a per m3 of sediment basis. In total, disposal via this option ranges from $256 to $325 per m3. Importantly, these costs have been estimated on the basis that the 7 The shortest road network distance between the sediment source location and the landfill forms a conservative estimate of the transport costs in this respect as, if the drying area were located away from the source area, then the total transport cost (i.e. to the drying area, then to the landfill) would be equal to or greater than the distance between the sediment source location and the landfill. 8 CRL advise that smaller truck units cost $54 to transport each m 3 of sediment from Pine Harbour to Hampton Downs landfill. At 7m3 per truck (based on the smaller truck units), this equates to a per kilometre rate of $5.25 for a truck (or $0.75 per m 3). This is within a similar range to the 2011 value of $4 per truck kilometre stated in the Sapere review (para 42: p16) when taking into account cost increases through time and changes to pricing structures (a shift to time-based pricing to better reflect the costs of congestion). The larger truck units (21m3 or 30 tonnes) are more efficient (as advised by CRL), and have been used in this analysis to produce conservative estimates, equate to $0.57 per m3 per kilometre. Page | 4
option would be available to undertake. In many cases, this alternative is unable to occur as resource
consent is unable to be obtained for the sediment drying process. This constraint occurs on the basis of
effects of the proposed consent as distinct from a constraint in relation to cost – in many cases consent is
not granted on the basis of adverse effects of the proposal9.

Table 1: Sediment Disposal Costs for Drying and Landfill Option

                                                                                            Cost per m3 of sediment
             Process                                Cost Category                         Min         Max        Average
                                 Land costs                                             $  20.00 $ 100.00 $         54.00
     Put dredged sediment on     Resource consent                                                              $      3.00
    land next to marina to dry   Decant Areas                                                                  $    15.00
                                 Processing costs (e.g. rotary hoe + est bund)                                 $    43.00
Truck to landfill                Truck transport costs                                  $  32.00 $ 110.00 $         47.00
                                 Landfill cost                                                                 $ 107.00
Dispose at landfill
                                 Margin (15-20%)                                                               $    21.00
TOTAL                                                                                   $ 256.00 $ 325.00 $ 290.00

2.3           Cement Mixing and Landfill
Under this option, sediment is dredged from each location. It is then transported by barge to POAL at
Auckland’s CBD waterfront. At POAL, cement is then added to the sediment on the barge, with both
components mixed together, which sufficiently dries it to a consistency able to be transported to and
accepted at landfill. The mixed sediment is then transported via trucks from the POAL to landfill.

The stage of transporting the dredged sediment to POAL incurs costs of barge hire and transport, and berth
hire at POAL. Each barge can transport up to 337m3 of sediment, with each trip requiring 2 days of berth
hire at a cost of $6,500 per day. Barge hire and transport costs have been estimated to equate to $0.31 per
kilometre travelled based off the estimated cost of barge transport to the NDA10. Together, this stage of
the process costs between $39 and $84 per m3, depending upon the distance between the sediment source
location and the POAL.

The second stage of the process – adding cement and mixing the sediment – incurs the costs of cement
and mixing. CRL have advised that cement costs $220 per tonne, with 100kg of cement required for every
m3 of sediment (equating to $26 per m3 of sediment). A further $16 per m3 is the cost for a digger to mix

9 M.E understand that the land drying process involves potential environmental risks and reverse sensitivities to surrounding land
uses. A core component of the risk associated with this process is the potential run-off and leaching of material from the sediment
into local hydrological systems and water catchments. The often extensive requirements in relation to containing sediment run-
off through sediment settling ponds and other sediment traps reflects this environmental risk.
10 CRL states that the cost of transporting and disposing of sediment at the NDA (approximately 142 km away from the sediment

source) is $50 per m3. Approximately $6 per m3 of this cost relates to administrative costs, with the remaining $44 per m3 assumed
to be the cost of barge hire and transport. Assuming a distance of 142 km, this implies a cost of $0.31 per km travelled. The same
cost rate has been applied to barge transport under the other options.

Page | 5
the cement with the sediment. Together, this amounts to $42 per m3 of sediment for the second stage of
this option.
Disposal of the mixed sediment to landfill forms the final stage of this option. It has been assumed that the
material will be transported to Redvale landfill as it is located closer to POAL than Hampton Downs. The
same cost estimates of $36 per m3 have been assumed as that under the first option, which reflect the cost
of transport from the POAL to Redvale landfill. Road transport costs are the same for all sediment source
locations as the final stage of the process all occurs from the location of POAL.
Table 2 provides a summary of the cost ranges involved at each stage of this process, and the overall range
of total costs. These have been expressed on a per m3 of sediment basis. In total, disposal via this option
ranges from $245 to $291 per m3.
Table 2: Sediment Disposal Costs for Cement Mixing and Landfill Option
Cost per m3 of sediment
Process Cost Category Min Max Average
Barge hire and transport $ - $ 46.00 $ 11.00
Barge to POAL
POAL fee $ 39.00
Cement costs $ 26.00
Add cement and mix
Mixing costs $ 16.00
Truck to landfill Truck transport costs $ 36.00
Landfill cost $ 107.00
Dispose at landfill
Margin (15-20%) $ 21.00
TOTAL $ 245.00 $ 291.00 $ 256.00
2.4 Cement Mixing and Re-Use
A further alternative option occurs where sediment mixed with cement is re-used in various applications
instead of being disposed of at landfill.
The first stages of this process are equivalent to the above option where sediment is transported from the
source location to POAL, then mixed with cement at POAL. As such, the costs up to this point of the process
are assumed to be the same, ranging from between $81 and $127 per m3 (refer to Table 2 above).
After this stage of the process, the sediment is then transported to the location of re-use. This is likely to
incur transport costs (at $12.00 per km travelled by a 30 tonne truck and trailer carrying 21m3 of sediment)
and any loading/unloading costs associated with distributing the sediment to the location of use.
Further information is not currently available on specific options for sediment re-use as potential future
options have not yet materialised. The previous substantive re-use options predominantly involve land
reclamation at POAL. However, this activity is unlikely to continue into the future as the capacity has now
been fully taken up at POAL, with agreement among Iwi and other stakeholders that no further reclamation
will occur. This agreement is reflected in the Auckland Unitary Plan (AUP) where reclamation has a Non-
Complying activity status.
If sediment is reused in other locations, resource consents are a further cost that will incurred. Use of
dredged sediment in built structures has a full Discretionary activity status under the AUP.
Page | 62.5 Northern Disposal Area (NDA) Option
Under this option, sediment is dredged from each source location, then transported to the NDA by barge.
It is then disposed of at the NDA using a bottom dump barge.
This process incurs the cost of barge hire and travel to the NDA, which has been estimated at $0.31 per
barge kilometre travelled for each m3 of sediment. This cost component ranges from between $27 and $46
per m3 of sediment, depending upon the sediment source location.
An administration cost of an average of $6 per m3 of sediment is then charged by CRL to dispose of sediment
at this location. CRL have also advised that resource consent costs for this option equate to around $0.81
per m3 of sediment. This includes both the base resource consent cost and the ongoing monitoring
requirements. This cost estimate reflects the cost of the current consent and it is anticipated that this will
fall within a similar range in the future11.
CRL have advised that sufficient capacity currently exists across a range of operators within the barge
transport and dredging sector to cater for the increased sediment transport requirements. As such, no
further investment in infrastructure is required for this option and therefore has not been included as an
additional cost.
Table 3 provides a summary of the cost ranges involved at each stage of this process, and the overall range
of total costs. These have been expressed on a per m3 of sediment basis. In total, disposal via this option
ranges from $34 to $52 per m3.
Table 3: Sediment Disposal Costs for the Northern Disposal Area Option
Cost per m3 of sediment
Process Cost Category Min Max Average
Barge to NDA Barge hire and transport $ 27.00 $ 46.00 $ 40.00
Disposal costs CRL administration cost $ 6.00
Resource consent costs Cost of obtaining resource consent $ 1.00
TOTAL $ 34.00 $ 52.00 $ 47.00
2.6 Summary of Sediment Disposal Options
The above sub-sections have outlined the overall disposal costs and their component parts for each of the
sediment disposal options. These are summarised in Table 4.
11Although the future costs of the consent are not yet known, M.E consider this will have a very minor impact on the estimation
of the cost of this option given the small share of total costs which are accounted for by the consent.
Page | 7Table 4: Summary of Sediment Disposal Costs by Disposal Option
Cost per m3 of sediment
Disposal Option Notes Min Max Average
Dry and Landfill $ 256 $ 325 $ 290
Cement Mix and Landfill $ 245 $ 291 $ 256
Cement Mix and Re-Use Partial costs only $ 81 $ 127 $ 92
Northern Disposal Area $ 34 $ 52 $ 47
Large cost differences for the disposal of sediment have been demonstrated between the different options.
Overall, drying the sediment and then transporting it to landfill incurs an average cost of $290 per m3 of
sediment, some six times the cost of disposing sediment at the NDA. Similarly, mixing the sediment with
cement, then disposing it at landfill incurs an average cost of $256 per m3 of sediment, around five and a
half times the cost of disposal at the NDA.
The cost of mixing the sediment with cement and then re-using it has only able to be partly estimated as
re-use options are not currently available. However, only a sub-component of these costs are
approximately double the cost of disposal at the NDA. The total costs of the re-use option, if an application
becomes available, are likely to be substantively higher than the partial costs identified in the initial stages
of this option.
Consequently, this analysis considers that the substantive differences in cost between the options means
that the sediment is unable to be disposed of in an alternative way (to the NDA) without a much larger cost
to the applicant.
Moreover, in many instances the possibility of undertaking the alternative disposal options does not exist
due to constraints that occur irrespective of cost. As outlined in Section 2.2, it is often not possible to
undertake the sediment drying option due to the refusal of resource consent to undertake the sediment
drying process. Similarly, the cement mixing options assume sufficient capacity at the POAL to undertake
this option, which may become a constraint or adversely affect the efficient functioning of the port, which
is an additional cost not captured by the private cost of sediment disposal assessed here. As outlined in
Section 2.4, the potential for the cement mixing and re-use option further relies on capacity at the port as
well as the emergence of opportunities for re-use and successfully obtaining resource consent for these
activities (which may be declined on the basis of effects).
The costs outlined in this section relate to the cost of disposal to the applicant. Differences to the total cost
(i.e. including social and environmental factors) are discussed in Section 4. Potential changes to these costs
are addressed in the following section (Section 2.7).
2.7 Potential Changes to Disposal Costs
The Sapere Review (paras 26 to 28) considers that the cost of disposal at the NDA may increase if resource
consent is granted. This is due to a combination of the following factors:
Page | 8i. Additional transport infrastructure required to meet the increased demand in sediment
disposal at this location.
ii. Additional costs in obtaining resource consent.
iii. Economic theory would predict a price increase for access to the NDA as a scarce resource for
disposing of large volumes of sediment.
This sub-section considers the above points together with the changes in prices that would be required to
change the status of the NDA as a sediment disposal option relative to other options.
As outlined above, CRL have advised that the marine transport industry currently has sufficient capacity,
across a number of different operators, to cater for an increase in demand. Consequently, no further
investment in infrastructure is required.
Section 2.5 already includes the additional costs of obtaining a further resource consent. At around $0.81
per m3 of sediment, this contributes only a small share of the overall cost (average of $47 per m3).
If any cost increases were to occur with this disposal option, it is important to understand the required
scale of changes to make the NDA disposal option a comparable cost to the alternative disposal options.
The above sections have shown that the costs of sediment disposal among the alternative options differ in
order of magnitude to that of the NDA option (alternative options are approximately 5.5 to 6 times the
cost). Therefore, any change in disposal costs at the NDA would correspondingly have to change in order
of magnitude to result in costs occurring within similar ranges to the alternative disposal options.
Moreover, when considering any potential changes to this cost, it is important that the dominant share
(around 85%) of the cost of the NDA option is generated by barge travel to the NDA. As such, any change
in this cost component would also apply to the next cheapest option, albeit with a smaller relative effect.
The presence of multiple operators, together with the required use of barges in an alternative option, mean
that any changes in price due to scarcity of access to the NDA can occur to this remaining component of
cost. This means that the remainder of the cost of this option would have to increase by between 7 and 37
times (760% to 3,700%) for the NDA disposal option to become a similar disposal cost to other options.
M.E consider that there is limited scope for substantial changes in cost across these components. This is
because there are a sufficient number of other operators (in addition to CRL) within the market that could
also potentially establish an operation. Large cost increases would encourage the entry of other providers,
which would in turn create competition within the market to limit any potential cost increases.
In addition, there is potential for scale economies to occur reducing the overall cost of this disposal option.
The cost estimates have been prepared based on the application of a 337m3 barge volume. Larger barges
of up to 1,200m3 sediment volume could potentially be used in the future. CRL have advised that the likely
cost of this option (on a per m3 basis) would be around 20% cheaper than the current barge volumes.
The potential for scale economies through using larger barges is greater for the NDA option than the
cement mixing and landfill option as it makes up a much larger share of the cost. Barge transport accounts
for 86% of the cost of the NDA disposal option, and around 19% of the cost of the cement mixing and
landfill option.
Page | 93 Demand for Sediment Disposal The requirement for dredging is formed from a combination of dredging at marinas and other areas (including the Ports of Auckland Ltd (POAL)). Within each of these, there is the requirement for capital works dredging (i.e. the creation of new dredged areas, such as new berths), and maintenance dredging to maintain the depths in previously dredged areas. This analysis has assessed the likely demand for sediment disposal based on demand for the above activities. Across most areas, the calculations have been undertaken independently of the total demand volumes provided by CRL in the initial report. This approach has been taken in order to verify the scale of dredging demand contained in the initial report. The following sub-sections consider the different factors in driving demand for each component of the overall sediment disposal demand. 3.1 Marina Demand and Capacity M.E have considered information on the current market situation for marinas in the wider Auckland area. Information on the currently existing number of marinas in Auckland have been obtained from different reports, together with our own estimates of the number of berths at all marinas across Auckland and the Whangarei and Thames-Coromandel districts12. It is important to understand growth in demand for marina berths as it is a key driver of capital dredging demand for marinas. 3.1.1 Current and Future Marina Demand Overall, M.E estimate there are currently around 6,800 marina berths in the wider Auckland region and the Whangarei and Thames-Coromandel districts13. It is also important to include any latent demand in a current estimate of demand for marina berths in Auckland. There has been a reduction in new capacity at Auckland marinas over recent years due largely to resource consenting issues. Based on existing marina occupancy rates and waiting lists, the total latent demand has been estimated at 10%. Together, the total demand for marina berths in Auckland and the Whangarei and Thames-Coromandel districts has been estimated at 7,480 berths. 12 The EPA have requested an analysis of demand across the wider Auckland-Whangarei-Thames-Coromandel area to reflect the wider geographic catchment of demand for sediment disposal at the NDA. 13 This figure has been estimated based on a combination of reports (Beca, 2012 Auckland Recreational Boating Study, prepared for Auckland Council, 12 April 2012; Comer, 2018 Marina Berth Supply & Demand Trends, prepared for Panuku Development Auckland, Updated Report, April 2018; Research New Zealand, 2016 Summary of Recreational Boating Research, prepared for Maritime New Zealand, September 2016) and M.E’s own estimates of berths by marinas. Page | 10
The estimated current and future demand is set out in Table 5. The current demand compares to a total
existing household base of 626,400 households. The combined number of households across this wider
area is expected to increase by 19% over the 2019 to 2029 period. If boat ownership rates remain constant,
then growth in households will result in a demand for around 9,100 marina berths by 202914. This equates
to an increase in demand for around 2,100 berths between 2019 and 2029, including estimated existing
latent demand for berths.

Table 5: Additional Demand for Marina Berths in Auckland and the Whangarei and Thames-Coromandel
districts, 2019-2029

                                                                                        Year                     Change 2019-2029
                                                                                 2018       2019       2029 Percentage    Net
Auckland, Whangarei, Thames-Coromandel Households                            626,400    639,400    759,700           19%      120,300
Existing marina berths                                                         6,800
Latent demand for marina berths                                                  680
Total current demand for marina berths                                         7,480
Future demand for marina berths
   No change in boat ownership rates                                                       7640       9070          19%         1,430
   0.2% pa increase in rate of boat ownership                                              7650       9270          21%         1,620
Additional berth demand (from 2019 estimated berths) - incl. latent demand
   No change in boat ownership rates                                                                 2,110          30%         2,110
   0.2% pa increase in rate of boat ownership                                                        2,300          33%         2,300

Longer-term trends in New Zealand and Auckland suggest boat ownership rates are increasing through
time. A report by BECA (2012) estimates that the rate of household boat ownership is projected to increase
by 0.4% per year over the long-term from 2011 to 203115.

The analysis in this report has adopted a conservative estimate of a 0.2% annual change in the rate of boat
ownership over the medium-term16. It has consequently assumed that marina berths as a percentage of
households (across the wider area) will increase from 1.19% in 2018 to 1.22% in 2029. This represents a
net increase in demand for around 2,300 marina berths from 2019 to 2029, including meeting latent
demand.

3.1.2         Marina Capacity
M.E have analysed the capacity to accommodate growth in marina berth demand across existing and
planned marinas in Auckland and the wider area served by the NDA (i.e. greater Auckland and the
Whangarei and Thames-Coromandel districts). It has been assumed that capacity does not exist within

14 That is, a 19% increase from a base demand of 7,600 berths (where latent demand has been included). The base year has been
adjusted to 7,600 berths (from 7,480 berths) to account for growth between 2018 and 2019.
15 It has estimated that 25% of Auckland households own boats (all types of boats, not only marina boats) in 2011, with this share

increasing to 27% in 2031.
16 Meeting latent demand has not been included as a factor driving increases in boat ownership rates. It has been assumed that

latent demand is instead currently being met through a combination of other boat storage mechanisms such as swing and pile
moorings and dry-stack storage.

Page | 11
existing marinas due to the reported high occupancy rates and low rates of new capacity over recent years – the factors driving latent demand. The capacity for expansion of existing marinas has been identified in Auckland through comparing the Auckland Unitary Plan (AUP) zoned areas for marinas with the current spatial extent of each marina1718. This shows the further water area that each marina is able to expand into under the AUP provisions. Where present, this additional surface area has been translated into additional capacity for each marina by applying the average surface area estimates for each berth (including fairway and accessway contributions) of each marina. These capacity estimates are contained in Table 6. It shows that capacity (under the AUP) for marina expansion in the Half Moon Bay, Hobsonville, Pine Harbour, Gulf Harbour and Hobsonville Point marinas. In total, it is estimated that the additional zoned areas for expansion can accommodate an additional 1,350 marina berths. 17 The capacity estimated for Half Moon Bay Marina has instead been informed by the resource consent application. 18 Similar information was not available within the Whangarei and Thames-Coromandel districts. In these cases, capacity information was obtained through a desktop search of any marina expansion plans. Page | 12
Table 6: Estimated Additional Capacity for Marina Berths by Auckland/Whitianga Marina, 2018

                                                                        Average      Additional       Estimated
                                          Existing Water
                                                           Estimated Water Area Zoned Water Additional
                                           Surface Area
                                                             Berths     per Berth Surface Area         Capacity
                                                (ha)
Marina                                                                    (m2)           (ha)          (berths)
Westhaven (1)                                        51.1       1,492          343             -              -
Half Moon Bay/Bucklands Beach                        10.7         600          178             3.7              90
Hobsonville (2)                                      12.9         592          218            19.7            740
Pine Harbour                                         12.0         554          217             6.8            310
Gulf Harbour                                         32.0       1,033          310             1.3              40
Bayswater                                            10.4         394          263             -              -
Orakei                                                7.0         179          390             -              -
Milford                                               2.6         220          118             -              -
Outboard Boating Club                                 5.8         213          273             -              -
Silo Superyacht Marina (3)                            2.8           10       2,820             -              -
Pier 21 Marina                                        1.3           48         269             -              -
Viaduct Harbour Marina                               12.2         132          922             -              -
Sandspit Marina (1)                                   3.1         131          240             -              -
Whitianga                                             4.0         191          210             -                30
Mahurangi                                             0.4           16         280             -              -
Hobsonville Point (4)                                 -           -            -               4.2            140
TOTAL                                               168.3     5,805.0          302            35.6          1,350
(1) The AUP zoned area extends slightly beyond these marinas, but has been excluded as capacity. CRL have
advised that no further expansion will occur at Westhaven, and the expansion at Sandspit would block the
(2) It has been assumed that 3.7ha of the additional zoned area is excluded to maintain access to the
Henderson Creek channel as advised by CRL.
(3) The water area per berth at this marina has been excluded from the total estimate.
(4) The estimated capacity is based off the total marinas average space per berth (excluding the Silo
Superyacht Marina).

In addition, estimates of capacity have been derived for the other items of marina capital dredging demand
advised by CRL. These are set out in Table 7. Here, it has been assumed that the average digging depth
equates to 2.5m, providing estimates of total water surface area for each marina (based off the capital
works dredging demand stated by CRL). Overall average water space per berth (302m2) has then been
applied to these estimates to estimate the total capacity.

Based on these averages, it is estimated that these additional marinas contain capacity for a further 860
berths. Together, this equates to a capacity for an additional 2,210 marina berths. This is similar to the
estimated additional demand (2,300) for marina berths in Auckland and Whangarei and Thames-
Coromandel districts.

Page | 13
Table 7: Estimated Additional Capacity for Marina Berths – Marinas and Other Identified Areas of Capital
Dredging Demand
Estimated
Capital Marina Estimated
Dredging Water Additional
Demand (m3) Surface Berths
Item of Capital Dredging Demand Area (ha)
Coromandel 100,000 - 130
Tonkin Taylor 300,000 12.0 400
Confidential - Auckland 250,000 10.0 330
SUB-TOTAL 650,000 22.0 860
Existing Marinas 35.6 1,350
TOTAL 57.6 2,210
M.E note that the estimates of additional capacity (in terms of numbers of additional berths) within existing
marinas and newly identified areas of capital dredging demand may be over-stated, and consequently the
demand for dredging estimates may be conservative. This is because trends in boat ownership suggest the
average boat size has increased through time and is likely to continue to increase, resulting in a higher
space requirement per berth.
3.1.3 Capital Dredging Demand from Additional Marina Capacity
M.E have found from the above analysis that the likely capacity from marinas in Auckland and the
Whangarei and Thames-Coromandel districts broadly corresponds to the estimated demand over the next
10 years (including an allowance to meet existing latent demand).
Lastly, M.E have assessed the marina capital dredging demand stated by CRL with estimates of the dredging
required to achieve the above marina expansions using an average digging depth of 2.5m. This is set out in
Table 8. The level of capital dredging stated by CRL is lower than the estimates of dredging at an average
of 2.5m across all marinas, with the exception of Hobsonville Point. It is noted that the total dredging
volume for Hobsonville Point is the total consented dredging volume and there is not a separate consented
volume for annual maintenance dredging. Consequently, M.E have assumed that this total volume includes
any annual maintenance dredging demand.
It may be the case that smaller amounts of dredging is required for a number of marina expansions (than
the average rate at 2.5m depth) as the chart datum is likely to be lower (and therefore, require less
dredging) at the edges of the marina that are already near the deeper areas of the water.
Page | 14Table 8: Comparison of M.E Estimated Marina Dredging Demand with CRL Stated Capital Dredging Demand
Estimated Estimated Capital
CRL Stated Capital
Additional Marina Digging Demand
Dredging Demand
Water Surface based on Average
(m3)
Marina Area (ha) 2.5m Dredging Depth
Half Moon Bay/Bucklands Beach 40,000 3.7 92,000
Hobsonville 350,000 19.7 400,000
Pine Harbour 100,000 6.8 169,000
Gulf Harbour (not incl. in CRL estimates) - 1.3 32,000
Hobsonville Point 214,900 4.2 105,000
TOTAL (excl. Gulf Harbour) 704,900 34.3 766,000
Coromandel 100,000 4.0
Tonkin Taylor 300,000 12.0
Confidential - Auckland 250,000 10.0
COMBINED 1,354,900 60.3
Overall, M.E consider that the volumes for capital dredging demand at marinas stated by CRL are within a
reasonable range. They correspond to the potential expansion for marina activities, which corresponds to
the likely level of demand for marina berths within Auckland and Whitianga over the 2019 to 2029 period.
As such, the marina capital dredging requirements as stated by CRL have been used going forward in the
remainder of M.E’s analysis. The exception is Hobsonville Point where it has been assumed that the capital
dredging component of demand equates to 215,000m3 (i.e. the total consented value less the estimated
maintenance dredging demand)19.
Consequently, in total, M.E consider that there is likely to be a total demand for disposal of 1.35 million m3
of sediment from capital dredging at marinas that potentially could be disposed of at the NDA.
3.2 Maintenance Dredging Demand at Marinas
Maintenance dredging at marinas forms a significant share of the annual demand for sediment disposal.
M.E have analysed the demand for maintenance dredging across the marinas identified within the initial
CRL submission. At the request of the EPA, we have also estimated the total demand for maintenance
dredging sediment disposal across the rest of the marinas in Auckland, the Thames-Coromandel District
and Whangarei District to understand the wider potential demand for sediment disposal at the NDA.
The first part of this section (Section 3.2.1) begins by analysing the past volumes of sediment dredging at
the marinas identified within the initial CRL report, then estimating their likely future maintenance demand.
The remainder of the section (Section 3.2.2) then estimates the additional demand arising from other
marinas within Auckland, and the Thames-Coromandel and Whangarei District’s.
19 M.E note that the total consented dredging demand for Hobsonville Point Marina exceeds the range of our own estimates based
on the application of average digging depths. During discussions with CRL it has been agreed to use the consented value in our
demand estimates as the resource consenting process is more likely to better reflect the sediment characteristics unique to the
local environment and therefore form a more accurate estimation of dredging demand. The total consented volume of 230,000m3
is identified in para 4 of Mr Thompson’s Statement of Evidence (1 November 2018).
Page | 153.2.1 Past and Future Maintenance Dredging Demand at CRL-Served Marinas
Information has been provided on the past maintenance dredging at marinas served by CRL. M.E have
calculated annual average rates of maintenance dredging across these marinas if the dredging were spread
evenly across the 6-year period. These are displayed in Table 9. In total, annual average maintenance
dredging across these marinas has equated to an annual average 17,500m3 of sediment per year across
this period20.
Table 9: Historic Rates of Maintenance Dredging at CRL-Served Marinas, 2013-2018
Estimated Past Advised
Previous Annual
Annual Future Annual
Average
Average Average
Maintenance
Dredging Dredging
Dredging Demand
Depth (m) Depth (m)
Marina
Half Moon Bay/Bucklands Beach 1,279 0.01 0.01
Hobsonville 5,120 0.04 0.12
Pine Harbour 7,587 0.06 0.08
Hobsonville Point - - 0.12
Coromandel - - 0.04
Tonkin Taylor - - 0.04
Confidential - Auckland - - 0.04
Bayswater - - 0.03
Sandspit Marina 860 0.03 0.10
Whitianga 2,652 0.07 0.07
TOTAL CRL MARINAS (1) 17,498
AVERAGE 0.04
(1) Sandspit and Whitianga Marinas differ to the totals in the Sapere Addendum as CRL advises
that information relating to these marinas does not represent a 6 year time period.
M.E have mapped the water surface area of each marina and have equated the dredging volumes into
average dredging depths. CRL have assessed these depths and provided updated information on the future
dredging depths of each marina (also displayed in Table 9). These have also been applied to existing and
future marinas where no information has been available on past dredging. Dredging volumes for
‘Coromandel’, ‘Tonkin Taylor’ and ‘Confidential-Auckland’, as advised, are based on the average past
dredging depth (0.04m) for marinas.
The future dredging depths are based on CRL’s estimate of the rate of sedimentation of each marina. This
is determined by their knowledge of the local sediment environment, rates of tidal movement and water
currents, and location of the marinas. The advised rates of dredging reflect the required sediment volume
20We note that this differs to the Sapere Addendum. This is because CRL have advised that the Whitianga Marina represents only
1 year of data. A total of 5 years of data of partial dredging has also been added to the Sandspit Marina (excluding any capital
dredging).
Page | 16to be removed to enable the marinas to effectively operate. In some cases, future dredging rates differ to
past dredging for the following reasons:
i. Past dredging rates may not be well established where a marina is relatively new and has not
yet experienced sediment build-up. This is the case for Sandspit Marina, where future dredging
rates have been advised based on future volumes for removal estimated by the marina.
ii. The calculation of maintenance dredging volumes from Hobsonville Marina are conservative
when expressed on an annual average basis over the six-year period as dredging up to 2015
was previously disposed of at the AEDG.
iii. Capital dredging (excluded from these rates) may have also simultaneously involved
maintenance dredging. Maintenance dredging of the marina may have occurred at the same
time as capital works to achieve scale economies based on the overall larger volumes of
dredging occurring at the time.
iv. A redistribution of future operational expenditure has allocated a higher share of funding to
dredging. This has occurred across a number of marinas where previous other maintenance
requirements prevented sufficient funding being available for dredging (e.g. Pine Harbour
Marina). Lower rates of past dredging have consequently resulted in greater future dredging
requirements to maintain effective operation of the marina.
The future rates of dredging have been applied to the current and future marina sizes to estimate future
dredging volumes for each marina (see Table 10). The table shows that the future annual average and total
ten-year dredging volumes across the marinas based on future rates identified in Table 9.
Table 10: Estimated Future Maintenance Dredging Volumes by CRL-Served Marinas, 2019-2029
Estimated Marina Water Area Coverage (ha) Estimated Annual Dreding Volumes (m3) Estimated Total
Future Size Dredging
Development Current Size Future Size
Current Size Future Size (previous Volume (m3) (10
Year (future depth) (future depth)
Marina depth) years)
Half Moon Bay/Bucklands Beach 10.7 14.3 2019 1,300 1,700 1,700 17,200
Hobsonville 12.9 28.9 2022 15,500 34,700 11,500 289,200
Pine Harbour 12.0 18.8 2025 9,600 15,000 11,800 117,900
Hobsonville Point - 4.2 2026 - 5,000 1,800 15,100
Coromandel - 4.0 2021 - 1,700 1,700 13,300
Tonkin Taylor - 12.0 2024 - 5,000 5,000 25,000
Confidential - Auckland - 10.0 2023 - 4,200 4,200 25,000
Bayswater 10.4 10.4 3,100 3,100 3,100 31,100
Sandspit Marina 3.1 3.1 3,100 3,100 900 31,400
Whitianga 4.0 4.0 2,800 2,800 2,700 28,100
TOTAL CRL MARINAS 53.1 109.7 35,400 76,400 44,200 593,300
When the future dredging depths are applied to the existing marina sizes, it amounts to an overall annual
average dredging volume of 35,400m3 (including an allowance of 3,100m3 for Bayswater Marina). In
comparison, the past rates of dredging across these marinas was 17,500m3 (Table 9).
The previous section (Section 3.1.2) shows that capacity across a number of these marinas is projected to
increase to meet future boating demand. In total, these marinas are projected to cover an increase of
56.6ha in water surface area to meet this demand. When existing marinas area expanded (Half Moon
Bay/Bucklands Beach, Hobsonville and Pine Harbour) and new marinas area constructed (Hobsonville Point,
Coromandel, Tonkin Taylor and Confidential-Auckland) to meet future boating demand, then the annual
Page | 17average dredging volume will equate to 76,400m3 once the full expansion and construction has occurred. This volume has been calculated based off the advised annual average future dredging depth. Table 10 also demonstrates the effect of capital works alone on marina maintenance dredging volumes. If past rates are applied to the increased marina areas, and the average past rate (0.04m) applied to new marinas (and Bayswater Marina, 0.03m21), then the annual average dredging volume increases to 44,200m3. In total, the future dredging volume across these marinas across the 2019 to 2029 period equates to 593,300m3 of sediment. This is calculated from applying the advised future rates of dredging across the current and anticipated future sizes of the marinas, taking into account time of construction. 3.2.2 Future Maintenance Dredging Demand at Other Marinas Maintenance dredging has also been estimated for other marinas within the Auckland region and Whangarei and Thames-Coromandel Districts that could potentially contribute to demand for sediment disposal at the NDA. A conservative assumption of an annual average dredging depth of 0.01m has been applied to these marinas, and no capital dredging has been assumed. Applying these assumptions, Table 11 estimates that there is likely to be a further 115,200m3 of sediment volume from maintenance dredging at other Auckland marinas, and a further 72,500m3 from other Marinas in the Thames-Coromandel and Whangarei District’s. The estimate total marina maintenance dredging volume demand across all marinas from 2019 to 2029 is 781,100m3. 21We note that the resulting maintenance dredging volumes for Bayswater Marina at this depth (31,1000m3) are less than the consented volume of 50,000m3. Page | 18
Table 11: Estimated Maintenance Dredging Demand for Other Marinas, 2019-2029

                                             Estimated Total
                                            Dredging Volume
Marina                                       (m3) (10 years)

CRL-Served Marinas                                     593,300

Other Auckland Marinas
 Westhaven                                              51,100
 Gulf Harbour                                           32,000
 Orakei                                                  7,000
 Milford                                                 2,600
 Outboard Boating Club                                   5,800
 Silo Superyacht Marina                                  2,800
 Pier 21 Marina                                          1,300
 Viaduct Harbour Marina                                 12,200
 Mahurangi                                                 400
 TOTAL OTHER AUCKLAND MARINAS                          115,200

Other Marinas
 Pauanui Waterways                                      17,700
 Whitianga Waterways                                    23,100
 Whangamata Marina                                       6,800
 Whangarei Marina                                        7,200
 Marsden Cove                                           17,700
 TOTAL OTHER MARINAS                                    72,500

TOTAL ALL MARINAS                                      781,100

3.3         Change in Marina Demand with Change in Sediment
            Disposal Prices
The previous sub-sections have identified the required future volumes of dredging that are required to
enable the recreational and commercial boating sector to continue to effectively operate into the future
and accommodate future growth in demand. A change in the price of sediment disposal may result in a
change in the level of sediment able to be disposed from marinas. It is important to consider the cost that
occur as a result of a change in the level of sediment deposition. This sub-section outlines our consideration
of a change in the levels of sediment disposal and the costs likely to be experienced as a result of these
changes.

Sediment disposal costs have a direct impact on the cost of marina berths. Capital dredging is required to
generate marina capacity, with the cost of disposal having a direct impact on the cost of producing the
berth, and therefore the price at which they are supplied. This is compounded by ongoing maintenance
dredging requirements and associated costs which also have an effect on the cost of the berth (where berth
owners have ongoing fees).

Page | 19
Ongoing maintenance costs are factored into the initial price paid for a berth (if berths are bought rather than rented) as consumers make a judgement on the price paid by combining the initial purchase price and likely ongoing maintenance costs. This associate change in the value of berths will have a corresponding change in the quantity of new marina capacity supplied by the market. To understand the probability of this effect, it is important to identify the relative contribution of dredging sediment disposal costs to the overall cost of berths. Current market information suggests a wide range of berth prices (from $30,000 to $140,000) and correspondingly wide range of ongoing maintenance fees (ranging from $400 to $2,000 per month). CRL have advised that dredging currently equates to around 40% of the berth maintenance fees – a significant proportion. A future redistribution of operational expenditure, to undertake the necessary dredging to enable marinas to continue to operate, means that dredging is likely to account for a higher share of the cost of berths in the future. If in the future dredging accounted for 50% of the berth costs, then a change in the dredging costs from the NDA disposal option to one of the alternative options would result in a 400% to 550% increase in this component of the operation costs. This would correspondingly flow through to a cost increase of around 325% to 350%. The magnitude of these cost changes are significant relative to the total cost of marina space. There are significant costs associated with a change in the level of marina activity. It is important that these are taken into account when considering any change in demand for sediment disposal. A reduced ability to dispose of sediment through an order of magnitude cost change of sediment disposal will effectively constrain the ability of the marine sector to effectively operate as the required dredging may not be able to be undertaken. A reduction in resulting marina activity directly corresponds to a reduction in the benefit consumers experience from recreational boating in New Zealand. Demand for marina capacity (and therefore, dredging) will remain, but will be unmet, existing as a latent demand. Reductions in boating activity have substantial further costs that extent beyond the reduction in benefit from consumers of marina services. These are likely to be changes in employment and expenditure associated with the boating sector, as well as in other industry sectors that supply the industry. Further flow-on effects will occur from a reduction in wages (from lost employment) spent in other household sectors of the economy. These changes in the boating sector are potentially significant for Auckland in particular given the higher relative contribution of the marine industry to the regional economy. Previous studies22 show that the marine sector contributed 4.4% of the region’s total exports and 0.7% of its GRP, with this share projected to increase into the future. Auckland attracted a disproportionate share of the national marine sector (64%), with even higher shares in sub-components of the sector (e.g. superyachts). 22Murray, C. 2009 Industry Snapshot for the Auckland Region: The Marine Sector, prepared by the Social and Economic Research & Monitoring Team at Auckland Regional Council, October 2009. Page | 20
You can also read