Augmenting Social Science Research with Multimodal Data Collection: The EZ-MMLA Toolkit
←
→
Page content transcription
If your browser does not render page correctly, please read the page content below
sensors
Article
Augmenting Social Science Research with Multimodal Data
Collection: The EZ-MMLA Toolkit
Bertrand Schneider * , Javaria Hassan and Gahyun Sung

                                          Harvard Graduate School of Education, Harvard University, Cambridge, MA 02138, USA;
                                          javariahassan@gse.harvard.edu (J.H.); gsung@g.harvard.edu (G.S.)
                                          * Correspondence: bertrand_schneider@gse.harvard.edu

                                          Abstract: While the majority of social scientists still rely on traditional research instruments (e.g.,
                                          surveys, self-reports, qualitative observations), multimodal sensing is becoming an emerging method-
                                          ology for capturing human behaviors. Sensing technology has the potential to complement and
                                          enrich traditional measures by providing high frequency data on people’s behavior, cognition and
                                          affects. However, there is currently no easy-to-use toolkit for recording multimodal data streams.
                                          Existing methodologies rely on the use of physical sensors and custom-written code for accessing
                                          sensor data. In this paper, we present the EZ-MMLA toolkit. This toolkit was implemented as a
                                          website and provides easy access to multimodal data collection algorithms. One can collect a variety
                                          of data modalities: data on users’ attention (eye-tracking), physiological states (heart rate), body
                                          posture (skeletal data), gestures (from hand motion), emotions (from facial expressions and speech)
                                          and lower-level computer vision algorithms (e.g., fiducial/color tracking). This toolkit can run from
                                          any browser and does not require dedicated hardware or programming experience. We compare this
                                          toolkit with traditional methods and describe a case study where the EZ-MMLA toolkit was used by
                                aspiring educational researchers in a classroom context. We conclude by discussing future work and

                                          other applications of this toolkit, potential limitations and implications.
Citation: Schneider, B.; Hassan, J.;
Sung, G. Augmenting Social Science
                                          Keywords: sensor applications and deployments; data mining; computer vision
Research with Multimodal Data
Collection: The EZ-MMLA Toolkit.
Sensors 2022, 22, 568. https://
doi.org/10.3390/s22020568
                                          1. Introduction
Academic Editors: Mimi Recker,
                                               Most fields of research heavily invest in the development of better scientific instru-
Colin Hennessy Elliott and
                                          ments for collecting fine-grained, reliable and accurate data. In Physics, the Large Hadron
Quentin Biddy
                                          Colider is the world’s largest and most powerful particle accelerator; it took decades to
Received: 31 October 2021                 build and cost more than 7.5 billion EUR [1]. In Astronomy, the James Webb Space Telescope
Accepted: 29 December 2021                is capable of observing the most distant events in the universe, and costs around 10 billion
Published: 12 January 2022                dollars [2]. In the social sciences, however, instruments for capturing human behaviors
Publisher’s Note: MDPI stays neutral      have not changed very much over the last century (e.g., questionnaires, interviews, human
with regard to jurisdictional claims in   coding of video/audio data). While these instruments provide useful data for capturing
published maps and institutional affil-   social constructs, they are known to be subject to various cognitive and social biases (e.g.,
iations.                                  confirmation, selection, ordering, recency, priming, social desirability biases-to name a few).
                                               An innovative way of complementing existing instruments in the social sciences is
                                          through multimodal sensing technologies. In education, for example, Multimodal Learning
                                          Analytics (MMLA, [3]) is starting to be used as a methodology for tracking learners’ states.
Copyright: © 2022 by the authors.         MMLA research focuses on using high frequency sensors, such as eye-trackers and motion
Licensee MDPI, Basel, Switzerland.        sensors, harnessing their ability to capture rich physiological and behavioral data [4].
This article is an open access article    Previously in this journal, Schneider et al. [5] have identified over 23 sensor devices that
distributed under the terms and
                                          can be used in the domain of learning. Types of data that can be collected include body
conditions of the Creative Commons
                                          movements, gaze orientation, facial expressions and physiological data such as heart rate.
Attribution (CC BY) license (https://
                                          However, high-quality sensor devices are often expensive and require domain expertise
creativecommons.org/licenses/by/
                                          to understand and use [6]. Processing the generated data also requires skill and domain
4.0/).

Sensors 2022, 22, 568. https://doi.org/10.3390/s22020568                                                  https://www.mdpi.com/journal/sensors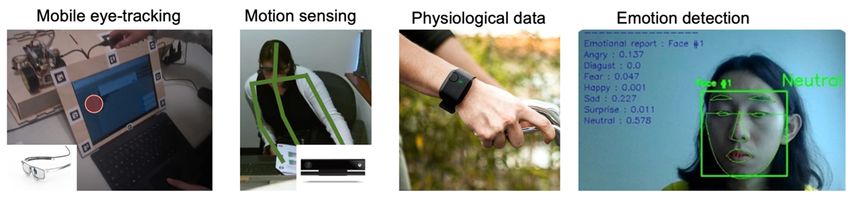
Sensors 2022, 22, 568                                                                                            2 of 18

                        knowledge. In contrast, less-sophisticated modalities such as video and audio, which
                        have a smaller cost and overhead in setting up, are limited by the quality of information
                        they provide.
                              Considering these deficiencies, this paper presents the design, development and eco-
                        logical use of a data collection website called the EZ-MMLA Toolkit. The website provides
                        an intuitive, unintrusive, low-cost and ethical approach to collecting multimodal data
                        using machine learning models that extract information from video and audio recordings.
                        Currently, the modalities that can be collected through the website include body posture,
                        facial landmarks, gaze location, emotion, heart rate and hand gestures.
                              In developing our toolkit, we accounted for important design and ethical consid-
                        erations. First, the complexities of the machine learning models are hidden behind a
                        user-friendly web interface that anyone can use irrespective of their level of technical
                        knowledge. Moreover, the model computations happen directly in the browser, which
                        means that sensitive video and audio data are not shared through a network and data
                        privacy is maintained by the user. Lastly, our application allows for data collection through
                        any browser and webcam, rather than through traditionally used expensive, individual
                        physical sensors. This significantly reduces costs and makes multimodal data collection
                        relatively inexpensive and broadly accessible to a wide range of users worldwide.
                              We further offer potential applications of our toolkit and present a case study where the
                        website was used to teach a course on multimodal learning analytics. We report students’
                        feedback on the toolkit, describe the projects they worked on using the toolkit, and present
                        preliminary research questions that can be explored by collecting and analyzing students’
                        multimodal data.
                              We first provide an overview of past literature in Section 2. We then describe con-
                        ventional approaches to multimodal data collection in Section 3. The system description,
                        case study, and preliminary research questions are explained in Section 4. Finally, we
                        describe limitations and directions for future research in Section 5 and conclude the paper
                        in Section 6.
                              In sum, the current paper contributes to the scientific community by introducing
                        an intuitive, unintrusive, low-cost, and ethical approach to collecting multimodal data
                        using cutting-edge machine learning models. Our implementation of this approach, the
                        EZ-MMLA toolkit, differentiates itself from preexisting attempts to assist multimodal data
                        collection by its accessible and open-source nature; prior software for multimodal data
                        collection has largely been proprietary or designed to be used exclusively by programmers
                        (Section 2.2). Our case study also demonstrates the toolkit’s potential to democratize
                        sensor-data based research (Section 4), making multimodal data collection accessible to
                        novice researchers and research groups lacking extensive resources (see Section 4.2 for a
                        comparison with other toolkits).

                        2. Literature Review
                        2.1. Why Multimodal Sensing? Examples from Educational Research
                             Recently, data collection and analysis of multimodal data has become accessible and
                        popular among social scientists. In educational research, the field of Multimodal Learning
                        Analytics (MMLA) has helped researchers understand and model complex learning pro-
                        cesses generally overlooked by traditional approaches. In this section, we provide examples
                        showing how MMLA has been used to support research, teaching, and augment traditional
                        learning environments.
                             MMLA has helped educational researchers reach new insights when analyzing multi-
                        modal data collected from learners. Motion data of students engaged in classroom activities
                        can significantly predict learning outcomes [7]; linguistic, textual and speech data can
                        provide useful information about students’ level of expertise [8]); and affective data has
                        been correlated with students’ performance on standardized tests [9]. From a practical
                        perspective, these insights can be used by educators to inform their teaching practices and
                        personalize instruction. For example, gaze data can be used to enhance Interactive Tutoring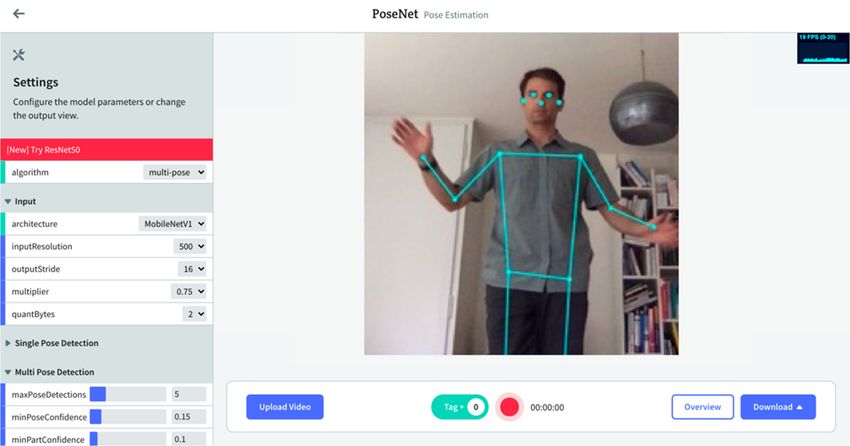
Sensors 2022, 22, 568                                                                                             3 of 18

                        Systems (ITS [10]). MMLA also has the potential to make statistics and data mining more
                        accessible to non-technical students. Schneider, Reilly, & Radu [11] used multimodal sen-
                        sors to teach MMLA concepts to educators and practitioners. Their findings suggest that
                        multimodal data can create more engaging, relevant, hands-on learning activities compared
                        to traditional data analysis courses.
                              Educational researchers have also used MMLA-based applications to support class-
                        room learning and teaching. Maldonado et al. [12] used motion (i.e., Pozyx) sensors to
                        track instructors’ location in lab settings. Teachers reported that the data was helpful for
                        reflecting on their day-to-day work and for sharing best practices with others. Ref. [13]
                        developed the Sensei system, which tracks children’s location in Montessori classrooms.
                        The authors found that Sensei has the potential to augment teachers’ observations, help
                        them plan personalized curricula for students, and identify children who receive less atten-
                        tion. A similar example for adult education is the EduSense platform [14] which generates
                        behavioral data on students (e.g., body postures, speech time, head orientation). The
                        data is available to teachers and can provide useful insights about students’ engagement
                        and attention.

                        2.2. Current Toolkits Used to Conduct Multimodal Research
                              While this work is promising, multimodal sensing is not a widely used methodology
                        in the social sciences because of the knowledge required to collect, process and analyze
                        multimodal datasets. There are several significant obstacles that researchers need to
                        overcome: (1) cost: while some sensors are relatively low cost, most are prohibitively
                        expensive (e.g., a professional eye-tracker can cost thousands of dollars); (2) data extraction:
                        either researchers use proprietary softwares (which can be more expensive than the sensor
                        itself) or they create a software that can access the data via an API or other interface (which
                        requires an engineer or expert coding skills); (3) data synchronization: oftentimes sensors are
                        built to be used alone, and not in conjunction with other sensors (again, engineering skills
                        are required to “fuse” different datasets together).
                              There are very few toolkits or software that facilitate multimodal data collection.
                        iMotions [15], for example, is a proprietary software that provides an all-in-one solution
                        for conducting multimodal research—but at a price that most researchers cannot afford
                        with each modality costing a recurring subscription fee. The Social Signal Interpretation
                        (SSI [16]) framework is an open-source project that offers tools to record, analyze and
                        recognize human behavior in real-time. However, the framework is designed to be used by
                        programmers and involves a steep learning curve (i.e., users need to go through a lengthy
                        documentation to create simple data collection pipelines). Both toolkits require dedicated
                        physical sensors (e.g., eye-trackers, physiological sensors) that can be prohibitive. There
                        are also webcam-based multimodal data collection toolkits, such as MediaPipe [17] which
                        provides various computer vision algorithms (e.g., face detection, hand/pose tracking,
                        object detection, etc.) in one easy to use package for programmers. However, mediaPipe
                        was designed to be used in various programming languages (C++, Python, JavaScript), for
                        example for developing augmented reality or robotic applications, and not for multimodal
                        data collection.
                              With these considerations in mind, we developed a new web-based multimodal data
                        collection platform: the EZ-MMLA toolkit. This toolkit does not require physical sensors,
                        such as dedicated eye-trackers or motion sensors, or any extra software to be installed
                        locally. It runs in popular browsers (e.g., Chrome, Firefox, Safari) and is available to anyone
                        for free around the globe at mmla.gse.harvard.edu. The EZ-MMLA toolkit is a significant
                        step toward lowering access to multimodal data for researchers and practitioners. In
                        the next section, we compare traditional ways of collecting multimodal data with the
                        EZ-MMLA toolkit.
Sensors 2022, 22, x FOR PEER REVIEW 4 of 19
Sensors 2022, 22, 568 the next section, we compare traditional ways of collecting multimodal data with the4 of
EZ-18
MMLA toolkit.
3.
3. Multimodal
Multimodal Data
Data Collection
Collection
This
This section describes the
section describes the conventional
conventional approach
approach towards
towards multimodal
multimodal data
data collection
collection
in research (Figure 1) and contrasts that with the new, proposed approach.
in research (Figure 1) and contrasts that with the new, proposed approach.
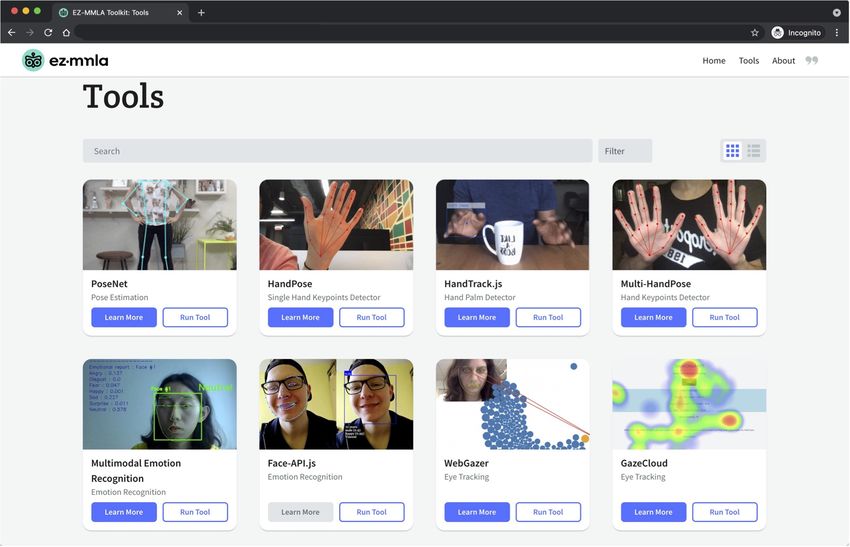
Figure 1. Use of sensors in aa typical
typical multimodal
multimodal study.
study. Left:
Left: mobile
mobile eye-tracker.
eye-tracker. Middle: Motion
sensors
sensors and Electrodermal wristbands (Empatica E4). Right: emotion detectionfrom
and Electrodermal wristbands (Empatica E4). Right: emotion detection from facial
facial expres-
expres-
sions. Mobile eye-trackers are expensive wearable sensors and data processing software
sions. Mobile eye-trackers are expensive wearable sensors and data processing software tend to be
tend to
proprietary. The Kinect sensor is more affordable but does not come with an easy-to-use data col-
be proprietary. The Kinect sensor is more affordable but does not come with an easy-to-use data
lection package; recording the data requires some programming knowledge. The Empatica E4 is
collection package; recording the data requires some programming knowledge. The Empatica E4 is
also relatively expensive and data extraction requires proprietary software.
also relatively expensive and data extraction requires proprietary software.
3.1.
3.1. Conventional
Conventional Multimodal
Multimodal Data
Data Collection
Collection
Multimodal
Multimodal data
data collection
collection has conventionally required
has conventionally required setups involving physical
setups involving physical
sensors,
sensors, proprietary tools, and external contractors. Data collection hardware can require
proprietary tools, and external contractors. Data collection hardware can require
complex setupsand
complex setups andoperating
operatingprocedures
procedures that
that researchers
researchers are unable
are unable or unwilling
or unwilling to
to learn.
learn. Proprietary software or working with contractors can be expensive and
Proprietary software or working with contractors can be expensive and unsustainable. Each unsustain-
able. Each dataused
data modality modality used in
in research research
comes withcomes
its ownwith itscosts
set of own and
set of costs and Combining
challenges. challenges.
Combining
multiple data multiple data different
types from types from differentand
hardware hardware
software and
forsoftware for a truly multi-
a truly multimodal study
modal
requiresstudy requires
additional additional coordination
coordination efforts
efforts and data and data
analysis analysis
expertise. In expertise. In sum,
sum, multimodal
multimodal data
data collection collection
has often beenhassubject
often been
to thesubject to the
following following constraints:
constraints:
•• Accessibility: Logistically challenging data collection and data analyses processes can
restrict access
access to tousers
userswithout
withouta astrong
strong technical
technical background
background (c.f.,
(c.f., computer
computer scien-
scientists,
tists, engineers, statisticians).
engineers, statisticians).
•• Affordability:
Affordability: WhileWhilesensors
sensorsare are becoming
becoming moremore affordable
affordable as a as a whole,
whole, research-
research-grade
grade equipment
equipment still to
still tends tends to beinhibitive.
be cost cost inhibitive. This results
This results in multimodal
in multimodal data re-
data research
search being restricted
being restricted to well-funded
to well-funded teams or teams
to moreorcommercially
to more commercially lucrative
lucrative research re-
areas.
• search
Invasiveness:
areas. Sensors created for research can still be bulky and invasive for human
• participants,
Invasiveness:impacting
Sensors createdthe state
for of the participant,
research can still be their
bulkyreaction to stimuli,
and invasive or how
for human
aware they are of being observed. This can create noise in the data,
participants, impacting the state of the participant, their reaction to stimuli, or how or be the cause of
Hawthorne
aware effects
they are and similar
of being observed.biases.
This can create noise in the data, or be the cause of
Hawthorne effects and
Issues of accessibility, similar biases.
affordability, and invasiveness have constrained the widespread
adoption
Issuesandof scale of multimodal
accessibility, research.
affordability, and The complexityhave
invasiveness of data collection the
constrained processes
wide-
also make
spread it difficult
adoption to develop
and scale a systemresearch.
of multimodal of frequent Theassessment
complexityand redesign,
of data which
collection is
pro-
integralalso
cesses in application studies.
make it difficult to develop a system of frequent assessment and redesign,
which Yet, with advances
is integral in computer
in application studies.vision, machine learning, and computer hardware,
thereYet,
are new possibilities for streamlining
with advances in computer vision, and improving
machine the accessibility
learning, and computer of multimodal
hardware,
data collection. Researchers can now replace a number of existing data
there are new possibilities for streamlining and improving the accessibility of multimodal collection methods
with inexpensive and user-friendly software-based approaches [18].
data collection. Researchers can now replace a number of existing data collection methods For instance, heart
rate tracking is traditionally performed with an electrocardiogram
with inexpensive and user-friendly software-based approaches [18]. For instance, heart attached to sensors,
placed
rate on participants
tracking to measure
is traditionally electrical
performed with signals in the heart. Heart
an electrocardiogram rate data
attached to can now
sensors,
placed on participants to measure electrical signals in the heart. Heart rate data can nowa
be measured with a simple webcam and a computer vision algorithm that calculates
participant’s
be measured microscopic
with a simple skin tone differentials
webcam and a computer to infer theiralgorithm
vision heart ratethat [19].calculates
While this a
measure may not be as accurate as electrocardiograms, it provides a reasonable proxy for
heart rate measures while being minimally invasive and requiring no specialized hardware.
Sensors 2022, 22, x FOR PEER REVIEW 5 of 19
participant’s microscopic skin tone differentials to infer their heart rate [19]. While this
Sensors 2022, 22, 568 measure may not be as accurate as electrocardiograms, it provides a reasonable proxy 5 offor
18
heart rate measures while being minimally invasive and requiring no specialized hard-
ware. We expect such web-based algorithms to significantly improve in their accuracy
over the next decade with advances in computer vision and machine learning methods.
We expect such web-based algorithms to significantly improve in their accuracy over the
Established machine learning algorithms can now be feasibly used to develop alter-
next decade with advances in computer vision and machine learning methods.
natives to conventional multimodal data collection methods. With time, researchers may
Established machine learning algorithms can now be feasibly used to develop alterna-
have to deal less and less with the restrictions and limitations associated with conven-
tives to conventional multimodal data collection methods. With time, researchers may have
tional methods for multimodal data collection. There is now the opportunity for multi-
to deal less and less with the restrictions and limitations associated with conventional meth-
modal research tools to be democratized [11]. Open-source implementations and libraries
ods for multimodal data collection. There is now the opportunity for multimodal research
allow easier entry into the field, and there is also the possibility of tools, new methods,
tools to be democratized [11]. Open-source implementations and libraries allow easier
and particular pipelines being updated by a wider community of researchers with varying
entry into the field, and there is also the possibility of tools, new methods, and particular
expertise.being updated by a wider community of researchers with varying expertise.
pipelines
3.2. Web-Based
3.2. Multimodal Data
Web-Based Multimodal Data Collection
Collection
Large machine
Large machine learning
learning applications
applications can can now
now operate
operate online
online in in real-time
real-time withwith sup-
sup-
port from
port from open-source
open-source development
development teams teams such
such asas Google’s
Google’s TensorFlow.js.
TensorFlow.js. As As such,
such, our
our
proposed approach for multimodal data collection is to utilize web-based
proposed approach for multimodal data collection is to utilize web-based platforms and ap- platforms and
applications
plications for for
datadata collection.
collection. This This platform
platform is primarily
is primarily intended intended to be
to be used byused by re-
researchers
searchers
for for multimodal
capturing capturing multimodal
data duringdata during experiments
web-based web-based experiments
but can also but can also
be used by end be
used by
users endasusers
such such and
teachers as teachers
students.andFor
students.
instance,Fortheinstance,
tool hasthebeen
tool has
usedbeen
with used with
consent
consent
to collecttodata
collect
fromdata from students
students in an introductory
in an introductory data analysis
data analysis course tocourse to gain for
gain insights in-
sights forand
teaching teaching
to alsoand to also
serve as rawserve
dataasfor
rawdatadata for dataassignments.
analysis analysis assignments.
For research, the web-based platform can serve as an online portal that researchers
use toto design
designand andcarry
carryout
outmultimodal
multimodal research
research experiments.
experiments. Researchers
Researcherscan set
canup setsim-
up
simple experiments
ple experiments onplatform,
on the the platform,
or theyorcan
they usecan usecomputer
other other computer
setups andsetups
haveandthe have
plat-
the
formplatform
runningrunning in the background
in the background for data for data collection.
collection. ParticipantsParticipants
will enterwill
the enter
platformthe
platform
on their endon their end andwith
and engage engage the with the experiment
experiment from either from either a specified
a specified computer computer
or their
or
owntheir own while
devices devices while carrying
carrying out the
out the tasks tasks
of the of the experiment.
experiment. During this During
time,this
the time,
platformthe
platform will capture and real-time process the video and audio of the
will capture and real-time process the video and audio of the participant through the com- participant through
the computer’s
puter’s webcamwebcam and microphone
and microphone with
with user user permission.
permission. The is
The result result is a processed,
a processed, orga-
organized multimodal
nized multimodal datasets
datasets thatready
that are are ready for analysis.
for analysis. Ideally,
Ideally, all processing
all processing occurs occurs
real-
real-time
time on the onlocal
the local computer
computer so no
so that thatvideo
no video or photos
or photos are saved.
are saved. Figure Figure
2 is a2visual
is a visual
rep-
representation
resentation comparingcomparing a standard
a standard multimodal
multimodal datadata collection
collection process
process (left)(left)
withwith the
the pro-
proposed web-based solution
posed web-based solution (right). (right).
Figure 2.
Figure 2. The
The image
image on
on the
the left
left represents
represents aa typical
typical multimodal
multimodal data
data collection
collection process,
process, involving
involving
physical sensors, proprietary software, or external contractors. The diagram on the right represents
physical sensors, proprietary software, or external contractors. The diagram on the right represents
how data collection in the EZ-MMLA website is carried out locally with JavaScript models.
how data collection in the EZ-MMLA website is carried out locally with JavaScript models.
Sensors 2022, 22, x FOR PEER REVIEW 6 of 19
Sensors 2022, 22, 568 6 of 18
The remaining sections of this paper describe our implementation of a web-based
multimodal data collection
The remaining sectionssystem,
of thisthe EZ-MMLA
paper describeToolkit. The toolkit is built
our implementation of ausing open-
web-based
source implementations to collect multimodal data from video and audio input that
multimodal data collection system, the EZ-MMLA Toolkit. The toolkit is built using open- can
either be
source uploaded or captured
implementations real-time.
to collect multimodal data from video and audio input that can
either be uploaded or captured real-time.
4. System Description
4. System Description
The EZ-MMLA Toolkit is a website that provides users with tools to collect multi-
modalThe EZ-MMLA
data Toolkit
(Figure 3). Thisisdata
a website
can bethat provides
collected users
from withand
video toolsaudio
to collect multimodal
input, captured
data
either(Figure 3). This
in real-time or data can befor
uploaded collected from video
post-processing. and of
Some audio input,of
the types captured
data thateither in
can be
real-time
collected oron uploaded
the websiteforare
post-processing.
body posture, Some
facial of the types of
orientation, data
gaze that canemotion
location, be collected
and
on therate.
heart website are body posture, facial orientation, gaze location, emotion and heart rate.
Figure 3.
Figure 3. The
The Tools
Tools page
page of
of the
the EZ-MMLA
EZ-MMLA toolkit.
toolkit. This
This page
page consists
consists of
of aa list
list of
of tools
tools available
available for
for
multimodal data collection. Each tool contains a link to start running the tool and a link to learn
multimodal data collection. Each tool contains a link to start running the tool and a link to learn more
more about how the tool works. Figure 4 shows the page for running PoseNet, which opens up
about how the tool works. Figure 4 shows the page for running PoseNet, which opens up when the
when the user clicks on the “run tool” button.
user clicks on the “run tool” button.
The EZ-MMLA Toolkit utilizes JavaScript machine learning algorithms that run en-
tirely within the web browser to capture data from video and audio input. These models
offer a host of benefits compared to traditional models that are deployed on remote servers
and accessed via API calls. A major advantage is that the computation needed to train
the models and run predictions is offloaded to the user’s own device, rather than an ex-
ternal server. Therefore, the need to maintain an expensive remote machine is eliminated,
which allows the EZ-MMLA Toolkit to have stable performance even with high user traffic.
Furthermore, many of our models run on Tensorflow.js, a machine learning library in
JavaScript, which is able to automatically determine a device’s unique set of constraints,
like available WebGL APIs, and handle the model configurations. This makes our applica-
tion compatible with various devices. It also allows for seamless integration of the models
into our application, as we do not need to manually code for device constraints.
Sensors 2022,
Sensors 2022, 22,
22, 568
x FOR PEER REVIEW 77 of
of 19
18
(a)
(b)
Figure 4. (a)
Figure 4. (a) The
The pose-detection
pose-detection tool’s
tool’s data
data collection
collection page
page from
from thethe EZ-MMLA
EZ-MMLA Toolkit
Toolkit (PoseNet).
(PoseNet).
This page displays a real-time video recording of the user, with the model’s predicted pose coordi-
This page displays a real-time video recording of the user, with the model’s predicted pose coordinates
nates overlaid on top. In the top-right corner of the screen, there is an information box displaying
overlaid on top. In the top-right corner of the screen, there is an information box displaying the
the rate at which each frame is being processed per second by the model. In the left corner, there is
arate at which
controller toeach
changeframe
the is being configurations
various processed per second by theasmodel.
of the model well asInthe
thedisplay
left corner, there
output. At is
thea
controller to change the various configurations of the model as well as the display
bottom of the screen, there is a recording bar that contains (1) a recording button to start and stop output. At the
bottom
data of the screen,
recording, (2) anthere is a recording
overview button tobarprovide
that contains (1) a recording
a summary button
of the data to startinand
collected stop data
a recording,
(3) a download button to save the generated data as a CSV file, (4) an upload video button for (3)
recording, (2) an overview button to provide a summary of the data collected in a recording, pro-a
cessing pre-recorded videos, and (5) a tag button to add tags to the data as the recording
download button to save the generated data as a CSV file, (4) an upload video button for processing takes place.
(b) A snippet videos,
pre-recorded of the CSV
and file
(5) aoftag
thebutton
data collected
to add tagsby to
PoseNet
the data (i.e., frame
as the number,takes
recording timestamp,
place. (b)andA
for each body joint, the x, y predicted coordinates and the associated confidence
snippet of the CSV file of the data collected by PoseNet (i.e., frame number, timestamp, and for each level of that pre-
diction).
body joint, the x, y predicted coordinates and the associated confidence level of that prediction).
The EZ-MMLA
Additionally, Toolkit
direct utilizes
browser JavaScript
integration machine
of the learning
tools makes algorithms
it easy to connect that run en-
models to
tirely
device inputs like microphones and webcams. It also allows for personal video andmodels
within the web browser to capture data from video and audio input. These audio
offer
data to a host of benefitswithin
be processed compared to traditional
the user’s models
own devices; so that
usersare
dodeployed
not haveon to remote
worry aboutserv-
ers
the and accessed
security risks via API calls.
of sending A major
their advantage
sensitive is that
information theacomputation
over network. Finally, needed the to train
models
the
allow models and real-time
for rapid run predictions is offloaded
inferencing to the user’sleading
on the client-side, own device,
to morerather than an ex-
comprehensive
ternal server. Therefore,
data generation the need
and smoother user to experiences.
maintain an expensive
The EZ-MMLA remote machine
Toolkit is eliminated,
is free to use and
publicly available; it can be used by all educational practitioners, researchers, anduser
which allows the EZ-MMLA Toolkit to have stable performance even with high traf-
learners.
fic. Furthermore,
The EZ-MMLA many of our
Toolkit modelshas
website run on Tensorflow.js,
been designed withaamachine learning
user-friendly library
interface in
that
JavaScript,
is minimalist which
and is ablenot
does to require
automatically determine atechnical
any pre-requisite device’sknowledge
unique set to of use.
constraints,
On the
like
toolsavailable
page, usersWebGL APIs,from
can select and handle
an index theofmodel configurations.
data-collection This makes
tools, provided in our
bothappli-
a list
cation
and a gridcompatible
format,withwhichvarious devices.toItaalso
correspond allows fordata
multimodal seamless
type. integration of the mod-
Figure 4 illustrates the
grid-format
els of this page. as
into our application, When
we doa user
notselects
need totomanually
run a tool,code
theyfor
aredevice
directed to the respective
constraints.
tool’sAdditionally,
run page where theybrowser
direct can either execute data
integration collection
of the in real-time
tools makes it easy through
to connect a webcam
models
or microphone
to device inputsfeed likeormicrophones
upload a recording. Figure 4a
and webcams. It is a screenshot
also allows forofpersonal
the pose-detection
video and
tool from
audio datathe
to EZ-MMLA
be processed Toolkit.
withinOnce the tracking
the user’s is complete,
own devices; the do
so users usernotis have
shown toaworry
short
The EZ-MMLA Toolkit website has been designed with a user-friendly interface that
is minimalist and does not require any pre-requisite technical knowledge to use. On the
tools page, users can select from an index of data-collection tools, provided in both a list
and a grid format, which correspond to a multimodal data type. Figure 4 illustrates the
grid-format of this page. When a user selects to run a tool, they are directed to the respec-
Sensors 2022, 22, 568 tive tool’s run page where they can either execute data collection in real-time through 8 of 18
a
webcam or microphone feed or upload a recording. Figure 4a is a screenshot of the pose-
detection tool from the EZ-MMLA Toolkit. Once the tracking is complete, the user is
shown
summary a short summary
of the data thatofwas
the data that was
collected, andcollected, andprompted
then either then eithertoprompted
downloadtothe down-
data
load the data
as a CSV as a CSV
file (Figure 4b)file (Figurethe
or restart 4b)tool.
or restart
Detailsthe tool.structure
of the Details of the CSVstructure of the
file and the
machine
CSV learning
file and models underlying
the machine learning modelseach tool can be found
underlying eachunder thebe
tool can tool’s “Learn
found underMore”
the
page. “Learn
tool’s These tools
More”can be run
page. Thesein atools
browser
can be inrun
the in
background
a browser in while
the students
background complete
while
classroom
students work onclassroom
complete their devices,
workand on this
theirdata can then
devices, and be
thisgathered
data canbythenthebe
instructor
gatheredand by
analyzed to determine student learning.
the instructor and analyzed to determine student learning.
While we
While we are
are regularly
regularly adding
adding new data collection channels,channels, the EZ-MMLA
EZ-MMLA toolkittoolkit
currently provides
currently provides the
the following
following datadata collection
collection capabilities:
capabilities: eye-tracking,
eye-tracking,pose posedetection,
detection,
hand tracking,
hand tracking, emotion
emotion detection
detection fromfrom facial
facial expressions,
expressions, emotion
emotiondetection
detectionfrom
fromspeech,
speech,
heart rate
heart rate detection,
detection, object
object detection
detection andand lower-level
lower-level detectors
detectors (e.g.,
(e.g., color
color tracking
tracking and and
fiducial tracking). Figure 5 contains screenshots of six tools offered
fiducial tracking). Figure 5 contains screenshots of six tools offered by the toolkit:by the toolkit:
(a) (b) (c)
(d) (e) (f)
Figure
Figure 5.5.Screenshots
Screenshots ofofsome of the
some tools
of the featured
tools on the
featured onEZ-MMLA website.
the EZ-MMLA (a) eye-tracking
website. (using
(a) eye-tracking
webgazer.cs.brown.edu, accessed on 10 October 2020); (b) pose detection (using ml5js.org/refer-
(using webgazer.cs.brown.edu, accessed on 10 October 2020); (b) pose detection (using ml5js.org/
ence/api-PoseNet, accessed on 10 October 2020); (c) hand tracking (using storage.goog-
reference/api-PoseNet, accessed on 10 October 2020); (c) hand tracking (using storage.googleapis.
leapis.com/tfjs-models/demos/handpose, accessed on 10 October 2020); (d) emotion detection (using
com/tfjs-models/demos/handpose, accessed
github.com/justadudewhohacks/face-api.js, on 10 on
accessed October 2020);2020);
10 October (d) emotion
(e) heartdetection (using
rate detection
github.com/justadudewhohacks/face-api.js, accessed on 10 October 2020); (e) heart
(using photoplethysmography from github.com/avinashhsinghh/Heart-Rate-Detection, accessed rate detection
(using
on photoplethysmography
10 October from
2020); (f) a sample github.com/avinashhsinghh/Heart-Rate-Detection,
output accessed on
of emotion detected from speech (using github.com/maelfa-
bien/Multimodal-Emotion-Recognition, accessed on 10 October 2020). Besides these six, the
10 October 2020); (f) a sample output of emotion detected from speech (using github.com/maelfabien/ website
offers additional data collection tools.
Multimodal-Emotion-Recognition, accessed on 10 October 2020). Besides these six, the website offers
additional data collection tools.
Finally, the EZ-MMLA toolkit facilitates multimodal data fusion. Typically, data fu-
Finally,
sion is the EZ-MMLA
a difficult problem to toolkit facilitates
solve because multimodal
different devicesdata
(e.g.,fusion. Typically,
eye-tracking data
goggles,
fusion is a difficult
physiological problem
wearables, to solve
motion because
sensors) different
have devices
their own data(e.g., eye-tracking
processing units.goggles,
These
physiological
units wearables,
often have motionclock,
their internal sensors) havedata
collect theiratown data processing
different frequenciesunits.
and These units
sometimes
often have their internal clock, collect data at different frequencies and sometimes cannot
guarantee a consistent data collection rate. In comparison, when users work with a single
video recording, the video can be post-processed by a variety of tools on the EZ-MMLA
website, for example to extract participants’ body posture, hand gestures, heart rate and
emotion from facial expressions. Each row of the resulting datasets is tagged with the
corresponding frame number of the video, therefore the datasets can be easily joined on this
column. While the EZ-MMLA toolkit does not combine data for users, this can easily be
achieved using a programming language (e.g., in 1–2 lines of code using the library Pandas
in Python), a third-party software (e.g., Tableau, Rapidminer) or even manually (e.g., by
copying/pasting additional columns using a spreadsheet manager such as Microsoft Excel).
Using a single video as a data source makes multimodal data fusion straightforward—and
avoids the need for complex solutions typically used for this type of problem (e.g., time
synchronization with an external server, or direct clock synchronization across devices). In
Sensors 2022, 22, 568                                                                                                         9 of 18

                                future iterations of the website, we are planning to include dedicated tools for multimodal
                                data extraction and fusion (i.e., where one video can be processed to generate one unique
                                csv file with multiple modalities).

                                4.1. Comparing the EZ-MMLA Toolkit with Traditional Data Collection Tools
                                     While computer-vision algorithms provide users with new ways of capturing multi-
                                modal data, they are not interchangeable with physical sensors. Sometimes webcam-based
                                tools are equivalent to (or better than) dedicated sensors, and sometimes dedicated sensors
                                provide better data. Table 1 provides a summary of the differences between these two
                                approaches for a few modalities:

                                Table 1. Comparison of Physical and Webcam-based sensors across different modalities. Exemplar
                                tools are underlined. Pros and cons are described below each tool.

            Modality                            Physical Sensor                               Webcam-Based Sensor
                                Kinect v2 ©                                       PoseNet
 Skeletal tracking              Pro: 3D tracking                                  Con: 2D tracking (no depth)
                                Con: Noisy in case of occlusions; discontinued    Pro: more accurate in case of occlusions
                                Tobii 4C/5 ©                                      Webgazer
 Eye-tracking                   Pro: accurate                                     Pro: can be integrated to any website
                                Con: cost                                         Con: less accurate
                                                                                  Google AI Hand Tracking
                                Leap Motion ©
 Hand tracking                                                                    Pro: as accurate as physical sensors
                                Pro: easily integrated to any headset
                                                                                  Con: slow for multiple hands
                                Empatica E4 ©
                                                                                  Video Magnification [19]
                                Pro: electrodermal (EDA) data
 Physiological sensing                                                            Con: no EDA data
                                Pro: accurate heart rate (HR) data
                                                                                  Con: noisy HR data
                                Con: cost
                                Con: cost (requires a dedicated device/license)   Pro: easy to set up, anyone can collect data
 Applicable to all modalities   or the use of an SDK to access the data           Pro: data is processed locally (via JavaScript)
                                Pro: data quality is guaranteed                   Con: data quality can vary

                                     In terms of accuracy, we can see that webcam-based data collection tools tend to be
                                less accurate than dedicated sensors, e.g., Tobii 4C/5 is more accurate than Webgazer for
                                eye-tracking and Empatica E4 is more accurate than Video Magnification for heart rate
                                detection. However, the webcam-based sensor algorithms have been steadily improving as
                                consumer hardware becomes faster, higher resolution, and more affordable. For example,
                                the Microsoft Kinect sensor was the cutting-edge skeletal motion tracking technology for a
                                long time. With the advent of OpenPose, PoseNet, and other related computer vision-based
                                body tracking algorithms, regular cameras can provide better tracking accuracy (at least
                                for 2D pose detection). These algorithms are very promising methods for performing data
                                collection on a large scale, and some can achieve near real-time performance. We expect
                                that many other algorithms will also significantly improve their accuracy over time.
                                     Concerning cost, we can see from Table 1 that many physical sensors are more ex-
                                pensive (e.g., the Empatica E4 costs more than a thousand dollars) than their web-based
                                counterparts. This limits the use of these physical sensors to more well-funded research
                                teams or more commercially lucrative research areas. In contrast, many of the webcam-
                                based models are open-source and the computation needed to run them is offloaded to the
                                user’s device. This eliminates the need to maintain an expensive remote server to run the
                                models, thereby allowing our application to be free to use and publicly available.
                                     Moreover, webcam-based data collection tools provide many more benefits that physi-
                                cal sensors traditionally do not offer. While physical sensors can generally be unintuitive
                                as they require domain expertise, proprietary tools, and external contractors to understand
                                and use, our toolkit has been specifically designed with a user-friendly interface that any-
Sensors 2022, 22, 568                                                                                          10 of 18

                        one can use to collect data despite their technical abilities. Furthermore, a challenge of
                        physical sensors is that they can be intrusive and unnatural to wear for participants (e.g.,
                        eye tracking headsets), which can create noise in the data. Therefore, it is preferable to use
                        audiovisual modalities to interfere as little as possible while keeping real-time feedback,
                        which the algorithms in our toolkit provide. Finally, data fusion can be a difficult task to
                        solve with physical devices that typically have their own data processing units and internal
                        clocks. The EZ-MMLA toolkit, on the other hand, tags each row of the resulting datasets
                        with the corresponding frame number of the media, so different datasets can be merged on
                        this column.

                        4.2. Possible Applications of the EZ-MMLA Toolkit
                              In this section we describe potential applications of the EZ-MMLA website, to provide
                        examples of the potential of this toolkit. We categorize a few potential uses based on
                        different audiences (researchers, teachers, learners, engineers).
                              First, social scientists can use multimodal data collection tools when conducting
                        controlled experiments. As mentioned above, the website allows for real-time detection of
                        body postures, hand movements, emotion detection, gaze direction, heart rate estimation,
                        to name a few. Generating fine-grained datasets on these behaviors can speed up research
                        by minimizing the need to hand-code video recordings. It can also provide a new lens
                        for investigating social behaviors, especially when these behaviors are difficult to observe
                        (e.g., subtle hand movements, physiological changes). A final advantage of the EZ-MMLA
                        website is that it can also post-process video recordings; which means that researchers
                        can generate new datasets on old studies to investigate new research questions. For
                        example, a group of social scientists might be interested in questions of proxemics [12];
                        using PoseNet, they can precisely compute distances between participants and conduct
                        fine-grained analyses of previously run experiments. Without PoseNet, this would require
                        hundreds of hours of painfully annotating video frames.
                              Second, EZ-MMLA website can be used by learners and promote data literacy. Scien-
                        tists can learn a great deal by collecting large multimodal datasets, so why not students?
                        Given that the website is intuitive and easy to use, it can be used by young adults to explore
                        data visualization, data analysis and data mining techniques. One promising application of
                        this approach is through quantified self-projects [20], where users collect data on themselves
                        with the goal of improving physical, mental, and emotional performance. Quantified self
                        makes sense from a pedagogical perspective: instead of working on fabricated or foreign
                        datasets (which is the most common approach in data sciences courses), learners work on
                        datasets that they know intimately [11]. They are less likely to get lost in a sea of numbers,
                        or to conduct appropriate data analysis.
                              Third, multimodal data collection can be used by teachers to monitor students’ learn-
                        ing. We also provide the source code of these tools, therefore, they could potentially be
                        integrated in Learning Management Systems (LMS) and Massive Online Open Courses
                        (MOOC). Traditionally, these data sources only capture the learner’s interactions with the
                        learning system as simple log files [21]. This could be augmented with multimodal data,
                        for example indicating students’ attention (from eye-tracking data) or emotional reaction
                        (from facial expression) to various learning materials. There are of course data privacy and
                        ethical issues that would need to be solved before this can be accomplished; however, these
                        questions are outside the scope of this paper.

                        4.3. Case Study: A Course on Multimodal Learning Analytics
                            In the Fall 2020, the EZ-MMLA toolkit was used in a course on Multimodal Learning
                        Analytics at a school of education in the Northeastern part of the USA. 52 students were
                        admitted to the course (54% were female, 46% male). Researchers used the toolkit to collect
                        multimodal data on students as they were learning the course material. Students used the
                        website as part of an adapted version of an in-person course [11] that had transitioned online
                        because of the COVID-19 pandemic. They signed a consent form to allow researchers’ use
Sensors 2022, 22, 568 11 of 18
of their data, and completed various assignments involving eye-tracking, motion tracking,
or emotion detection, using software such as Tableau and Rapidminder to visualize and
analyze data. More than half of the students had little to no experience in programming
and data visualization, and 81% had little to no experience with sensor data. In short,
this population was ideal to test the EZ-MMLA website: participants were knowledgeable
of social sciences methods but didn’t have any (or minimal) knowledge of working with
multimodal sensor data. It provided us with feedback from novices (from a technical
perspective), who at the same time were critical of the potential use of sensing technology
in the social sciences.
The EZ-MMLA website was used in different ways in the context of this course:
(1) students used it through weekly projects, where they collected multimodal data to
build data literacy skills; (2) researchers collected gaze, pose and emotions data while
students were watching weekly instructional videos on topics such as eye-tracking, emotion
detection, pose tracking, machine learning or study design; (3) this data was used for a
larger end-of-semester project, where students analyzed their own data collected during
weekly videos in a “quantified self” manner; (4) finally, students conducted a final project
that was completely open-ended: they had to choose a setting of their choice, formulate
a research question, and answer it using multimodal data from the EZ-MMLA website.
In the sections below, we describe some student feedback, final projects, and preliminary
research findings.
4.3.1. User Feedback
There are several sources of user feedback that were collected during the semester.
One source is the anonymous weekly survey data from students, where three questions
held potentially relevant comments for the toolkit. One question asked students to pick and
describe an aspect of class they particularly enjoyed that week, the second an aspect of class
that they felt needed improvement that week, and the third question prompted students to
report their experiences using the EZ-MMLA toolkit. Additionally, we included a usability
instrument in the survey [22]. Students were also prompted to give their feedback during
class, sometimes orally and sometimes in a chat room. Lastly, we asked students to share
how they might use what they learned in the course after the semester.
A total of 504 open-ended response sets were collected over the course of 12 weeks,
and 82 open-ended comments were identified as being relevant to the EZ-MMLA toolkit.
We conducted thematic analysis (see [23], for an overview) on the combined data to identify
key themes. Taking an inductive approach, preliminary codes were assigned to the data,
which were then iteratively organized into two main themes (positive, negative) and seven
sub-themes (interest in one’s own data, authenticity, accessibility, technical issues, steep
learning curve, data quality, privacy) on how students found the experience (Table 2). The
insights on usability and future usage are presented alongside the seven sub-themes.
Usability. To assess the usability of the website, we used Brooke’s “quick and dirty”
System Usability Scale (SUS [22]) which comprises 10 questions that users rate on a 5 point
scale from “Strongly Disagree” to “Strongly Agree”. Questions for example included “I
found the system unnecessarily complex”, “I think that I would need the support of a
technical person to be able to use this system” or “I would imagine that most people
would learn to use this system very quickly” (half of the questions need to be reverse-
coded). The final score is between 0 and 100, where [24] identified 7 levels (i.e., “worse
imaginable”, “awful”, “poor”, “ok”, “good”, “excellent”, “best imaginable). 29 students
completed the SUS instrument. One response was an outlier (i.e., beyond two standard
deviations), and was removed from the data. The final score of the EZ-MMLA website is
71.94 (SD = 14.84), which can be considered “good”. The lowest scoring questions were “I
think that I would like to use this website frequently” (mean = 3.5), which can reflect not a
usability problem, but how relevant the website could be in their daily lives; and “I found
the website unnecessarily complex” (mean = 3.6, reverse-coded), which suggests that the
website could be simplified from a user’s standpoint.Sensors 2022, 22, 568 12 of 18
Table 2. The main themes identified from 504 response sets that were collected over the course of
12 weeks.
Theme Examples
“I like VERY MUCH using data generated by ourselves”
Interest in one’s own data
“I like learning and analyzing my own learning process”
“a real world scenario”
Authenticity
“I liked that it was grounded in something real-world and relevant to the class”
“Easy to use, time limit had to be monitored. Great resource.”
Accessibility “The fact that we got to actually use the Emotion Detecting tool and analyze it this week far exceeded
my expectations in terms of what is possible to do as a student in our 3rd week of class!”
“The eye tracking data collection website tend to make my laptop run slowly.”
Technical issues
“[The videos on the data collection website] take forever to load and keep buffering.”
“I wished there is a tutorial to the data collection website, there are a lot of functions I knew after I
finished collecting my data.”
Learning curve
“When I was collecting eye-gaze data from gazecloud, it took me several tries to figure out how I can
both read and let gazecloud track my eyes.”
“I wish I was made more cognizant of how [the] quality [of] the data being collected is as I was being
recorded (because I forgot a lot of the time). If there was a camera to show us how the camera is
detecting our position, I might change my behaviors so that I have my webcam screen on/not be
Data quality leaning back out of view”
“Using the gaze recorder on Chrome, I had it in another desktop view and it did not record my gaze
while I was reading my classmate’s slide. So I had to do it over again, and tried to replicate where my
attention was but, clearly, it is already manipulated data.”
“my camera was on and I had no idea if it was recording or not.”
Privacy “I’m not sure what is the data collection website, if that refers to having camera on while watching
the asynchronous video, it felt weird and I feel my privacy is being violated a little.”
Future usage. Students also gave open comments about what future uses the data
analytics tools, including EZ-MMLA, might have for their work and studies. Several
commented that they saw new use for machine learning in education, such as in assessment
or tracking learner engagement, while others mentioned wanting to use EZ-MMLA for
research in UX design, education and marketing. Encouragingly, a number of students
remarked that they felt “intimidated” by machine learning and data analytics coming into
the course, but realized it is more ”feasible and inexpensive” than they thought. Many
explicitly mentioned that their lack of technical background coming into the experience did
not hinder their ability to “build something meaningful in a short time.”
Interest in one’s own data. The most prominent positive theme observed throughout
responses was how collecting and analyzing one’s own data (i.e., data collected on the
student) made the process more interesting and intuitive. One student noted that working
with her own data allowed her to “feel more invested in the final product and assignment”.
Students expressed awe at how they were able to find meaning from their own data, through
visualizations and analysis, with one student noting that the real-time visualization of
her own eye movement “felt almost like telepathy.” Looking at the quantified indices of
their behavior also gave students a chance to “reflect on my own experience”, hinting at
potential self-reflection processes triggered by seeing data on their own studying behavior.
Authenticity. Students seemed to appreciate the fact that the data collected by the
toolkit was, in the words of one student, “massive datasets that are generated by real
MMLA tools.” Students were motivated by the fact that the data was authentic, and were
also able to get their hands dirty in data analytics—one student noted that “the opportunity
to work with data collection directly . . . helps me to understand [the] limitations of data.”
Students were mixed in their perceptions of the ‘messiness’ of the data. One noted “I liked
being able to practice cleaning and analyzing my own data, rather than having pre-cleaned
data handed to me”, while others wished for “cleaner data.” More students, however,You can also read