Autistic differences in the temporal dynamics of social attention
←
→
Page content transcription
If your browser does not render page correctly, please read the page content below
Autistic differences in the temporal
dynamics of social attention
Article

Published Version

Creative Commons: Attribution 4.0 (CC-BY)

Open access

Hedger, N. and Chakrabarti, B. ORCID: https://orcid.org/0000-
0002-6649-7895 (2021) Autistic differences in the temporal
dynamics of social attention. Autism. ISSN 1362-3613 doi:
https://doi.org/10.1177/1362361321998573 Available at
https://centaur.reading.ac.uk/96021/

It is advisable to refer to the publisher’s version if you intend to cite from the
work. See Guidance on citing .

To link to this article DOI: http://dx.doi.org/10.1177/1362361321998573

Publisher: Sage

All outputs in CentAUR are protected by Intellectual Property Rights law,
including copyright law. Copyright and IPR is retained by the creators or other
copyright holders. Terms and conditions for use of this material are defined in
the End User Agreement .

www.reading.ac.uk/centaur

CentAUR
Central Archive at the University of Reading
Reading’s research outputs online
998573
research-article2021
AUT0010.1177/1362361321998573AutismHedger and Chakrabarti
Original Article
Autism
Autistic differences in the temporal 1–12
© The Author(s) 2021
dynamics of social attention Article reuse guidelines:
sagepub.com/journals-permissions
https://doi.org/10.1177/1362361321998573
DOI: 10.1177/1362361321998573
journals.sagepub.com/home/aut
Nicholas Hedger and Bhismadev Chakrabarti
Abstract
Individuals with autism spectrum disorders typically exhibit reduced visual attention towards social stimuli relative to
neurotypical individuals. Importantly, however, attention is not a static process, and it remains unclear how such effects
may manifest over time. Exploring these momentary changes in gaze behaviour can more clearly illustrate how individuals
respond to social stimuli and provide insight into the mechanisms underlying reduced social attention in autism spectrum
disorder. Using a simple passive eye-tracking task with competing presentations of social and nonsocial stimuli, we
examine the different ways in which attention to social stimuli evolves over time in neurotypical adults and adults with
and autism spectrum disorders. Our temporal modelling of gaze behaviour revealed divergent temporal profiles of social
attention in neurotypical and observers with autism. Neurotypical data showed an initial increase in social attention, a
‘decay’ and subsequent ‘recovery’ after prolonged viewing. By contrast, in individuals with autism spectrum disorder,
social attention decayed over time in a linear fashion without recovery after prolonged viewing. We speculate that the
‘gaze cascade’ effect that maintains selection of social stimuli in neurotypical observers is disrupted in individuals with
high autistic traits. Considering these temporal components of gaze behaviour may enhance behavioural phenotypes and
theories of social attention in autism spectrum disorder.
Lay abstract
One behaviour often observed in individuals with autism is that they tend to look less towards social stimuli relative
to neurotypical individuals. For instance, many eye-tracking studies have shown that individuals with autism will look
less towards people and more towards objects in scenes. However, we currently know very little about how these
behaviours change over time. Tracking these moment-to-moment changes in looking behaviour in individuals with
autism can more clearly illustrate how they respond to social stimuli. In this study, adults with and without autism were
presented with displays of social and non-social stimuli, while looking behaviours were measured by eye-tracking. We
found large differences in how the two groups looked towards social stimuli over time. Neurotypical individuals initially
showed a high probability of looking towards social stimuli, then a decline in probability, and a subsequent increase
in probability after prolonged viewing. By contrast, individuals with autism showed an initial increase in probability,
followed by a continuous decline in probability that did not recover. This pattern of results may indicate that individuals
with autism exhibit reduced responsivity to the reward value of social stimuli. Moreover, our data suggest that exploring
the temporal nature of gaze behaviours can lead to more precise explanatory theories of attention in autism.
Keywords
attention, autism, eye-tracking, gaze, social attention, temporal modelling
It has been argued that the core clinical symptoms of Hedger et al., 2020). For instance, when presented with
autism result from differences in how people with autism competing animations of upright and inverted human
attend to the world during infancy and childhood (Dawson
et al., 2004; Toth et al., 2006). The literature is replete with Centre for Autism, School of Psychology & Clinical Language Sciences,
evidence that individuals with autism spectrum disorders University of Reading, UK
(ASD)1 exhibit reduced attention to social stimuli relative
Corresponding author:
to the neurotypical (NT) population. These observations Nicholas Hedger, Centre for Autism, School of Psychology and
have emanated primarily from eye-tracking paradigms, Clinical Language Sciences, University of Reading, Harry Pitt Building,
wherein observers are presented with competing displays Whiteknights Campus, Reading RG6 6AL, UK.
of social and nonsocial stimuli (Chita-Tegmark, 2016; Email: n.hedger@reading.ac.uk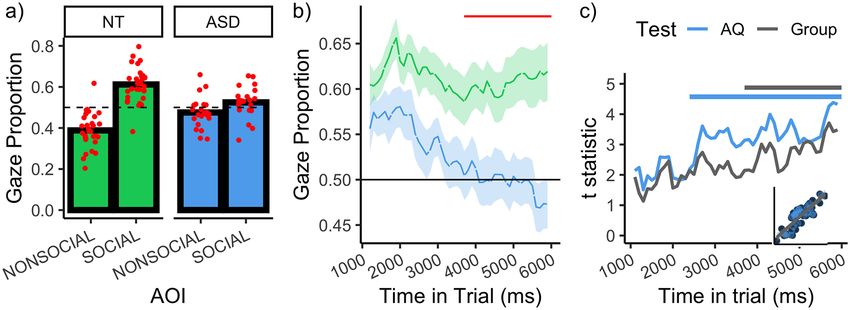
2                                                                                                                   Autism 00(0)

                  Prop Social Gaze
                                     0.8              0.8                            0.8

                                     0.6              0.6                            0.6

                                     0.4              0.4                            0.4

                                     0.2              0.2                            0.2
                                             P1                    P2                             P3
                  Prop Social Gaze

                                     0.8              0.8                            0.8

                                     0.6              0.6                            0.6

                                     0.4              0.4                            0.4

                                     0.2              0.2                            0.2
                                           Time (s)              Time (s)                      Time (s)

Figure 1. Shows gaze proportion data for 3 participants from the present study who viewed competing displays of social and
nonsocial images for 5 s. The upper row shows the average gaze proportion data. Horizontal line demarcates 50% of trial time
spent looking at social image. The lower row shows average time-series data for the same 3 observers. Points indicate gaze
proportion within 100 ms time bins from the start to end of trial. Line indicates local weighted regression fit to the data.

biological motion, NT children gaze for longer at upright          observers have patterns of gaze behaviour that evolve in
animations that resemble human motion, whereas this                dramatically different ways. The first observer exhibits an
preference is not observed in children with ASD, who               initial preference for the nonsocial images, then the social,
instead displayed preferences for nonsocial physical con-          before returning to the nonsocial. The second observer
tingencies (Klin et al., 2009). Similarly, when presented          exhibits an initial bias for social stimuli, but this bias
with competing videos of social interactions and geomet-           decays over time. The final observer displays more com-
ric patterns, NT individuals gaze for longer at the social         plex switching behaviour. These examples demonstrate an
interactions, whereas this tendency is reduced, or reversed        important caveat of working with time-aggregated data:
in individuals with ASD (Pierce et al., 2016). Meta-               the same mean gaze proportions could be the product of a
analyses indicate that this reduced social attention in ASD        large and diverse set of gaze proportion timeseries. As
is a robust effect that generalises across a number of stimu-      such, by failing to consider the temporal domain, impor-
lus conditions and across child and adult samples (Chita-          tant differences in gaze behaviour can remain undetected.
Tegmark, 2016; Frazier et al., 2017). Such eye-tracking                Recent work has demonstrated the advantages of
tasks are simple to administer and do not require advanced         considering these temporal aspects of social attention.
motor responses or language abilities. As such, there is           Tracking the moment-by-moment changes in eye-move-
widespread enthusiasm for the idea that eye-tracking para-         ment behaviour can illustrate more vividly the differences
digms may provide practical, inexpensive and scalable              in how individuals respond to social stimuli. Critically,
tools for screening for ASD risk, particularly in low-             treating the data as a timeseries allows us to determine
resource settings (Falck-Ytter et al., 2013; Sasson &              when differences in social attention tend to arise between
Elison, 2012).                                                     individuals and groups and relate these to social trait char-
    One important thing to consider about such studies is          acteristics of the observer. Specifically, in a NT adult sam-
that social gaze behaviour is typically described by sum-          ple, it has been found that individuals with high empathy
mary metrics such as the average proportion of time that           showed an increased bias for social images, particularly
gaze is directed to social stimuli. Figure 1 (upper row)           after prolonged viewing (Hedger et al., 2018). Another
depicts an example of such gaze proportion data for 3 sep-         study that investigated the temporal aspects of social atten-
arate observers from the present study. When viewing this          tion was conducted by Constantino and colleagues
aggregated form of the data, all 3 observers appear to             (Constantino et al., 2017). The authors observed that when
exhibit similar behaviour, spending an average of ~ 50%            viewing social scenes, monozygotic twins were more
of the trial directing their gaze towards the social images.       likely to exhibit co-occurring saccadic eye movements
However, if we instead represent their data as an average          than dizygotic twins, indicating a genetic influence on the
time series (Figure 1, lower row), this reveals that the three     timing of eye-movement behaviours.
Hedger and Chakrabarti 3
Table 1. Summary of Participant Demographics.
Group N AQ (M,) Age (M, SD) Gender (Male, Female)
NT 30 16.60 (7.70) 33.3 (13.74) 11,19
ASD 23 38.13 (5.85) 37.34 (12.64) 10,13
AQ: Autism Spectrum Quotient; SD: standard deviation; NT: neurotypical; ASD: autism spectrum disorders.
Considering these observations together, there is evi- ASD: 82.6%). The remainder identified themselves as
dence that social trait characteristics such as empathy can belonging to ‘more than one race’ (NT: 6.7%, ASD =
predict different temporal profiles of social attention. 8.7%), or preferred not to disclose racial information
Moreover, there is evidence for a genetic influence on the (ASD: 8.7%). Specific data on socioeconomic status of the
timing of social attention behaviours. ASDs, which are sample were not recorded. Ethical clearance was obtained
marked by both (a) a large genetic component (Abrahams from the University of Reading Ethics committee (approval
& Geschwind, 2008; de la Torre-Ubieta et al., 2016) and (b) code: 2014-059-BC), and all participants gave fully
atypicalities in some empathy-related processes (Jones informed consent.
et al., 2010), are associated with reduced social attention. One plausible concern could be that group differences in
However, currently, we know very little about the temporal social attention may be modulated by reduced cognitive func-
features of gaze behaviour that underlie this reduction. This tioning and not differences in autistic traits per se. However,
link between empathy and autism, taken together with the the currently available data indicate reduced social attention
observations of Hedger et al. (2018), generates the predic- in ASD is orthogonal to IQ. For instance, two large-scale
tion that the reduction in social attention observed in ASD meta analyses indicate that social attention differences are not
may become reliable several seconds after stimulus presen- modulated by verbal or nonverbal IQ matching of the NT and
tation and that this will be driven by an increased tendency ASD groups (Chita-Tegmark, 2016; Hedger et al., 2020) and
for NT individuals to return gaze to social images. remain stable across IQ differences between groups (Frazier
Therefore, the aims of the present study were to (a) estab- et al., 2017). Moreover, numerous studies with developmen-
lish when autistic differences in social attention become tally delayed (DD) control groups show reduced social atten-
robust and (b) relate these group differences to individual tion in ASD relative to both DD and NT subjects (Chawarska
variation in autism-related traits (c) provide an explicit et al., 2012; Klin et al., 2009; Shic et al., 2011). To provide a
model that describes how social attention tends to evolve measure of cognitive ability of the ASD group, all ASD par-
over time in observers with ASD and NT observers. ticipants completed the Wechsler Abbreviated Scale of
Intelligence (WASI), which estimates the participant’s cogni-
tive ability as a percentile of the general population (Wechsler,
Methods
2008). The mean WASI of the ASD group was 115
Participants (SD = 10.53), indicating a high level of functioning and cogni-
tive ability comparable to the university population (Lassiter
Participant characteristics are summarised in Table 1. Our et al., 2001; Wilson et al., 2014). To provide a measure of
NT group was formed of 30 students and academic staff autism-related traits, all participants completed the Autism
recruited from the University of Reading Campus. Our Spectrum Quotient (AQ: Baron-Cohen et al., 2001). A robust
ASD group were recruited through the Centre for Autism difference was detected between the NT and ASD group in
database of research volunteers. Volunteers were not con- AQ scores (t(51) = −11.56, p < 0.001). The ASD group had
sidered for recruitment if they were under 18 years of age, substantially higher AQ (d = 3.23 (2.38, 4.08)) than the NT
or if their database record indicated concurrent diagnosis group. This effect size is consistent with a 99% chance that a
of attention deficit hyperactivity disorder (ADHD), a randomly sampled observer from the ASD group will have a
learning disorder, conduct disorder, Tourette’s syndrome higher AQ score than a randomly sampled observer from the
or epilepsy. With these restrictions applied, the ASD NT Group (Lakens, 2013). The mean AQ scores for the
sample was formed of 23 adults with a Diagnostic and groups were either side of 26, which is considered to be a
Statistical Manual of Mental Disorders (4th ed., text rev; cutoff with good screening properties and discriminative
DSM-IV TR; American Psychiatric Association, 2013) validity (Woodbury-Smith et al., 2005).2
based diagnosis of ASD from a recognised clinic. Note
that this sample of participants is the same as those reported
in (Hedger & Chakrabarti, 2021). All participants had nor- Stimuli
mal/ corrected to normal vision. There were no significant
differences between groups in terms of either age (t(51) = We employed 30 pairs of social and nonsocial reward
−1.09, p = 0.277), or gender (χ2(1) = .25, p = 0.615). The images, which were the same as those used in (Chakrabarti
majority of participants identified as ‘White’ (NT: 93.3%, et al., 2017). Images were recovered from the international4 Autism 00(0)
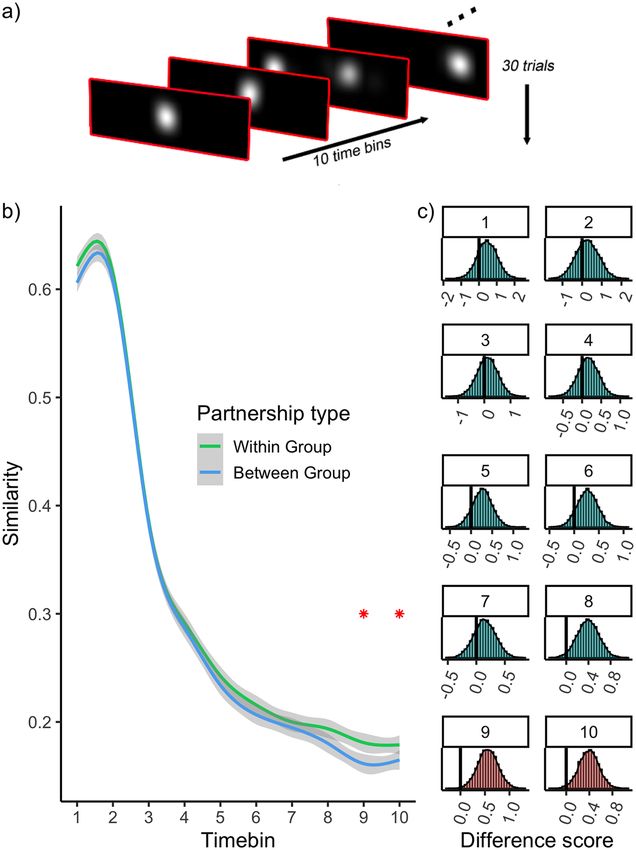
Figure 2. (a) Schematic of experimental setup. Two phase-scrambled images are shown. (b) Schematic of trial sequence.
Affective Picture System (Lang et al., 2008) and publicly Subsequently, participants completed the free-viewing
available creative common licenced databases. Social task: Observers were informed that they would be pre-
images were scenes involving happy groups of people, sented with pairs of images side by side for 5000 ms, and
whereas nonsocial images involved food, natural scenery the only instruction given to the observers was to ‘take a
and money (see Supplementary Material S1 for further good look at the images’. Figure 2(b) depicts the trial
details of selection criteria). Participants were seated 60 sequence: observers were presented with a fixation cross
cm from a 1280 × 1024 pixel resolution monitor and gaze for 1000 ms, followed by a pair of social and non-social
was recorded via a Tobii T60 eyetracker sampling at 60 hz. stimuli that were presented equidistant (4.6 DVA) from the
The resolution of the display was 41.29 pixels/degree of position of the fixation cross for 5000 ms. Observers com-
visual angle (DVA). Stimuli subtended 5.59 × 4.19 DVA. pleted 60 trials in total (30 image pairs, 2 stimulus types).
To minimise the influence of extraneous sensory and Each participant was presented with the same pseudo-ran-
affective differences between image pairs, all pairs were dom trial order, wherein an equal number of social and
matched as closely as possible in terms of low-level prop- nonsocial stimuli were presented either side of fixation.
erties (luminance, contrast, Koch saliency) as well as per-
ceived valence and arousal (see Supplementary Material
S1). In addition, to further characterise the influence of Results
low-level confounds, we presented two stimulus types.
One set of images were intact, and another set of images
Data reduction and analytic approach
were phase scrambled. This manipulation maintains the The raw data supporting this article are publicly available
mean luminance, contrast, spatial frequency and colour via the ‘Figshare’ repository (Hedger, 2020). Using Grafix
profile of the intact images, but renders them unrecognis- Fixations Coder software (Saez de Urabain et al., 2015),
able (Figure 2(a)). The logic of this manipulation is that if we combined raw gaze coordinates from the left and right
simple low-level variability between image pairs drives a eyes into a single set of X and Y coordinates and smoothed
bias towards social images, we would expect to find a this time-series by submitting it to bilateral filtering algo-
social bias of the same magnitude in the intact and scram- rithm (Durand & Dorsey, 2002). Finally, we interpolated
bled condition. All stimuli were presented using MATLAB missing portions of data that were briefer than 150 ms. The
with Psychtoolbox extensions (Brainard, 1997). cutoff of 150 ms was based on previous literature that indi-
cates saccadic programming takes around 130 ms and so
this interpolations of less than 150 ms should prevent inter-
Procedure polating an entire saccade-fixation-saccade sequence
At the start of the experiment, all observers completed a 9 (Wass et al., 2013). We removed trials for which gaze
point calibration and subsequent 9 point validation proce- failed to record for more than 60% of the trial (3.89% of
dure. This procedure was repeated if necessary, until vali- the data). There were no differences between ASD and NT
dation performance indicated < 1DVA spatial accuracy groups in terms of the amount of data removed (t(51) =
and < .20 DVA precision in the validation samples. −.03, p = 0.974). Unless specified otherwise, we fitHedger and Chakrabarti 5
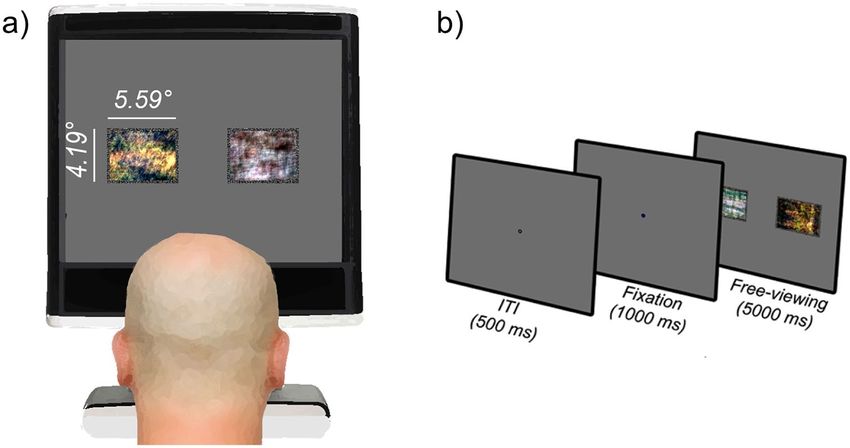
Figure 3. (a) Gaze proportion as a function of group and AOI. Red points indicate individual observer data. (b) Depicts gaze
proportion to the social images over time as a function of group. Horizontal red line indicates the time bins wherein a difference
between the groups was detected, according to a cluster-based analysis. (c) Lines depicts the t statistics for the test that gaze to
the social image is predicted by AQ (blue) and Group (grey), as a function of time (the AQ test statistics were negative, predicting a
bias towards the nonsocial image, but are plotted as absolute values to allow comparison with the Group test statistics). Note that
we do not force AQ into a dichotomous variable – the t statistics reflect the outcome of a linear regression (i.e. the slope divided
by the standard error). The horizontal lines demarcate the time bins wherein the corresponding statistic reaches the (cluster-
corrected) threshold for reaching statistical significance. Inset plot shows the correlation between the t statistics for AQ and
Group. All plots show the data for intact stimuli only.
generalised linear mixed effects models to evaluate Moreover, the predicted interaction between AOI and
hypotheses. Each fixed effect that was evaluated was stimulus type was detected (χ2(1) = 71.12, p < 0.001).
entered into the model with a corresponding by-subject The bias for social images was substantially larger in the
random slope (Barr et al., 2013). Reported p values were intact condition (β = 0.15, p < 0.001) than scrambled
obtained by likelihood ratio tests that compare models condition (β = 0.02, p = 0.162). For the remaining analyses,
with the coefficients to those without them (recommended only the data for intact images were tested (Figure 3(a)).
by Barr et al., 2013). The bias for social images was substantially larger in
the NT group (β = 0.22, p < 0.001) than the ASD group
(β = 0.05, p = 0.034).
Aggregated social bias
Data reduction was performed via the ‘eyetrackingR’ pack-
Temporal aspects of social bias
age, implemented in the R programming language (Dink &
Ferguson, 2015). The display coordinates occupied by the We next reduced each observer’s gaze data into the propor-
social and non-social images on each trial were defined as tion of gaze within the social and non-social AOI in each
areas of interest (AOIs). To evaluate the global tendency to 100 ms time bin from the start to end of the trial. We then
attend to social images, we first analysed the data by aggre- removed data from the first 100 ms time bin, since it con-
gating across the time dimension. To this end, we reduced tained beyond 3 SDs less than the mean number of valid
the raw gaze data for each participant into the proportion of samples captured within all time bins. Figure 3(b), which
trial time that gaze was directed into the social AOI and depicts the proportion of gaze to the social AOI as a func-
non-social AOI (Note that the computation of these propor- tion of time and group, reveals several interesting aspects
tions ignored rare instances where the participants gaze was of gaze behaviour. First, there is a clear vertical offset
directed into neither AOI (.63% of the data)). between the NT and ASD functions, indicating a general-
The data were initially submitted to a general linear ised increase in social attention in the NT group. However,
model with AOI (social, non-social), stimulus type (intact, the difference between the functions is not restricted to a
scrambled) and Group (NT, ASD) as fixed effects. A simple vertical offset. In the NT group (upper line), the
main effect of AOI was detected, indicating a robust bias temporal profile appears to be characterised by three com-
towards social images (χ2(1) = 24.84, p < 0.001). ponents (a) an initial increase social attention, (b) followed
Critically, there was an interaction between AOI and by a decline, and (c) then a partial ‘recovery’ towards the
Group, indicating a larger bias for social images in the NT end of the trial. This profile is consistent with that found
group than the ASD group (χ2(1) = 17.29, p < 0.001). in a previous study of NT observers (Hedger et al., 2018).6 Autism 00(0)
By contrast, this profile is not apparent in the ASD group the time-series functions as a combination of orthogonal
(lower line), which instead resembles a simple linear polynomials (Mirman et al., 2008) (Figure 4(a)). Our
‘decay’ over time. It is also notable that the initial bias that model selection procedure involved fitting all models with
ASD observers have for social images decays to the extent group (NT or ASD) and all combinations of these polyno-
that it reverses at the end of the trial and a bias for non mials (up to an order of 5) as fixed effects, allowing for
social images is detected. 2-way interactions (see Supplementary Material S3 for
Figure 3(c) depicts the differences between the groups more details of the modelling approach). This implied fit-
social gaze proportion over time, expressed as t statistics. ting 40,069 models, whose performances were assessed
This reveals a difference that increases over the course of according to the Bayes Information Criterion (BIC).
the trial. Since conducting a statistical test for each time Subsequently, we used this set of models to generate
bin inflates the type 1 error rate, we protected against model-averaged predictions, wherein the contribution
false-positives by applying a cluster-based permutation of each model’s prediction to this averaging is weighted
analysis (see Supplementary Material S2), which revealed by it’s Akaike weight – entailing that more plausible
that these group differences became robustly detectable in models contributed more to the prediction (Wagenmakers
the final 2300 ms of the trial (3700–6000 ms, p = 0.005, & Farrell, 2004). These model-averaged predictions are
red line in Figure 3(b)). Notably, as illustrated by Figure shown in Figure 4(b) and seem to reproduce the major
3(b), the onset of this cluster corresponds closely with a properties of the data well. The model-averaged para
clear inflection point where the NT function begins to meter estimates can be found in supplementary material
recover, while the ASD function continues to decay. S3 (Table S1).
We additionally framed the performance of our task in To examine the attentional dynamics underlying the
terms of its ability to distinguish between the two groups gaze behaviour of each group, we determined the relative
in a signal detection context (see Supplementary Material importance of each predictor for each group. To this end,
S2). The overall performance of the task (defined as area we first re-fit all models to the NT and ASD data inde-
under the curve (AUC)) was comparable to previous eye- pendently and summed the Akaike weights for each
tracking tasks (AUC = 0.78 (0.65, 0.88), see Pierce et al., model in which each polynomial appeared. Intuitively,
2016) and analysing each time-bin independently revealed the sum of these values reflects the overall ‘support’ for
that maximum performance was obtained late in the trial, the term across the population of models. These data are
between 5600 and 5700 ms (AUC = 0.75, (0.62, 0.86)). plotted in Figure 4(c). Inspection of this Figure reveals
It is also informative (and potentially more powerful) to that the cubic and quartic terms are most important for
consider these variations in social attention over time at the describing the NT data, whereas the most important
trait level. Figure 3(c) depicts the extent to which observ- term in describing the ASD data was the linear term.
er’s AQ predicts gaze towards social images, expressed as Heuristically, the order of the polynomial can be thought
a t statistic. These statistics increase over time and became of as reflecting the number of changes in the probability
statistically robust between 2400 and 6000 ms (p < 0.001). of fixating the social image (Mirman et al., 2008). We
As revealed by Figure 3(c), the increase in these trait-level therefore interpret the relative importance of the linear
statistics over time mirror the increase in the group-level term in the ASD group as indicating that the probability
statistics over time, strengthening the conviction that the of fixating the social image tends to decay over time and
group differences genuinely relate to autistic traits. Notably, does not tend to recover. By contrast, for the NT group,
when conducting equivalent analyses with Age and IQ as the increased support for the nonlinear terms is consistent
predictors, we did not detect any evidence that these varia- with multiple successive stages of social attention. With
bles predicted a bias for social or nonsocial images at any reference to Figure 4(c), the general pattern is consistent
point in time. This remained the case even when taking the with (a) an initial increase in social attention, (b) a
least conservative approach and enhancing the power of decline, (c) a recovery and (d) the beginning of additional
these analyses by conducting no correction for the family- decay towards the very end of the trial, modelled by the
wise error rate (Supplementary Material S2). quartic component.
The above analyses converge on the idea that autistic One possibility is that the more linear decay of social
differences in social attention increase after sustained view- attention observed in the ASD group reflects some gener-
ing and become robust several seconds after stimulus onset, alised ‘sticky attention’ phenomenon that is not specific to
reflecting differences in the sustained maintenance of atten- social attention (Elsabbagh et al., 2013; Landry & Bryson,
tion to social stimuli, as opposed to initial orienting. 2004). For example, it is possible that ASD observers may
simply take longer to disengage attention from initially
fixated images, regardless of their image category.
Model selection
Therefore, we next analysed the data in terms of switching
To provide a parsimonious description of the divergent behaviour. According to a generalised ‘sticky attention’
temporal profiles described above, we attempted to explain account, we would expect ASD individuals to exhibit laterHedger and Chakrabarti 7
a) b) 0.65 c) 1.00
Importance
Linear Quartic 0.75
0.50
Polynomial Quadratic Quintic
0.25
Cubic 0.60 0.00
Gaze Proportion
bic tic ar tic tic
CuQuar Linueadra Quin
Q
0.55 Term
0.2
1.00
Importance
0.50 0.75
0.50
0.0
0.25
0.45 0.00
−0.2 ear rtic bic tic tic
L in Qua Cuuadra Quin
10 20 30 40 50 60 Q
Time TimeBin Term
d) ASD NT
e)
FirstAOI SOCIAL NONSOCIAL
Switch Latency (ms)
2800
Switch Latency (ms)
2800
2600
2600
2400
2200 2400
2000 2200
L L L L
OCIA CIA OCIA CIA 2000
NS SO NS SO
NO NO 10 20 30 40
FirstAOI AQ
Figure 4. (a) Orthogonal polynomial timecodes (up to an order of 5). (b) Shows model-averaged predictions, wherein each models
contribution to the prediction is weighted by it’s Akaike weight. Shaded region shows a prediction interval of +/- 1SE. (c) Upper:
Shows the relative importance of each polynomial in explaining the NT gaze timeseries. Lower: Shows the relative importance of
each polynomial in explaining the ASD timeseries. (d) Shows mean switch time as a function of group and the initially fixated image.
(e) Shows mean switch time as a function of AQ and the image initially fixated.
disengagement from an initially fixated image, regardless Spatio-temporal similarity analysis
of whether it is social or nonsocial. Figure 4(d) depicts
switch latency, as a function of group and the initially fix- Beyond AOI-based analyses, we can refine our analyses
ated image. Critically, we did not detect evidence for a further and directly quantify the extent to which observers
generalised ‘sticky attention’ effect: there was no main gaze towards the same spatial locations of the experimen-
effect of group on mean switch latency (χ2(1) = .006, p = tal display over time. At the start of a trial, all observers
0.810.) Moreover, we detected no interaction between will gaze at central fixation and so there will be little spa-
Group and the initially fixated image on mean switch tial deviation between individuals. As time progresses, we
latency (χ2(1) = .139, p = 0.240). However, when consid- would expect this arrangement will be lost, and for the spa-
ering data at the level of individual traits, with AQ as the tial deviation between individuals to increase. However, if
modelled explanatory variable, an interaction between AQ the observer’s group membership (NT or ASD) meaning-
and initially fixated image on switch latency was detected fully predicts distinct spatio-temporal patterns of gaze
(χ2(1) = 6.93, p = 0.008). Higher AQ was associated with behaviour, we would expect this deviation to be greater
faster switching from the social AOI, but not from the non- between pairs of individuals from different groups than
social AOI (Figure 4(e)). Thus, the data do not support a between pairs of individuals from the same group. To test
generalised slowing of disengagement, and instead indi- this idea, we performed a spatio-temporal similarity analy-
cate faster disengagement specific to social images in indi- ses, akin to that recently employed in a genetic study of
viduals with high autistic traits. social attention (Kennedy et al., 2017).8 Autism 00(0) Figure 5. (a) Schematic of heatmap data for one observer. For each observer, heatmaps were created for each trial and timebin. (b) Similarity between heatmaps is plotted as a function of time and partnership type. Stars indicate the time bins wherein a difference is detected between within and between partnership types. (c) Histograms show the results of permutation tests for each time bin. The bars to the left of the vertical line demarcate the permuted difference scores that are more extreme than the empirically observed difference. Red histograms indicate the tests wherein a difference was detected. We first created a spatial ‘heatmap’ of gaze position in other observer (its ‘partner’) was estimated by calculating each 500 ms time bin by defining coordinates correspond- the Pearson’s correlation between heatmaps. This yielded ing to gaze location and multiplying these with a circularly 397,800 values (30 trials × 10 time bins × 1326 unique symmetric Gaussian function (2 DVA at full width half ‘partnerships’) that estimated the similarity of each pair of maximum). This generated 30 (trials) × 10 (time bins) observer’s gaze behaviour in each trial and time bin. Of heatmaps for each observer (Figure 5(a)). For each heat- these partnerships, there were two ‘partnership types’. (a) map, its similarity to the corresponding heatmap of every Within-group partnerships (i.e. an ASD observer paired
Hedger and Chakrabarti                                                                                                       9

with another ASD observer, or an NT observer paired with            Considering the temporal aspects of social attention
another NT observer) and (b) Between-group partnerships         provides insight beyond that gained from examination of
(i.e. an ASD observer paired with an NT observer).              global differences alone, because we can make informed
    Figure 5(b) depicts the similarity between heatmaps as      inferences about the psychological basis of social atten-
a function of time and partnership type. As expected, the       tional deficits during ‘early’ vs ‘late’ stages. Our data
general trend (independent of partnership type) is higher       showed no differences in social attention in the early part
similarity at the start of the trial and a decline over time.   of the trial, with ASD observers showing increasingly
The data also reveal enhanced similarity for within-group       reduced social attention towards the later portions of the
partners, particularly towards the end of the trial. If these   trial. Relevant to this finding, it is now reasonably well
differences are robust and reflect some meaningful distinc-     established that the initial few fixations after stimulus
tion provided by the grouping of observers, we should           presentation are more stimulus-driven and heavily influ-
expect them to be rarely obtained when random group             enced by image salience (Johnson et al., 2015; Langton
labels are applied to the observers. We tested this possi-      et al., 2008). Alternatively, it has also been proposed that
bility directly with a permutation test (Supplementary          initial orienting to social stimuli may be driven by special-
Material S4), which revealed that the group differences         ised ‘quick and dirty’ subcortical mechanisms that rapidly
became statistically reliable within the final 2 time bins      prioritise conspecific stimuli in perceptual selection
of the trial (5000–5500 ms: p = 0.024, 5500–6000 ms:            (Carlson et al., 2009; Tamietto & de Gelder, 2010). The
p = 0.047) (Figure 5(c)).                                       temporal aspects of our analyses therefore afford us the
                                                                specificity to speak against the notion that early, stimulus-
                                                                driven attentional networks, or rapid conspecific detection
Discussion                                                      pathways are impaired in ASD. This accords with recent
In this study, we found evidence that individuals with ASD      lines of evidence from child and adult ASD samples indi-
tend to exhibit a temporal profile of social attention that     cating that the functioning of such mechanisms are within
differs from NT observers. NT observers exhibited (a) a         the normal range of NTs (Johnson, 2014).
robust bias for social images after prolonged viewing (b)           It is also methodologically important that group differ-
evidence for a ‘recovery’ of social attention after pro-        ences were only staistically robust several seconds after
longed viewing. By contrast, observers with ASD exhib-          stimulus presentation. This finding emphasises the impor-
ited (a) No detectable bias for either image category after     tance of stimulus duration in similar paradigms designed
prolonged viewing, with the gaze preference in the oppo-        to index social attention. For instance, it is possible that
site direction to NT observers – tending towards nonsocial      paradigms with short trial durations may be suboptimal to
images (b) a stronger linear decay of social attention over     capture group differences in social attention. It also indi-
time, with little evidence for ‘recovery’ late in the trial.    cates that metrics that probe the initial selection of stimuli
Accordingly, divergence analysis revealed that the group        in the competition for attentional resources (e.g. latency to
differences in social attention increased over time, yield-     first fixation, proportion on first fixations, dot probe tasks)
ing a robust difference in the final ~2 s of the trial. These   may not be optimally suited for revealing attentional dif-
group differences were large in magnitude, robust and           ferences between these populations. This idea is consistent
were closely related to individual variation in autistic        with a relatively mixed evidence base produced by these
traits. We observed similar group differences using spati-      measures, which paints a complex and inconsistent picture
otemporal similarity analysis, where we found evidence          regarding whether initial orienting to social stimuli is gen-
that individuals within the same group were more likely to      uinely reduced in ASD (Elsabbagh et al., 2013; Fischer
have similar gaze patterns than those from different groups,    et al., 2014; Greene et al., 2011; Moore et al., 2012).
but only after prolonged viewing.                                   What mechanisms could account for the increase in
    Our findings have several important implications. First,    social attention differences over time? A well-established
by considering the time-series components of the gaze           phenomenon from the eye-movement literature is the
data, we were able to capture the atypical viewing behav-       ‘gaze cascade’ effect (Shimojo et al., 2003), which holds
iour observed in ASD in a more granular way. We were            that value-coding and gaze mutually interact, resulting in
able to determine, with precision, when group differences       increased gaze towards preferred stimuli over time. We
in social attention became detectable, make inferences          speculate that ASDs are associated with abnormal coding
about the number and onset of social attention changes          of social reward value, which disrupts a ‘gaze cascade’
over time and formally characterise these in a model-based      type effect that maintains the perceptual selection of
way. Tracking these momentary changes in behaviour              social stimuli over time in NT observers. Indeed, there
illustrates more vividly the underlying attentional trajecto-   is recent evidence to suggest that autistic traits are asso-
ries that define how individuals with ASD deploy attention      ciated with reduced gaze-cascade effects (Hedger &
to social stimuli, placing further constraints on theories of   Chakrabarti, 2021). This notion also fits well with data
diminished social attention in ASD.                             from a recent, novel paradigm that combined eye-tracking
10 Autism 00(0)
with a value-learning paradigm to investigate social atten- temporal profiles to expect in younger children with the
tion in preschoolers (Wang et al., 2018). NT eye-move- condition. For this reason, we are enthusiastic about the
ment behaviour was found to be consistent with increased prospect of applying this time-series approach to proximal
value learning for social relative to nonsocial stimuli, stages of development, at ages during which symptomatol-
whereas this pattern of behaviour was not observed in ogy profiles are still emerging.
individuals with ASD. Thus, there is some support for the These interpretative cautions aside, our analyses dem-
idea that reduced sensitivity to socially rewarding cues onstrate that considering the temporal structure of gaze
may underly the steeper decline in social attention and signals can provide more refined quantitative endopheno-
subsequent bias towards nonsocial images. types for conditions marked by atypical social attention.
Regarding the novelty of our study, it is important to Beyond the context of our observations, there are numer-
acknowledge that other studies have previously character- ous examples from fields as diverse as ecology and cardiac
ised temporal components of social attention in ASD. medicine that demonstrate that important phenotypic dif-
However, typically, this has been achieved via a less granular ferences are often more subtle and complex than simple
distinction between ‘early’ metrics such as latency to first mean shifts. Different cardiac health problems (Costa
fixation and ‘late’ metrics such as total gaze duration (Benson et al., 2005) and different species of worms (Brown et al.,
et al., 2009; van der Geest et al., 2002), or has involved a 2013), or fruitflies (Fulcher & Jones, 2017) can be classi-
only a divergence analysis (Nakano et al., 2010; Sasson fied by metrics such as multi-scale entropy, spectral flat-
et al., 2007) to determine when group differences become ness and temporal predictability/stationarity that describe
detectable. Neither of these cases involve an explicit, model- how behaviour evolves over time. These insights, in com-
based description of gaze as it evolves over time. We are bination with our own data, emphasise the importance of
aware of only one other, very recent study that employed exploiting the time-varying nature of the signals under
similar model-based analyses of gaze behaviour in ASD (Del study as fully as possible, and inform future study design
Bianco et al., 2020). In this study, it was observed that all for paradigms measuring social attention.
observers showed an initial high probability of attending to
faces in scenes, followed by a decline. Critically, NT partici- Authors’ note
pants were more likely to subsequently return gaze to faces Bhismadev Chakrabarti is also affiliated to Department of
than ASD participants – an effect that increased with age. Psychology, Ashoka University, Sonepat, India.
Thus, our findings are in good agreement, and this conver-
gent evidence strengthens our conviction that the divergent Declaration of conflicting interests
temporal profiles of social attention observed here are robust. The author(s) declared no potential conflicts of interest with respect
Importantly, we demonstrate that such an effect translates to to the research, authorship, and/or publication of this article.
conditions with an explicitly competing rewarding nonsocial
stimulus matched for low-level properties. Funding
In interpreting our findings, several limitations need to The author(s) disclosed receipt of the following financial support
be borne in mind. First, due to our desire for experimental for the research, authorship, and/or publication of this article: NH
control, our study involved competing presentations of is supported by a Leverhulme Early Career Fellowship (ECF
carefully matched static images. This presents something -2019-305). BC is supported by a Philip Leverhulme Prize and
of a contrast from natural viewing conditions, wherein the Medical Research Council UK.
competitions between social and nonsocial images do not
tend to present themselves in such circumscribed ways – Ethical approval
and tend to be more dynamic, diverse and unpredictable. The study reported in this paper was approved by the University
As such, a plausible concern might be that group differ- of Reading local ethics committee (Approval code: 2014-059-
ences may be reduced due to a lack of ecological validity. BC) and was performed in accordance with the ethical standards
However, it is notable that the sensitivity of our eye-track- as laid down in the 1964 Declaration of Helsinki and its later
ing task (defined by AUC) exceeded that previously amendments. This study does not contain any studies with ani-
reported for video based paradigms such as the Geopref mals performed by any authors.
test (Pierce et al., 2011, 2016). Sensitivity aside, we must
acknowledge that the behaviours we report from this para- Informed consent
digm are only a first approximation of how the relevant Informed consent was obtained from all individual participants
behaviours play out in the real world. included in the study.
It is also important to note that the behaviours reported
here from a cognitively able (but socially impaired) adult ORCID iD
sample. Given the fact that a substantial proportion of indi-
Nicholas Hedger https://orcid.org/0000-0002-2733-1913
viduals with ASD have some form of associated intellectual
disability (Fombonne, 1999), we must therefore sensitive to
the fact that we do not know whether these results will Supplemental material
extend to participants with lower IQ, nor do we know what Supplemental material for this article is available online.Hedger and Chakrabarti 11
Notes Statistical, Nonlinear, and Soft Matter Physics, 71(2 Pt. 1),
Article 021906.
1. We use the term ‘Individuals with Autism Spectrum
Dawson, G., Toth, K., Abbott, R., Osterling, J., Munson, J., Estes,
Disorders’ for consistency, but we are aware that differ-
A., & Liaw, J. (2004). Early social attention impairments
ent sections of the autism community have preferences for
in autism: Social orienting, joint attention, and attention to
either of these terms, and it is important to acknowledge
distress. Developmental Psychology, 40(2), 271–283.
these perspectives.
de la Torre-Ubieta, L., Won, H., Stein, J. L., & Geschwind, D.
2. 2 NT observers had AQ scores that exceeded 26, and 1
H. (2016). Advancing the understanding of autism disease
ASD observer had a score of less than 26. The pattern of
mechanisms through genetics. Nature Medicine, 22(4),
results was practically identical when these observers were
345–361. https://doi.org/10.1038/nm.4071
excluded from the analysis.
Del Bianco, T., Mason, L., Charman, T., Tillman, J., Loth, E.,
Hayward, H., Shic, F., Buitelaar, J., Johnson, M. H., Jones,
References E. J. H., Ahmad, J., Ambrosino, S., Banaschewski, T.,
Abrahams, B. S., & Geschwind, D. H. (2008). Advances in Baron-Cohen, S., Baumeister, S., Beckmann, C. F., Bölte,
autism genetics: On the threshold of a new neurobiology. S., Bourgeron, T., Bours, C., . . . Zwiers, M. P. (2020).
Nature Reviews Genetics, 9(5), 341–355. Temporal profiles of social attention are different across
American Psychiatric Association. (2013). Diagnostic and statis- development in autistic and neurotypical people. Biological
tical manual of mental disorders (DSM-5®). Psychiatry: Cognitive Neuroscience and Neuroimaging.
Baron-Cohen, S., Wheelwright, S., Skinner, R., Martin, J., & Advance online publication. https://doi.org/10.1016/j.
Clubley, E. (2001). The Autism-Spectrum Quotient (AQ): bpsc.2020.09.004
Evidence from Asperger syndrome/high-functioning autism, Dink, J. W., & Ferguson, B. (2015). eyetrackingR: An R library
malesand females, scientists and mathematicians. Journal of for eye-tracking data analysis. http://www.eyetrackingr.com
Autism and Developmental Disorders, 31(1), 5–17. Durand, F., & Dorsey, J. (2002). Fast bilateral filtering for the
Barr, D. J., Levy, R., Scheepers, C., & Tily, H. J. (2013). Random display of high-dynamic-range Images. In Proceedings of
effects structure for confirmatory hypothesis testing: Keep the 29th Annual Conference on Computer Graphics and
it maximal. Journal of Memory and Language, 68(3), 255– Interactive Techniques (pp. 257–266). ACM.
278. https://doi.org/10.1016/j.jml.2012.11.001 Elsabbagh, M., Fernandes, J., Webb, S. J., Dawson, G., Charman,
Benson, V., Piper, J., & Fletcher-Watson, S. (2009). T., & Johnson, M. H., & British Autism Study of Infant
Atypical saccadic scanning in autistic spectrum disor- Siblings Team. (2013). Disengagement of visual attention in
der. Neuropsychologia, 47(4), 1178–1182. https://doi. infancy is associated with emerging autism in toddlerhood.
org/10.1016/j.neuropsychologia.2008.11.019 Biological Psychiatry, 74(3), 189–194.
Brainard, D. H. (1997). The Psychophysics Toolbox. Spatial Falck-Ytter, T., Bölte, S., & Gredebäck, G. (2013). Eye tracking
Vision, 10(4), 433–436. in early autism research. Journal of Neurodevelopmental
Brown, A. E. X., Yemini, E. I., Grundy, L. J., Jucikas, T., & Disorders, 5(1), Article 28.
Schafer, W. R. (2013). A dictionary of behavioral motifs Fischer, J., Koldewyn, K., Jiang, Y. V., & Kanwisher, N. (2014).
reveals clusters of genes affecting Caenorhabditis elegans Unimpaired attentional disengagement and social orienting
locomotion. Proceedings of the National Academy of in children with autism. Clinical Psychological Science,
Sciences of the United States of America, 110(2), 791–796. 2(2), 214–223.
Carlson, J. M., Reinke, K. S., & Habib, R. (2009). A left amyg- Fombonne, E. (1999). The epidemiology of autism: A review.
dala mediated network for rapid orienting to masked fear- Psychological Medicine, 29(4), 769–786. https://doi.org
ful faces. Neuropsychologia, 47(5), 1386–1389. https://doi. /10.1017/s0033291799008508
org/10.1016/j.neuropsychologia.2009.01.026 Frazier, T. W., Strauss, M., Klingemier, E. W., Zetzer, E. E.,
Chakrabarti, B., Haffey, A., Canzano, L., Taylor, C. P., & Hardan, A. Y., Eng, C., & Youngstrom, E. A. (2017). A
McSorley, E. (2017). Individual differences in respon- meta-analysis of gaze differences to social and nonsocial
sivity to social rewards: Insights from two eye-tracking information between individuals with and without autism.
tasks. PLOS ONE, 12(10), Article e0185146. https://doi. Journal of the American Academy of Child and Adolescent
org/10.1371/journal.pone.0185146 Psychiatry, 56(7), 546–555.
Chawarska, K., Macari, S., & Shic, F. (2012). Context modulates Fulcher, B. D., & Jones, N. S. (2017). hctsa: A computational
attention to social scenes in toddlers with autism. Journal of framework for automated time-series phenotyping using
Child Psychology and Psychiatry, and Allied Disciplines, massive feature extraction. Cell Systems, 5(5), 527–531e3.
53(8), 903–913. Greene, D. J., Colich, N., Iacoboni, M., Zaidel, E., Bookheimer,
Chita-Tegmark, M. (2016). Social attention in ASD: A review S. Y., & Dapretto, M. (2011). Atypical neural networks for
and meta-analysis of eye-tracking studies. Research in social orienting in autism spectrum disorders. NeuroImage,
Developmental Disabilities, 48, 79–93. 56(1), 354–362.
Constantino, J. N., Kennon-McGill, S., Weichselbaum, C., Hedger, N. (2020). EYETRACK_2019. https://doi.org/10.6084/
Marrus, N., Haider, A., Glowinski, A. L., . . .Jones, W. m9.figshare.9668348.v1
(2017). Infant viewing of social scenes is under genetic con- Hedger, N., & Chakrabarti, B. (2021). To covet what we see:
trol and is atypical in autism. Nature, 547(7663), 340–344. Autistic traits modulate the relationship between looking
Costa, M., Goldberger, A. L., & Peng, C.-K. (2005). Multiscale and choosing. Autism Research, 14, 289–300. https://doi.
entropy analysis of biological signals. Physical Review E: org/10.1002/aur.234912 Autism 00(0)
Hedger, N., Dubey, I., & Chakrabarti, B. (2020). Social orient- a risk factor for autism. Archives of General Psychiatry,
ing and social seeking behaviors in ASD. A meta analytic 68(1), 101–109.
investigation. Neuroscience & Biobehavioral Reviews, 119, Pierce, K., Marinero, S., Hazin, R., McKenna, B., Barnes, C. C.,
376–395. https://doi.org/10.1016/j.neubiorev.2020.10.003 & Malige, A. (2016). Eye tracking reveals abnormal visual
Hedger, N., Haffey, A., McSorley, E., & Chakrabarti, B. (2018). preference for geometric images as an early biomarker of an
Empathy modulates the temporal structure of social atten- autism spectrum disorder subtype associated with increased
tion. Proceedings of the Royal Society B. https://royalsociety symptom severity. Biological Psychiatry, 79(8), 657–666.
publishing.org/doi/abs/10.1098/rspb.2018.1716 Saez de Urabain, I. R., Johnson, M. H., & Smith, T. J. (2015).
Johnson, M. H. (2014). Autism: Demise of the Innate Social GraFIX: A semiautomatic approach for parsing low- and
Orienting Hypothesis. Current Biology, 24(1), R30–R31. high-quality eye-tracking data. Behavior Research Methods,
https://doi.org/10.1016/j.cub.2013.11.021 47(1), 53–72.
Johnson, M. H., Senju, A., & Tomalski, P. (2015). The two- Sasson, N., Tsuchiya, N., Hurley, R., Couture, S. M., Penn, D.
process theory of face processing: Modifications based on L., Adolphs, R., & Piven, J. (2007). Orienting to social
two decades of data from infants and adults. Neuroscience stimuli differentiates social cognitive impairment in autism
& Biobehavioral Reviews, 50, 169–179. https://doi.org and schizophrenia. Neuropsychologia, 45(11), 2580–2588.
/10.1016/j.neubiorev.2014.10.009 https://doi.org/10.1016/j.neuropsychologia.2007.03.009
Jones, A. P., Happé, F. G. E., Gilbert, F., Burnett, S., & Viding, Sasson, N. J., & Elison, J. T. (2012). Eye tracking young children
E. (2010). Feeling, caring, knowing: Different types of with autism. Journal of Visualized Experiments: JoVE, 61,
empathy deficit in boys with psychopathic tendencies and Article 3675. https://doi.org/10.3791/3675
autism spectrum disorder. Journal of Child Psychology and Shic, F., Bradshaw, J., Klin, A., Scassellati, B., & Chawarska, K.
Psychiatry, and Allied Disciplines, 51(11), 1188–1197. (2011). Limited activity monitoring in toddlers with autism
Kennedy, D. P., D’Onofrio, B. M., Quinn, P. D., Bölte, S., spectrum disorder. Brain Research, 1380, 246–254.
Lichtenstein, P., & Falck-Ytter, T. (2017). Genetic influence Shimojo, S., Simion, C., Shimojo, E., & Scheier, C. (2003).
on eye movements to complex scenes at short timescales. Gaze bias both reflects and influences preference. Nature
Current Biology, 27(22), 3554–3560.e3. Neuroscience, 6, Article 1317.
Klin, A., Lin, D. J., Gorrindo, P., Ramsay, G., & Jones, W. (2009). Tamietto, M., & de Gelder, B. (2010). Neural bases of the non-
Two-year-olds with autism orient to non-social contingencies conscious perception of emotional signals. Nature Reviews
rather than biological motion. Nature, 459(7244), 257–261. Neuroscience, 11(10), 697–709. https://doi.org/10.1038/
Lakens, D. (2013). Calculating and reporting effect sizes to facil- nrn2889
itate cumulative science: A practical primer for t-tests and Toth, K., Munson, J., Meltzoff, A. N., & Dawson, G. (2006).
ANOVAs. Frontiers in Psychology, 4, Article 863. Early predictors of communication development in young
Landry, R., & Bryson, S. E. (2004). Impaired disengagement of children with autism spectrum disorder: Joint attention, imi-
attention in young children with autism. Journal of Child tation, and toy play. Journal of Autism and Developmental
Psychology and Psychiatry, and Allied Disciplines, 45(6), Disorders, 36(8), 993–1005.
1115–1122. van der Geest, J. N., Kemner, C., Camfferman, G., Verbaten,
Lang, P. J., Bradley, M. M., & Cuthbert, B. N. (2008). M. N., & van Engeland, H. (2002). Looking at images with
International Affective Picture System 2 (IAPS): Affective human figures: Comparison between autistic and normal
ratings of pictures and instruction manual (Technical children. Journal of Autism and Developmental Disorders,
Report A-8). University of Florida. 32(2), 69–75. https://doi.org/10.1023/A:1014832420206
Langton, S. R. H., Law, A. S., Burton, A. M., & Schweinberger, Wagenmakers, E.-J., & Farrell, S. (2004). AIC model selection
S. R. (2008). Attention capture by faces. Cognition, 107(1), using Akaike weights. Psychonomic Bulletin & Review,
330–342. https://doi.org/10.1016/j.cognition.2007.07.012 11(1), 192–196.
Lassiter, K. S., Bell, N. L., Hutchinson, M. B., & Matthews, T. Wang, Q., DiNicola, L., Heymann, P., Hampson, M., &
D. (2001). College student performance on the general abil- Chawarska, K. (2018). Impaired value learning for faces
ity measure for adults and the Wechsler Intelligence Scale for in preschoolers with autism spectrum disorder. Journal of
Adults–Third Edition. Psychology in the Schools, 38(1), 1–10. the American Academy of Child and Adolescent Psychiatry,
Mirman, D., Dixon, J. A., & Magnuson, J. S. (2008). Statistical 57(1), 33–40.
and computational models of the visual world paradigm: Wass, S. V., Smith, T. J., & Johnson, M. H. (2013). Parsing eye-
Growth curves and individual differences. Journal of tracking data of variable quality to provide accurate fixation
Memory and Language, 59(4), 475–494. duration estimates in infants and adults. Behavior Research
Moore, D. J., Heavey, L., & Reidy, J. (2012). Attentional pro- Methods, 45(1), 229–250.
cessing of faces in ASD: A Dot- Probe study. Journal of Wechsler, D. (2008). Wechsler Adult Intelligence Scale – Fourth
Autism and Developmental Disorders, 42(10), 2038–2045. Edition (WAIS–IV). NCS Pearson.
Nakano, T., Tanaka, K., Endo, Y., Yamane, Y., Yamamoto, T., Wilson, C. E., Happé, F., Wheelwright, S. J., Ecker, C., Lombardo,
Nakano, Y., Ohta, H., Kato, N., & Kitazawa, S. (2010). M. V., Johnston, P., . . .Murphy, D. G. M. (2014). The neu-
Atypical gaze patterns in children and adults with autism ropsychology of male adults with high-functioning autism
spectrum disorders dissociated from developmental changes or Asperger syndrome. Autism Research, 7(5), 568–581.
in gaze behaviour. Proceedings of the Royal Society B: Woodbury-Smith, M. R., Robinson, J., Wheelwright, S., &
Biological Sciences, 277(1696), 2935–2943. https://doi.org Baron-Cohen, S. (2005). Screening adults for Asperger
/10.1098/rspb.2010.0587 Syndrome using the AQ: A preliminary study of its diag-
Pierce, K., Conant, D., Hazin, R., Stoner, R., & Desmond, J. nostic validity in clinical practice. Journal of Autism and
(2011). Preference for geometric patterns early in life as Developmental Disorders, 35(3), 331–335.You can also read