Automated flow control of a multi-lane swimming chamber for small fishes indicates species-specific sensitivity to experimental protocols
←
→
Page content transcription
If your browser does not render page correctly, please read the page content below

Volume 9 • 2021                  10.1093/conphys/coaa131

                                                                                                                                     Toolbox

Automated flow control of a multi-lane swimming
chamber for small fishes indicates species-specific

                                                                                                                                                             Downloaded from https://academic.oup.com/conphys/article/9/1/coaa131/6067276 by guest on 17 September 2021
sensitivity to experimental protocols
Björn Illing1, *, Andrea Severati2 , Justin Hochen2 , Paul Boyd2 , Paulin Raison3 , Rachel Mather4 ,
Adam T. Downie1 , Jodie L. Rummer1 , Frederieke J. Kroon5,6 and Craig Humphrey2

1 ARC Centre of Excellence for Coral Reef Studies, James Cook University, 1 James Cook Drive, Townsville, Queensland 4811, Australia
2 National Sea Simulator, Australian Institute of Marine Science, PMB 3, Townsville, Queensland 4810, Australia
3 École Polytechnique Fédérale de Lausanne, School of Engineering, Route Cantonale, 1015 Lausanne, Switzerland
4 College of Science and Engineering, James Cook University, 1 James Cook Drive, Townsville, Queensland 4811, Australia
5   Australian Institute of Marine Science, PMB 3, Townsville, Queensland 4810, Australia
6 Division of Research and Innovation, James Cook University, 1 James Cook Drive, Townsville, Queensland 4811, Australia

*Corresponding author: ARC Centre of Excellence for Coral Reef Studies, James Cook University, 1 James Cook Drive, Townsville, Queensland
4811, Australia Email: illing.bjoern@gmail.com

..........................................................................................................................................................

In fishes, swimming performance is considered an important metric to measure fitness, dispersal and migratory abilities.
The swimming performance of individual larval fishes is often integrated into models to make inferences on how environ-
mental parameters affect population-level dynamics (e.g. connectivity). However, little information exists regarding how
experimental protocols affect the swimming performance of marine fish larvae. In addition, the technical setups used to
measure larval fish swimming performance often lack automation and accurate control of water quality parameters and
flow velocity. In this study, we automated the control of multi-lane swimming chambers for small fishes by developing an
open-source algorithm. This automation allowed us to execute repeatable flow scenarios and reduce operator interference
and inaccuracies in flow velocity typically associated with manual control. Furthermore, we made structural modifications to
a prior design to reduce the areas of lower flow velocity. We then validated the flow dynamics of the new chambers using
computational fluid dynamics and particle-tracking software. The algorithm provided an accurate alignment between the set
and measured flow velocities and we used it to test whether faster critical swimming speed (Ucrit ) protocols (i.e. shorter time
intervals and higher velocity increments) would increase Ucrit of early life stages of two tropical fish species [4–10-mm standard
length (SL)]. The Ucrit of barramundi (Lates calcarifer) and cinnamon anemonefish (Amphiprion melanopus) increased linearly
with fish length, but in cinnamon anemonefish, Ucrit started to decrease upon metamorphosis. Swimming protocols using
longer time intervals (more than 2.5 times increase) negatively affected Ucrit in cinnamon anemonefish but not in barramundi.
These species-specific differences in swimming performance highlight the importance of testing suitable Ucrit protocols prior
to experimentation. The automated control of flow velocity will create more accurate and repeatable data on swimming
performance of larval fishes. Integrating refined measurements into individual-based models will support future research on
the effects of environmental change.

Key words: Automation, CFD, fish larvae, particle tracking, swimming methodology
Editor: Steven Cooke
Received 11 September 2020; Revised 23 November 2020; Editorial Decision 3 December 2020; Accepted 7 December 2020
Cite as: Illing B, Severati A, Hochen J, Boyd P, Raison P, Mather R, Downie AT, Rummer JL, Kroon FJ, Humphrey C (2021) Automated flow control
of a multi-lane swimming chamber for small fishes indicates species-specific sensitivity to experimental protocols. Conserv Physiol 9(1): coaa131;
doi:10.1093/conphys/coaa131.

..........................................................................................................................................................

..........................................................................................................................................................
© The Author(s) 2021. Published by Oxford University Press and the Society for Experimental Biology.
This is an Open Access article distributed under the terms of the Creative Commons Attribution License (http://creativecommons.org/licenses/            1
by/4.0/), which permits unrestricted reuse, distribution, and reproduction in any medium, provided the original work is properly cited.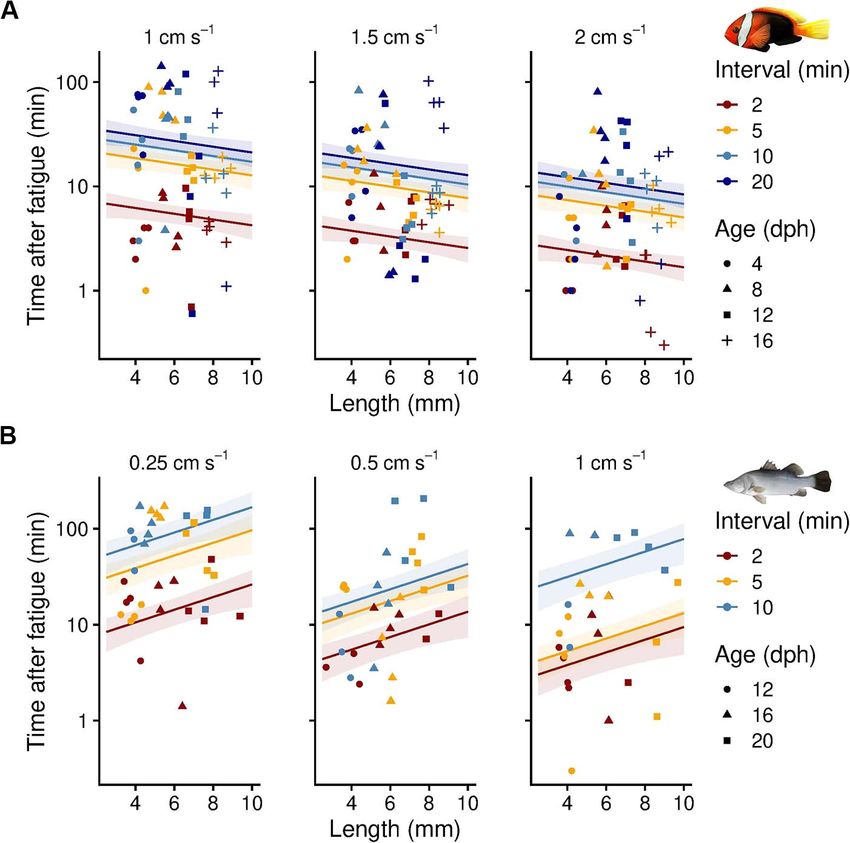
Toolbox                                                                                                    Conservation Physiology • Volume 9 2021
..........................................................................................................................................................

Introduction                                                                   of using different critical swimming performance protocols in
                                                                               marine fish larvae yet.
Knowledge on how aquatic animals perform under changing                           A popular experimental design used to test the swimming
or altered environmental conditions is important not only                      performance of larval fishes, a multi-lane swimming chamber,
for understanding the mechanistic basis for cause-and-                         was originally described by Stobutzki and Bellwood (1997).
effect responses but also for developing sustainable and                       Several studies have since used this design to investigate either
ecosystem-based management strategies (Ward et al., 2016;                      species- and/or taxon-specific differences (Fisher et al., 2005)
Álvarez-Romero et al., 2018). For example, conservation                        or to describe the ontogenetic development of swimming per-
and fisheries management benefit from growth, survival                         formance in fishes (Clark et al., 2005; Leis et al., 2007; Faria
and dispersal models for early life stages of fishes to better                 et al., 2009; Kashef et al., 2014; Kopf et al., 2014; Silva et al.,
predict and understand trends in fish population dynamics.                     2014). Moreover, the multi-lane swimming chamber design

                                                                                                                                                             Downloaded from https://academic.oup.com/conphys/article/9/1/coaa131/6067276 by guest on 17 September 2021
These individual-based models can provide a valuable insight                   has been used to investigate the effects of environmental
into how environmental factors scale from individual-level                     stress, such as the effects of match–mismatch scenarios with
changes in performance to population-level trends, such                        prey on swimming performance (Leis and Clark, 2005; Faria
as changes in the number of young fish being added to a                        et al., 2011a,b). In other studies, researchers have investigated
population (i.e. recruitment) or overall offspring dispersal (i.e.             the effects of elevated temperature (Moyano et al., 2016),
population connectivity) (Hufnagl and Peck, 2011; Kendall                      increased partial pressure of carbon dioxide (pCO2 ) (Munday
et al., 2016; Ward et al., 2016; Faillettaz et al., 2018; Bode                 et al., 2009; Bignami et al., 2013, 2014; Silva et al., 2016)
et al., 2019). However, many individual-based biophysical                      or both in combination (Watson et al., 2018; Cominassi
models lack sufficient biological data, such as information                    et al., 2019). The original multi-lane swimming chamber
on swimming performance (Peck and Hufnagl, 2012). Thus,                        was designed for high throughput of experimental animals
there exists a strong need for accurate, empirical data and                    and was a quick and cost-efficient assembly. Yet, the fluid
highly controllable and reproducible experimental designs to                   dynamics of the setup were never examined or validated and
investigate the swimming performance of early life stages of                   the manual control of the system required constant operator
fishes.                                                                        presence.
   Several methods have been developed to test the swim-                          With advanced technological innovations, several design
ming performance of fishes, each tailored to answer specific                   and control optimizations have become available for
physiological, behavioural and/or ecological questions. For                    swimming chambers. Applications, such as computer-
example, measuring burst swimming and escape responses                         aided design (CAD) and computational fluid dynamics
can aid in understanding predator–prey relationships (e.g.                     (CFD) software, can help to develop and test swimming
Allan et al., 2017), whereas undisturbed in situ or tank                       chambers and their flow dynamics virtually (Vezza et al.,
observations provide information regarding routine swim-                       2020). Similarly, computer-controlled cutting or 3D printing
ming speeds, such as those at which fishes migrate and/or                      machines assist with creating pieces for swimming flumes,
search for prey (e.g. Leis et al., 1996; Fisher and Bellwood,                  often on very small scales (Huang et al., 2020). At the same
2003). Swimming chambers, where flow velocities can be                         time, microcontrollers can control flow settings in swimming
manipulated, have been used to swim fishes to exhaustion,                      flumes more accurately, as they reduce delays in flow
either at set speeds (endurance swimming; Majoris et al.,                      changes associated with manually operated valves (Widrick
2019) or by a step-wise increase in flow velocity (critical                    et al., 2018). These advances can improve the accuracy
swimming speed, Ucrit ) (Brett, 1964; see review by Ellerby                    and repeatability of measurements, which is particularly
and Herskin, 2013). Swimming methodologies can also differ                     relevant when assessing multiple, combined environmental
based on the equipment or experimental protocol used, and                      stressors on fish swimming performance. Furthermore, these
some studies have systematically investigated the effects of                   optimizations could assist in tackling current reproducibility
step heights (velocity increments) and step lengths (time inter-               issues in ecology and evolution studies (Fraser et al., 2018).
vals) on critical swimming speeds in temperate fishes. In two
studies on juvenile largemouth bass (Micropterus salmoides)                       In this study, we aimed to automate multi-lane swimming
and juvenile shortnose sturgeon (Acipenser brevirostrum),                      chambers to improve the accuracy and repeatability of swim-
the authors found that slower protocols (i.e. lower velocity                   ming performance measurements of small fishes. We therefore
increments and longer time intervals) reduced the estimates                    developed an algorithm to automate the flow control and to
of Ucrit (Farlinger and Beamish, 1977; Downie and Kieffer,                     execute repeatable, complex flow patterns without delays in
2017). This information has supported the use of swimming                      flow velocity. Furthermore, we made structural modifications
performance as a proxy for whole-organism performance and                      to the original multi-lane swimming chamber (Stobutzki and
condition in fishes, including their early life stages, and has                Bellwood, 1997) and validated the flow dynamics using CFD
led to management recommendations (e.g. for fishway use in                     and particle-tracking software. We then used the multi-lane
rivers; Braaten et al., 2015; Downie et al., 2020). Surprisingly,              swimming chambers and automated control to systematically
and to our best knowledge, no studies have tested the effects                  investigate the effects of different test protocols on critical

..........................................................................................................................................................
2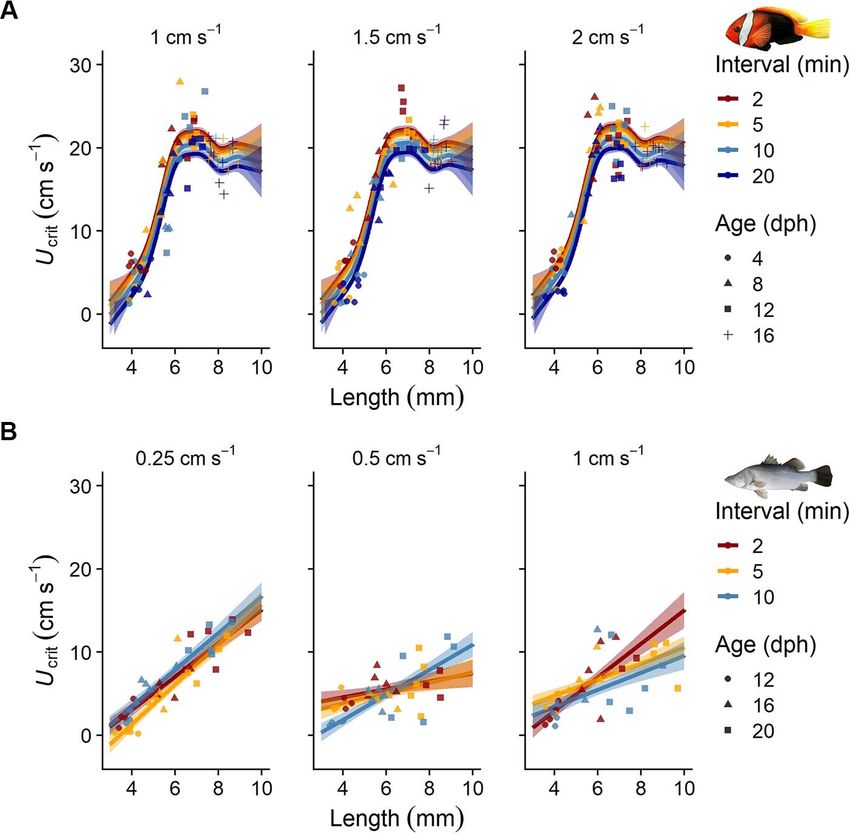
Conservation Physiology • Volume 9 2021                                                                                                          Toolbox
..........................................................................................................................................................

swimming speeds of two tropical fish species. More specifi-                    Automated flow control
cally, we hypothesized that faster protocols would increase the
estimates of critical swimming speeds during early ontogeny                    The flow control was managed through a programmable
in cinnamon anemonefish (Amphiprion melanopus) and bar-                        logic controller (PLC, Siemens SIMATIC S7-1500) using
ramundi (Lates calcarifer).                                                    an algorithm developed in-house (for TIA Portal, Siemens,
                                                                               Munich, Germany; see Supplementary Material S2) to allow
                                                                               for fully automated, accurate and repeatable adjustments of
Materials and methods                                                          water velocity (Fig. 1B). The software algorithm integrates
                                                                               the feedback from the flowmeters and the valve opening
Swimming chamber design                                                        to align the set value (SV) and the measured value (process
                                                                               value) for the flow velocity required. Any complex and/or
The design of the multi-lane swimming chamber was drafted                      iterative flow pattern can be programmed and executed

                                                                                                                                                             Downloaded from https://academic.oup.com/conphys/article/9/1/coaa131/6067276 by guest on 17 September 2021
using CAD software (AutoCAD Inventor® , Autodesk Inc,                          reliably without further operator intervention and disruption
San Rafael, CA, USA), and the individual components were                       to the behavioural and performance responses of the fish.
machined from polymethylmethacrylate panels using a com-                       Importantly, the swimming routine is remotely initiated and
puterized numerical control cutting machine (Mazak Integrex                    does not require the operator to be present in the experimental
J-200, Yamazaki Mazak, Oguchi, Japan). The design was                          room. After several calibration trials, the software algorithm
based on previously built, multi-lane swimming chambers                        can accurately adjust the proportional valves to match the
(e.g. Stobutzki and Bellwood, 1997; Faria et al., 2009) with                   flow velocity SV for the full range of the swimming trial at
modifications to the raceways, the flow-straightener and the                   the scheduled timeframe. We tested several standard ramping
flow control (Fig. 1A). The re-designed, multi-lane swim-                      protocols to test the alignment of the set and measured flow
ming chamber can be operated in a recirculating system                         velocities (Fig. 2A and B).
to accurately control the flow as well as the water quality
parameters, such as temperature and/or pCO2 . Modifications
of the raceways (244.0-mm length) comprised (i) rounded                        Manipulation of environmental parameters
(max. height, 37.3 mm; max. width, 20.9 mm; cross-sectional                    The multi-lane swimming chambers presented here have been
area, 660 mm2 ) instead of rectangular bottoms to reduce                       designed to enable researchers to test the swimming per-
areas of lower flow velocity and improve flow homogeneity                      formance of fishes under combined environmental stressors.
(Aminian et al., 2015) and (ii) doubling the length of the flow-               Although environmental parameters were not manipulated in
straightener (80.0-mm length, 5-mm diameter perforations)                      this study, temperature and pCO2 control was implemented
to improve flow uniformity and minimize turbulence in the                      in the swimming systems via the PLC system. This allows
initial segment of the swimming lanes. Further, a perforated                   testing swimming performance under combined predicted
panel (5-mm diameter perforations) was added to the rear end                   ocean warming and acidification conditions in future projects.
of the swimming raceways to keep a finer plastic mesh in place
that retained fatigued fish.                                                      In each of the swimming systems, pCO2 is measured
                                                                               continuously by an equilibrator system (as per Dickson
   In our setup, the recirculation system is powered by                        et al., 2007). Briefly, a side stream of water from the main
a magnetic drive centrifugal pump (Iwaki magnet drive                          circulation pump is provided in a fine spray to an air-tight
pump MX-400, Iwaki Co., Ltd, Tokyo, Japan). The water                          chamber (equilibrator) and the pCO2 in the air within the
flow, delivered by the recirculating loop to the chamber,                      head space of the chamber reaches equilibrium with the
is monitored using flow transmitters (Type 8032 Bürkert,                       pCO2 of the experimental sea water. The air mixture is
Ingelfingen, Germany) and regulated using proportional                         passed through the non-dispersive infrared CO2 analyser
electric actuators (ER20.X3B.GP6, Valpes, Moirans, France)                     to measure pCO2 (Telaire T6613, Amphenol, PA, USA). The
connected to two customized ball valves (DN15 and                              reading provides continuous feedback to the control system
DN50 VKD series, FIP SpA, Italy). The main feature                             to dissolve aliquots of CO2 into the system and match the
of the flow control loop (Fig. 1B) is regulating the two                       SV for pCO2 ; the gas dosing is controlled by the actuation
parallel streams of different size and capacity. The two                       of solenoid valves to deliver CO2 to a membrane contactor
streams, with 15-mm (low flow) and 50-mm (high flow)                           (3M™ Liqui-Cel™ EXF Extraflow 2.5X8) installed on a side
nominal diameters, respectively, are necessary to both                         stream line that returns CO2 -enriched water to the system’s
measure and control flow with the required accuracy                            sump for homogenous mixing. The pCO2 values are logged
and repeatability over a wide range of experimental                            at 20-second intervals.
velocities. The incoming water first flows through the
pre-chamber where the flow pattern is disrupted by two                            The experimental temperature is also controlled by the
mixing planes before entering the flow straightener at the                     PLC system via automatic valves and a shell and tube titanium
front end of the raceways. For our purposes, we built                          heat exchanger (Waterco Heat Exchanger 56 ). The feedback
three multi-lane swimming chambers; all of which could be                      is provided to the control system by a temperature sensor
controlled independently. The Inventor® model is available                     (TC Direct, FEP Insulated RTD Pt100 Sensors coupled with
in Supplementary Material S1.                                                  a Pt100 4-20mATransmitter) positioned at the intake of the

..........................................................................................................................................................
                                                                                                                                                         3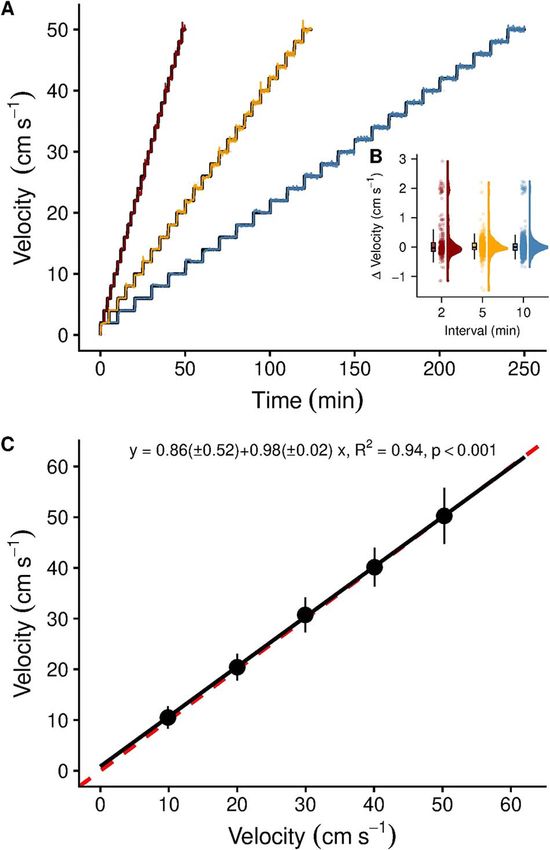
Toolbox                                                                                                    Conservation Physiology • Volume 9 2021
..........................................................................................................................................................

                                                                                                                                                             Downloaded from https://academic.oup.com/conphys/article/9/1/coaa131/6067276 by guest on 17 September 2021

Figure 1: (A) Multi-lane swimming chamber, modified after Stobutzki and Bellwood (1997). Design modifications included rounded instead of
rectangular-shaped raceways (244.0-mm length × 20.9-mm width ×37.3-mm depth) and flow straighteners that were doubled in length (80.0
instead of 40.0 mm). These changes helped (i) reduce the areas of lower flow velocity and (ii) increased flow uniformity. The drawing was created
in CAD software and can be downloaded from the Supplementary Material S1. (B) Organizational chart of the SCADA system monitoring and
regulating water parameters and flow velocity in the swimming chamber. PLC allows temperature and carbon dioxide partial pressure (pCO2 ) to
be simultaneously checked and adjusted. Water flow can be controlled by two proportional valves (a high- and a low-flow one) that are adjusted
according to the set flow velocity.

..........................................................................................................................................................
4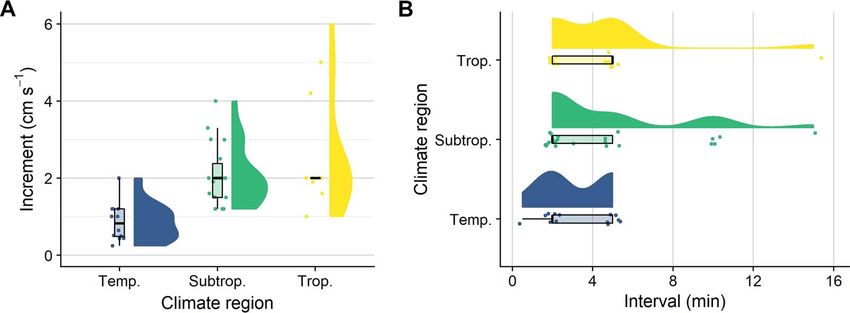
Conservation Physiology • Volume 9 2021                                                                                                          Toolbox
..........................................................................................................................................................

                                                                               fluorescent green polyethylene microspheres (size range 850–
                                                                               1000 μm) treated with a biocompatible surfactant to achieve
                                                                               neutral buoyancy (Tween 20; both Cospheric LLC, Santa Bar-
                                                                               bara, CA, USA). The microspheres were recorded from above
                                                                               (UI-3180CP Rev. 2.1, IDS GmbH, Obersulm, Germany) under
                                                                               UV light at velocities ranging from 10 to 50 cm s−1 at 10-
                                                                               cm s−1 increments. The videos were processed in ImageJ
                                                                               (Rasband, 1997) using the Flowtrace algorithm for visualizing
                                                                               time-varying flow fields (Gilpin et al., 2017), allowing us to
                                                                               analyse the distance the microspheres travelled per second
                                                                               (n = 10 per raceway and velocity increment). Unfortunately,

                                                                                                                                                             Downloaded from https://academic.oup.com/conphys/article/9/1/coaa131/6067276 by guest on 17 September 2021
                                                                               we had no physical copy of the original swimming chamber
                                                                               with rectangular raceways available to compare particle-
                                                                               tracking results across designs.

                                                                               Modelling
                                                                               We used CFD software to model the flow dynamics in
                                                                               the original (old) and modified (new) swimming chambers
                                                                               (Autodesk® CFD, Autodesk Inc, San Rafael, CA, USA). We
                                                                               modelled flow velocities of 10 and 40 cm s−1 , representing
                                                                               ecologically meaningful transport speeds that early life stages
                                                                               of tropical fishes can experience (see references in Fisher,
                                                                               2005). In contrast to the previous designs (Stobutzki and
                                                                               Bellwood, 1997; Faria et al., 2009), we used raceways with
                                                                               rounded, instead of rectangular, bottoms and we doubled
                                                                               the length of the flow straightener to improve the flow
                                                                               dynamics (i.e. create more homogenous flow profiles). We
                                                                               compared the flow velocities between the original and our
                                                                               updated design at three raceway sections (40 mm from the
                                                                               start and the centre and 40 mm before the end; see Fig. 3).
                                                                               In detail, we quantified the modelled flow velocities and
                                                                               turbulence intensity (data not shown) in each raceway at
                                                                               the three sections using 2×2-mm grids. We then compared
Figure 2: (A) Alignment of the automated set and measured flow
velocities for critical swimming performance (Ucrit ) protocols using
                                                                               flow velocity within and between the chamber designs using
2-cm s−1 increments (step height) and three intervals (2, 5 and                statistical models (see statistical analyses).
10 min, step lengths); (B) summary statistics (outliers not shown), raw
data and probability density of the difference between set and                 Experimental testing
measured flow velocities across the three time intervals
(colour-coded); (C) velocity validation of the swimming chamber                Animal husbandry
using video recordings of neutrally buoyant, fluorescent green
microspheres. All five raceways showed similar velocities and were             All fish rearing and experimentation was conducted in
not different from the ideal 1:1 line (red, dashed line). Flow                 September 2019 under animal ethics approval from the
visualization patterns were uniform and straight (see https://doi.             Animal Ethics Committee at James Cook University (Animal
org/10.5061/dryad.z34tmpgb7 for examples). Symbols and error bars              Ethics Permit A2473). Breeding pairs of the cinnamon
represent mean and standard deviation (n = 50 per velocity                     anemonefish (A. melanopus) held in captivity for several
increment).
                                                                               years were originally collected from the Great Barrier Reef
                                                                               by professional divers (Cairns Marine, Cairns, Australia).
pump. The logic switches from cooling to heating mode and
                                                                               Breeding pairs were maintained outdoors in 80-L tanks at
actuates the proportional control valve to vary the amount of
                                                                               the Marine and Aquaculture Research Facility at James Cook
primary water, 15◦ C and 40◦ C, which is delivered to the heat
                                                                               University (Townsville, Australia). Egg clutches that were
exchanger.
                                                                               laid on half a terracotta pot from one of the breeding pairs
                                                                               were transported to the National Sea Simulator (SeaSim) at
Flow dynamics                                                                  the Australian Institute of Marine Science two nights before
                                                                               hatch. Here, the pot with the egg clutch was deployed in
Particle tracking
                                                                               a rectangular 50-L tank with gentle water flow directed
For flow visualization, we tracked neutrally buoyant par-                      on the clutch (0.3 L min−1 , 28.5◦ C, 35 ppt salinity). After
ticles in the newly designed swimming chambers. We used                        seven nights, the larvae hatched (90% hatching success) and

..........................................................................................................................................................
                                                                                                                                                         5
Toolbox Conservation Physiology • Volume 9 2021
..........................................................................................................................................................
Downloaded from https://academic.oup.com/conphys/article/9/1/coaa131/6067276 by guest on 17 September 2021
Figure 3: Modelled flow velocities across different swimming chamber sections and designs at (A) 10 cm s−1 and (B) 40 cm s−1 . To improve
flow uniformity and reduce areas of lower velocity, the new swimming chamber design had rounded instead of rectangular raceway bottoms
and an elongated flow straightener. Using CFD software, flow velocities were modelled on grids at three sections of the swimming chamber
(start, centre, end). Bayesian generalized linear models showed higher accuracy of the new swimming chamber design at the faster velocity but
no overall differences in velocity across sections or designs. Data were simulated from the posterior predictive distributions of the Markov chain
Monte Carlo models. Presented are the summary statistics (outliers not shown), the medians from each iteration and the probability density
curves. Dashed lines indicate set flow velocities.
the fish were supplied with rotifers (Brachionus plicatilis) males) underwent communal mass spawning as described in
enriched overnight (Selco© S.parkle, concentrate, Inve Thépot and Jerry (2015). After hatching (14 hpf; average
Aquaculture Inc., Salt Lake City, USA) at a concentration hatch tank conditions: 30◦ C, 8.1 pH, 30 ppt salinity,
of 15 rotifers mL−1 . From 5 days post-hatch (dph), freshly >5.0 mg L−1 O2 ), larvae were transferred to the SeaSim.
hatched Artemia nauplii (Artemia salina) were added to Here, the barramundi larvae were maintained in rectan-
the tanks (2 artemia mL−1 , Inve Aquaculture Inc., Salt Lake gular 50-L flow-through tanks (28.5◦ C, 35 ppt salinity).
City, USA). Barramundi larvae were reared in ‘green water’ (0.5 × 10e6
cells mL−1 , Nanno 3600™, Reed Mariculture Inc., CA,
Barramundi (L. calcarifer) larvae were supplied by USA) until 7 dph and were provided with enriched rotifers
Jarrod Guppy and Adrien Marc (Centre for Sustainable (0–16 dph, 15 rotifers mL−1 ) and freshly hatched artemia
Tropical Fisheries and Aquaculture, James Cook University). (2 artemia mL−1 ) from 12 dph onwards. In total, cinnamon
After injection with luteinizing hormone-releasing hormone anemonefish and barramundi larvae were reared over
analogue, 12 broodstock barramundi (4 females and 8 3 weeks.
..........................................................................................................................................................
6Conservation Physiology • Volume 9 2021 Toolbox
..........................................................................................................................................................
Downloaded from https://academic.oup.com/conphys/article/9/1/coaa131/6067276 by guest on 17 September 2021
Figure 4: Overview of critical swimming speed (Ucrit ) protocols used for testing the swimming performance of early life stages of marine fishes.
During a Ucrit protocol, the water velocity is continuously increased in pre-defined increments (step heights) and intervals (step lengths) until
the tested animal fatigues. (A) Increments and (B) intervals are separated by the temperate, subtropical and tropical climate regions the tested
species inhabit (blue, green and yellow, respectively). Data on Ucrit protocols were collected through a systematic literature search (see Downie
et al., 2020 for the search term), and 36 papers were identified (n = 56 trials). We excluded one polar species (shorthorn sculpin; 1-cm s−1
increment, 2-min interval). Raw data, summary statistics and probability density were visualized using raincloud plots (Allen et al., 2019).
Swimming protocols or 2.00 cm s−1 ), t is the time spent swimming at the final
velocity increment and ti is the respective time interval for
Protocols for measuring critical swimming speeds (Ucrit ) con-
each velocity increment (2, 5, 10 or 20 min). We considered
sist of a step-wise increase in flow velocity until the test
fish to have reached their Ucrit when they could not maintain
subject fatigues. Protocols can vary in the step height (incre-
position for a full time interval (Fisher et al., 2005). Although
ment; cm s−1 ) or step length (interval; min) and various
several fish are routinely swum at the same time in multi-
combinations have been used for measuring Ucrit (see Downie
lane swimming chambers (Faria et al., 2009, 2014), inter-
et al., 2020 for a review of Ucrit criteria). Most protocols
individual differences in performance can lead to situations
are adapted to the swimming abilities of the tested species
where some individuals are still swimming and others are
and vary across climate regions (see Fig. 4 for a systematic
already fatigued and forced against the rear grid. In our
overview of protocols used for testing Ucrit in early life stages
study, we stopped trials once the last swimming fish became
of marine fishes). In the current experiment, we used the
fatigued. For the fish that fatigued before, we calculated the
newly developed swimming chambers and the automated
time spent at the grid by subtracting each fish’s time spent
control settings to investigate how different protocols affect
swimming from the last swimming fish’s total trial time. This
Ucrit estimates for early life stages of two tropical fishes,
allowed us to assess which of the protocols reduced the time
the coral reef cinnamon anemonefish and the catadromous
spent at the rear grid after fatigue and aligned best with
barramundi. We determined the Ucrit of both species at com-
current animal welfare considerations.
parable body lengths (ca. 4–10 mm SL) and swam cinnamon
anemonefish at 4, 8, 12 and 16 dph and barramundi at 12,
16 and 20 dph. The protocols differed slightly between the Statistical analyses
two species, as barramundi larvae are weaker swimmers and All analyses were performed in R (version 3.5.2) (R Devel-
could not be exposed to the same increments (i.e. step heights) opment Core Team, 2018). Data distributions were explored
as used for the anemonefish offspring (B. Illing, pers. obs.). using correlation matrices (package ‘GGally’, v. 1.5.0) (Schlo-
Therefore, the protocols consisted of increments of 1.0, 1.5 erke, 2020). We used a Bayesian framework to obtain distri-
and 2.0 cm s−1 for cinnamon anemonefish and 0.25, 0.50 and butions of the modelled flow velocities and to better estimate
1.00 cm s−1 for barramundi. For both species, we used 2-, the variation within and between the two designs. Frequentist
5- and 10-min intervals; an additional 20-min interval was analyses were used for particle tracking and experimental
also used for cinnamon anemonefish. These settings allowed validation, and final models were selected using the Akaike
us to make comparisons with previously used protocols, information criterion (AIC) for small sample sizes (‘AICc’,
for example, those used with cinnamon anemonefish (Fisher package ‘MuMIn’, v. 1.0.0) (Barton, 2009). For the flow
et al., 2000; Green and Fisher, 2004). We calculated Ucrit modelling, Bayesian generalized linear models were created
following Brett (1964) as for both 10 and 40 cm s−1 set velocities (package ‘rsta-
Ucrit = U + t × ti −1 × Ui , narm’, v.2.19.3) (Goodrich et al., 2020). We used default,
weakly informative priors and a Gaussian likelihood, and
where U is the penultimate speed a fish was able to maintain, we ran diagnostics on auto-correlation and convergence with
Ui is the respective velocity increment (0.25, 0.50, 1.00, 1.50 package ‘coda’ (v.0.19-3) (Plummer et al., 2019). Candidate
..........................................................................................................................................................
7Toolbox Conservation Physiology • Volume 9 2021
..........................................................................................................................................................
models were compared using expected log predictive den- Larger variance was observed at higher velocities (Figs 3
sity using the ‘loo_compare’ function (package ‘loo’, v.2.3.1) and 2C).
(Vehtari et al., 2020). The two final models (velocity_modeled
∼ chamb_design+chamb_section) were executed with three Flow dynamics: modelling
chains and fully converged using a warm-up of 1000 and
a total of 10 000 iterations. Prior and posterior distribu- The modelled flow velocity did not differ between the modi-
tions were examined with the function ‘pp_check’ (package fied and original swimming chamber design, at neither 10 nor
‘bayesplot’, v.1.7.1) (Gabry and Mahr, 2020). Using the pack- 40 cm s−1 (i.e. the 95% HPD intervals intersected with zero).
ages ‘coda’ and ‘emmeans’ (v. 1.4.2) (Lenth, 2020), we then However, the new design was slightly more accurate at the
simulated data from the posterior predictive distribution and higher velocity (Fig. 3B). The modified design had a median
we obtained estimated marginal means and highest posterior velocity of 40.0 cm s−1 (39.3–40.6 cm s−1 ), whereas the
original design had a slightly larger median (40.4 cm s−1 ) and
Downloaded from https://academic.oup.com/conphys/article/9/1/coaa131/6067276 by guest on 17 September 2021
density (HPD) intervals.
range (39.8–41.0 cm s−1 ). No differences in modelled velocity
For the particle tracking and experimental validation data, were found across the three tested sections; in other words, in
(generalized) linear regression models were created. The all comparisons, the 95% HPD intersected with zero.
exception was for the cinnamon anemonefish trials where
a generalized additive model best explained the observed Experimental testing
variance (package ‘mgcv’, v. 1.8–28) (Wood, 2019). The
most parsimonious model based on the AIC was selected. The Ucrit of early life stages of tropical cinnamon anemone-
Diagnostic plots helped verify normality and homogeneity fish (16.23 ± 0.39 cm s−1 , mean ± SE) increased significantly
of variance of the model residuals (i.e. Q–Q plots and across the first weeks of life (generalized additive model,
residual versus fitted plots) (package ‘car’, v. 3.0–3) (Fox P < 0.001, adjusted R2 = 0.86, deviance explained 89.1%,
and Weisberg, 2019). Post-hoc comparisons and predictions n = 236). SL, used as a smooth term in the model, had a
from the (generalized) linear regression models were made significant effect on Ucrit (edf = 6.85, F = 221.8, P < 0.001).
using the package ‘emmeans’, whereas pairwise comparisons After metamorphosis and the transition from a pelagic to
of the generalized additive model outcome were undertaken a benthic lifestyle, Ucrit of cinnamon anemonefish reached
with manually created contrast matrices using the ‘glht’ a plateau (Fig. 5A). Pairwise comparisons using the P value
function (package ‘multcomp’, v. 1.4-10) (Hothorn et al., adjustment method between the tested increment protocols
2020). Data were visualized with packages ‘tidyverse’ (v. were not significant, indicating that increasing the step heights
1.3.0.) (Wickham, 2019), ‘cowplot’ (v. 1.0.0) (Wilke, 2019) of the Ucrit protocol from 1.0 to 1.5 or 2.0 cm s−1 had no effect
and ‘magick’ (v. 2.3) (Ooms, 2020). on the Ucrit of cinnamon anemonefish. However, extending
the intervals (i.e. the step length) of the Ucrit protocols by
more than 2.5 times significantly decreased Ucrit of cinnamon
anemonefish. We found that extending the interval from 2
Results to 5 min decreased Ucrit on average by (mean ± SE) 0.49 (±
0.39) cm s−1 (P = 0.69), whereas increasing intervals from 2
Automated flow control to 10 min and 20 min decreased Ucrit significantly by 1.58
The algorithm successfully regulated and monitored the flow (± 0.39) and 2.73 (± 0.39) cm s−1 , respectively (P value
control (see Supplementary Material S2 for an overview of adjustment method, P < 0.01).
the programmable logic control and the code). Several warm-
up trials were required to predict the correct settings for Critical swimming speeds of barramundi offspring were
positioning the two different-sized ball-pen valves that reg- positively correlated with SL, with the best fitting model
ulated flow velocity. Thereafter, set and measured flow veloc- including interaction terms between SL, increments and inter-
ities fully aligned (Fig. 2A) and the algorithm created repro- vals (linear model, P < 0.001, adjusted R2 = 0.62, df = 102).
ducible flow velocities, irrespective of the time intervals used For each millimetre in length, the barramundi increased their
(Fig. 2B). Ucrit by 2.00 (± 0.30) cm s−1 . In contrast to the findings
from the anemonefish, longer intervals did not significantly
change Ucrit estimates for barramundi. The Ucrit estimates
Flow dynamics: particle tracking for barramundi that were swum at the medium 0.5-cm s−1
increment height (4.93 ± 0.35 cm s−1 ) were lower than in both
In the newly designed chambers, uniform and straight flow other treatments (Ucrit of 6.47 ± 0.33 and 6.05 ± 0.37 cm s−1
was observed (see https://doi.org/10.5061/dryad.z34tmpgb7 for at 0.25 and 1.00 cm s−1 increments, respectively) (Fig. 5B).
all data and exemplary Flowtrace visualizations at 10 and Tukey post-hoc tests identified the difference between the
40 cm s−1 , respectively). No differences in flow velocity were 0.25- and 0.50-cm s−1 increments as significant (P < 0.01,
observed between raceways (linear model, P > 0.05, df = 240), df = 102) but not the other combinations.
and the slope of the linear model explaining the variability
in the data best (measured velocity ∼ set velocity × raceway) The time that fatigued fishes spent at the rear grid before
was indistinguishable from the optimal 1:1 line (Fig. 2C). the trials were stopped slightly decreased with size in cinna-
..........................................................................................................................................................
8Conservation Physiology • Volume 9 2021 Toolbox
..........................................................................................................................................................
Downloaded from https://academic.oup.com/conphys/article/9/1/coaa131/6067276 by guest on 17 September 2021
Figure 5: Effect of different increment (step height, sub-panels) and interval (step duration, colour-coded) protocols on critical swimming
speed (Ucrit ) estimates of early life stages of (A) cinnamon anemonefish (Amphiprion melanopus) and (B) barramundi (Lates calcarifer). Symbols
represent the original Ucrit data (n = 5 per increment and interval combination). Symbol shapes indicate the age at which the fishes were tested
(in dph). Linear model predictions (mean ± SE) are given for each protocol (see Supplementary Material S3 for the model parameters).
mon anemonefish (linear model, P = 0.21, adjusted R2 = 0.30, water quality parameters. In this study, we improved the
df = 175); however, this trend was reversed in barramundi, accuracy and repeatability of swimming performance mea-
where larger, fatigued individuals spent significantly more surements by automating multi-lane swimming chambers for
time at the rear grid than smaller, fatigued conspecifics (linear small fishes with an open-source computer algorithm. Using
model, P = 0.02, adjusted R2 = 0.41, df = 83) (Fig. 6). Faster tri- CFD software, we found that structural modifications to an
als, i.e. when swimming protocols with higher increments and original swimming chamber design reduced areas of lower
shorter intervals were used, led to a significantly shorter time flow but only slightly increased the accuracy of flow velocity
that fatigued fish spend at the rear grid. This was observed in at higher speeds. Experimental particle-tracking results in
both cinnamon anemonefish (Tukey post-hoc tests, P < 0.01, the modified swimming chamber confirmed the modelled
df = 175) and barramundi (Tukey post-hoc tests, P < 0.01, uniform water flow. We used the automated chambers to
df = 83) (see Fig. 6 and Supplementary Material S3 for model test critical swimming speeds (Ucrit ) of early life stages of
parameters). two tropical fishes and found species-specific sensitivity to
changes in swimming protocols.
Discussion Swimming chamber design
Swimming performance is a critical metric for estimating In swimming chambers, fishes can save substantial amounts
locomotory capacity in fishes, and an important proxy for of energy by swimming close to wall sections where viscosity
estimating the effects of environmental stress. Yet, most swim- restricts the velocity gradient of water (Brett, 1964; van den
ming chambers require manual control of water flow and Thillart et al., 2004; Ellerby and Herskin, 2013). In addition,
..........................................................................................................................................................
9Toolbox Conservation Physiology • Volume 9 2021
..........................................................................................................................................................
Downloaded from https://academic.oup.com/conphys/article/9/1/coaa131/6067276 by guest on 17 September 2021
Figure 6: Effect of different increment (step height, sub-panels) and interval (step duration, colour-coded) protocols on the time that fishes,
fatigued from a Ucrit trial (Fig. 5), spent resting at the rear grid of the swimming chamber before trials were stopped. Linear model predictions
(mean ± SE) are given for each protocol (see Supplementary Material S3 for model parameters) using early life stages of (A) cinnamon
anemonefish (Amphiprion melanopus) and (B) barramundi (Lates calcarifer). Symbols represent raw data (n = 2–4 per increment and interval
combination) and shapes indicate the age at which the fishes were tested (in dph). Please note the logarithmic scaling of the y-axes.
the size and structure of the chambers can affect flow con- raceway designs. However, fishes can actively avoid areas
ditions and a study on small-bodied or juvenile Australian of high flow (e.g. the central cross-section of a raceway)
freshwater fish found this to affect Ucrit estimates (Kern et al., (Tudorache et al., 2013), which supports our decision to
2018). Given the substantial reduction in power requirements remove the bottom corners and generate potentially more
for fishes to swim in areas of lower flow velocity, we designed conservative Ucrit estimates. Another important modification
the new multi-lane swimming chamber with convex instead in our study was the elongation of the flow straightener, a
of rectangular raceways. This modification reduced the areas structure consisting of aligned tubes to minimize turbulence
of lower flow velocity while still allowing future recording and velocity gradients at the front section of the raceways.
of distortion-free, high-angle videos of experimental animals. Most fishes are tested in swimming chambers with rectilinear
Changing the raceways design was in line with previous and uniform flow conditions, as turbulence intensity may
findings on the effects of experimental setups on the swim- affect fish swimming performance and energetics in various
ming performance of small fishes. In a study on post-smolt ways (Cotel and Webb, 2015; van der Hoop et al., 2018).
Atlantic salmon (Salmo salar), Hvas and Oppedal (2019) Optimal flow straightener length to size proportions can be
found that a rectangular swimming chamber design, and asso- found at 6 or 8 (Bell and Terhune, 1970). As flow profiles
ciated irregularities in the flow profile, could have contributed in pipes need some time to develop, a certain hydrodynamic
to lower critical swimming speeds (Ucrit ) of Atlantic salmon entrance length must be considered. When turbulent flow
when compared with a design with circular cross-sections. A enters pipes, such as individual flow straightener tubes, this
potential caveat of our study is that we could not directly entrance effect becomes negligible when the pipe length is
compare Ucrit estimates between the rectangular and rounded roughly 10 times larger than the pipe diameter (Çengel and
..........................................................................................................................................................
10Conservation Physiology • Volume 9 2021 Toolbox
..........................................................................................................................................................
Cimbala, 2006). In the case of the multi-lane swimming Flow dynamics
chambers, this critical flow straightener length is reached at
50 mm. Thus, doubling the flow straightener length from 40 A combination of CFD with non-intrusive experimental val-
idation (e.g. particle tracking) has been considered valuable
to 80 mm helped develop the full, rectilinear flow profile.
for assessing flow dynamics in biophysical research (Fiore
et al., 2017; Divi et al., 2018). Here, we used a CFD soft-
Automated flow control ware and particle tracking of fluorescent, neutrally buoyant
microspheres to validate flow velocity and uniformity in the
Automation and control of fish swimming chambers has
developed in conjunction with digital advances and available updated design of the multi-lane swimming chamber. The
results from the CFD models showed no significant differ-
computer technology (Gehrke et al., 1990). Today, control
ences in flow velocity or turbulence intensity (data not pre-
and monitoring of environmental conditions and fish per-
sented) between the original and updated design with rounded
Downloaded from https://academic.oup.com/conphys/article/9/1/coaa131/6067276 by guest on 17 September 2021
formance in swimming chambers is readily available (e.g.
raceways and elongated flow straightener. The small differ-
automated measurements in intermittent-flow respirometry).
ences in flow velocity across designs might be dispensable
Still, most systems lack a computerized control of water flow
and few commercial software exists to automate and con- when considering the observed inter-individual variability
in swimming performance in early life stages of cinnamon
trol water velocity in swim tunnels (e.g. AutoSwim, Loligo®
anemonefish and barramundi. Although we could not directly
Systems, Viborg, Denmark). Although our approach requires
the use of industrial, micro-PLCs and supervisory control compare swimming performance between the two different
multi-lane swimming chamber designs, body size and used
and data acquisition (SCADA) systems, we provide a first
swimming protocols could have more pronounced effects
open-source algorithm for automating and controlling water
velocity in multi-lane swimming chambers. Here, the bene- than minute differences in flow velocity (Fig. 5). Still, remov-
ing some areas of lower flow velocity (i.e. the bottom corners
fits of the automated swimming chambers are (i) a reduced
of the raceways) helped create more uniform flow patterns.
interference between the operator and the system and poten-
This reduced options for the tested fishes to escape the higher
tially less-impacted swimming performance measurements;
flow velocity in the central cross-sections ensuring they were
(ii) more accurate adjustments of flow velocity, i.e. removal of
potential delays and imprecise valve adjustments; and (iii) the really swimming against the set velocity. Some non-intrusive
experimental techniques estimate flow rate by measuring
ability to test more fishes at the same time. We acknowledge
flow velocities with the Doppler shift induced in reflected
the limited availability of commercial SCADA systems and
industrial-level micro-PLCs to many researchers; however, sound or light energy by buoyant particles (e.g. acoustic
or laser Doppler velocimetry) (Çengel and Cimbala, 2006;
some open-source software alternatives and low-cost hard-
Ellerby and Herskin, 2013). Other methods, such as parti-
ware solutions exist that can make use of the algorithm’s
logic (Supplementary Material S2). For example, the Open- cle image or tracking velocimetry, use laser sheets at cross-
sectional areas to track particles. However, most of these
PLC Project (https://openplcproject.com) offers an open-source
techniques are difficult to implement and optimize, which
SCADA system, an editor to create ladder logic and function
blocks and a software to control several embedded system is why open-source algorithms such as Flowtrace, can help
visualize flow patterns in a more practicable way (Gilpin et
platforms (e.g. Raspberry Pi, FreeWave and UniPi). Other
al., 2017). We found Flowtrace to be a cost-effective alterna-
low-cost microcontroller platforms, for example Arduino
models, can be controlled through an independent develop- tive for experimentally validating flow velocities in swimming
chambers. In contrast to other calibration techniques, such
ment environment using desktop computers. In fact, a recent
as dyes (Kroon and Housefield, 2003), the use of fluorescent
study made use of these latter components to automate a
swimming flume for individual zebrafish (Widrick et al., microspheres and subsequent Flowtrace visualizations highly
improved our qualitative analysis of flow uniformity and
2018). Regarding the algorithm’s performance, some of the
velocity. In fact, we were able to confirm the CFD findings on
observed variability in measured versus set velocity (Fig. 2B)
can be explained by the electrical actuators’ hysteresis (about flow velocity and observed higher variability in flow velocity
at higher set speeds. The CFD findings on turbulence intensity
4◦ at any set angle). Using more than two proportional control
and the 2D-Flowtrace visualizations showed that turbulence
valves (Fig. 1) could further reduce this variability but would
also increase the setup’s technical complexity. The algorithm was highest just after the flow straightener and the following
few centimetres.
could further be used in aquaculture engineering to control
and automate water flow patterns and exercise fishes to
improve growth and fitness. In fact, exercising fishes in aqua-
culture has been shown to improve growth and optimal rates
Swimming protocols
have been observed at speeds where energetic efficiency is Critical swimming speed (Ucrit ) is often used to define pro-
highest (Palstra and Planas, 2011; Palstra et al., 2019). Future longed swimming capabilities of fishes. Although most fishes
work could further help remove observer bias and operator do not routinely swim at Ucrit , the metric is often used
presence by remotely operating the swimming chambers using as a proxy for condition and larval dispersal (Faria et al.,
machine learning and remotely monitoring fish performance, 2011a; Nanninga and Manica, 2018). Critical swimming
pose and position (Graving et al., 2019). speeds increase rapidly with larval development (Moyano
..........................................................................................................................................................
11Toolbox Conservation Physiology • Volume 9 2021
..........................................................................................................................................................
et al., 2016; Cominassi et al., 2019). However, the swim- when using multi-lane swimming chambers. When swimming
ming performance of many marine demersal fish levels off several, small fish in multi-lane chambers simultaneously, the
after metamorphosis and shifts in habitat, e.g. settlement to time that fatigued fish spend at the rear grid before trials can
rocky reefs or tropical coral reefs (Stobutzki and Bellwood, be ceased should be minimized. Based on our chosen proto-
1994; Leis, 2010, 2011). This change in performance is cols and life stages, we recommend swimming barramundi
likely related to physiological and morphological changes and cinnamon anemonefish in multi-lane chambers using 5-
associated with the transition from a pelagic to a benthic min intervals and 0.5 and 2.0 cm s−1 increments, respectively.
lifestyle (Nilsson et al., 2007). In line with findings from other Technical modifications, such as openings in the lid on top
pomacentrids (Stobutzki and Bellwood, 1994), the tested of each lane, could further assist with quickly removing
cinnamon anemonefish reduced their swimming performance fatigued fish; however, manipulating the multi-lane swimming
upon metamorphosis and settlement. In contrast, the estuar- chambers while some individuals are still swimming could
Downloaded from https://academic.oup.com/conphys/article/9/1/coaa131/6067276 by guest on 17 September 2021
ine barramundi’s swimming performance increased linearly affect ongoing swimming performance measurements. An
with larval development. However, catadromous barramundi alternative is to use single lanes only (Silva et al., 2015) but
show a similar decrease in locomotor performance once they multi-factorial experiments often require large sample sizes
metamorphose into benthic juveniles, change habitat and and thus high throughput and simultaneous measurements
become ambush predators (Edmunds et al., 2010). In our of several fish (Silva et al., 2016). For other species, we
study, all tested barramundi were still in the larval phase, recommend quantifying effects of different velocity incre-
though, as metamorphosis occurs in barramundi at about ments and time intervals in pre-trials before experimenta-
11 mm (Barlow et al., 1995). tion to assist comparative studies in accounting for potential
biases in methodology. This may be particularly important
The Ucrit methodology has been criticized for several rea- if the swimming performance data are subsequently used
sons, including its sensitivity to the time intervals and velocity for parameterizing individual-based models that help predict
increments used (Farlinger and Beamish, 1977; Kolok, 1999; growth and dispersal dynamics of early life stages of fishes.
Fisher and Leis, 2010; Downie et al., 2020). Although some
fish species and life stages seem to be robust against changes
in Ucrit protocols (Fisher and Leis, 2010; Dalziel and Schulte,
Relevance of larval fish swimming
2012), other findings suggest sensitivities to changes in the performance for conservation
methodology (Kolok, 1999; Downie and Kieffer, 2017). No From a conservation perspective, connectivity estimates of
systematic tests have so far been conducted to investigate fish populations can contribute to improve management
the effects of development, body length, time intervals and efforts, e.g. through assessing marine reserve performance
velocity increments on Ucrit of marine fish larvae. Two pre- (Harrison et al., 2020). Information on how environmental
vious studies on settlement stages of tropical coral reef fishes parameters affect larval fish development and performance
investigated the effects of different time intervals. Both studies are thus important for parameterizing predictive models
found no differences in Ucrit when individuals were swum assessing the growth and dispersal of larvae. Laboratory
at 2 or 5 min (Fisher et al., 2005) and at 2 or 15 min experiments can assist with creating this information and can
(Hogan et al., 2007) time intervals. Similarly, we found no simulate current and predicted environmental conditions.
differences in Ucrit of barramundi offspring that were swum With regard to temperature, the development of marine
at different time intervals (2, 5, and 10 min). In contrast, Ucrit larval stages quickens and dispersal is generally considered
estimates for the cinnamon anemonefish were significantly to be reduced under warmer conditions in tropical species
affected when time intervals were extended by more than 2.5 (Álvarez-Noriega et al., 2020). Indeed, cinnamon anemone-
times (i.e. from 2 to 10 or 20 min). Swimming speeds and fish larvae have been found to have faster development
velocity increments are often expressed in relative terms (body
and growth at elevated temperatures, which also increased
lengths per second, BL s−1 ), and a commonly used velocity
their critical swimming speeds (Green and Fisher, 2004).
increment is 3 BL s−1 (Bellwood and Fisher, 2001; Fisher,
To the best of our knowledge, no information exists on
2005; Fisher et al., 2005). In line with this, we chose similar
how temperature affects swimming in larval barramundi;
absolute velocity increments for cinnamon anemonefish (1.0,
however, larval barramundi develop faster at elevated
1.5 and 2.0 cm s−1 ; circa 4–10 mm SL; min. and max. range
1–5 BL s−1 ), but we had to use lower velocity increments for temperatures and exhibit higher critical swimming speeds
barramundi offspring, as they exhibited reduced swimming as juveniles (Carey and Franklin, 2009). Integrating this
capabilities (0.25, 0.5 and 1.0 cm s−1 ; circa 4–10 mm SL; physiological information and the inter-individual variability
min. and max. range: 0.25–1 BL s−1 ). In contrast to the to individual-based growth and dispersal models will support
above-mentioned studies on the swimming performance of the robustness of predictions. Currently, the pelagic larval
settlement stages of tropical coral reef fishes, our findings duration is often used to assess the effects of global warming
suggest species-specific sensitivities of early life stages of on the individual dispersal capabilities of larval fishes
tropical fishes to different Ucrit protocols. (Kendall et al., 2016). Integrating more accurate findings of
larval fish swimming performance under conditions predicted
Differences in performance across species and life stages for mid- and end-of-century conditions will strengthen these
should also be considered from an animal welfare perspective model predictions and support conservation efforts, such as
..........................................................................................................................................................
12You can also read