Predicting biases in very highly educated samples: Numeracy and metacognition
←
→
Page content transcription
If your browser does not render page correctly, please read the page content below
Judgment and Decision Making, Vol. 9, No. 1, January 2014, pp. 15–34

   Predicting biases in very highly educated samples: Numeracy and
                             metacognition

                     Saima Ghazal∗                 Edward T. Cokely,∗ †                        Rocio Garcia-Retamero† ‡

                                                                     Abstract

         We investigated the relations between numeracy and superior judgment and decision making in two large community
      outreach studies in Holland (n=5408). In these very highly educated samples (e.g., 30–50% held graduate degrees),
      the Berlin Numeracy Test was a robust predictor of financial, medical, and metacognitive task performance (i.e., lotteries,
      intertemporal choice, denominator neglect, and confidence judgments), independent of education, gender, age, and another
      numeracy assessment. Metacognitive processes partially mediated the link between numeracy and superior performance.
      More numerate participants performed better because they deliberated more during decision making and more accurately
      evaluated their judgments (e.g., less overconfidence). Results suggest that well-designed numeracy tests tend to be robust
      predictors of superior judgment and decision making because they simultaneously assess (1) mathematical competency
      and (2) metacognitive and self-regulated learning skills.
      Keywords: numeracy, risk literacy, individual differences, cognitive abilities, superior decision making, judgment bias,
      metacognition, confidence, dual systems.

1 Introduction                                                                   Furlan, Stein, & Pardo, 2012; Lindberg, & Friborg, 2013;
                                                                                 Schapira et al., 2012; Weller, Dieckmann, Tusler, Mertz,
Statistical numeracy—i.e., one’s practical understanding                         Burns, & Peters, 2013).1 Research indicates that the link
of probabilistic and statistical problem solving—is one                          between numeracy and superior decision making does not
of the strongest domain-general predictors of superior                           primarily reflect differences in abstract reasoning or neo-
judgment and decision making in both numerical and                               classically normative decision strategies.2 Instead, nu-
non-numerical tasks (Cokely, Galesic, Schulz, Ghazal, &                          meracy’s predictive power often reflects differences in (1)
Garcia-Retamero, 2012; Cokely & Kelley, 2009; Kut-                               heuristic-based deliberation (e.g., deep elaborative pro-
ner, Greenberg, Jin, & Paulsen, 2006; Lipkus & Peters,                           cessing, Cokely & Kelley, 2009; Cokely et al., 2012); (2)
2009; Peters, 2012; Peters & Levin, 2008; Peters et al.,                         affective numerical intuition (e.g., precise symbolic num-
2006; Reyna, Nelson, Han, & Dieckmann, 2009). Nu-                                ber mapping, Peters, 2012; Peters et al., 2006); and (3)
meracy also tends to be a substantial independent predic-                        meaningful intuitive understanding (e.g., gist-based rep-
tor of superior performance when compared with tests of                          resentation and reasoning; Reyna, 2004, 2012; Reyna &
fluid intelligence, cognitive reflection, and attentional con-                   Brainerd, 2005b; Reyna et al., 2009).
trol (Cokely et al., 2012; Låg, Bauger, Liberali, Reyna,                            There are now many established and newer numeracy
                                                                                 tests validated for use with diverse samples (e.g., the “Nu-
                                                                                 meracy Understanding in Medicine Instrument” (NUMi)
   Financial support for this research was provided by grants from the
National Science Foundation (SES–1253263) and the Ministerio de                  for older-adult patient samples; Schapira et al., 2012).
Economía y Competitividad (entitled “Helping Doctors and Their Pa-               However, most numeracy tests are not appropriate for the
tients Make Decisions About Health”, PSI2011–22954). We are grateful
to Han van der Maas, Marthe Straatemeier, and colleagues and staff at                 1 Some innovative research shows that executive functions can out-
the University of Amsterdam, and Hans van Maanen and staff from de               predict numeracy under some conditions (Del Missier, Mäntylä, & Bru-
Volkskrant newspaper for their support and assistance with data collec-          ine de Bruin, 2012; Del Missier, Mäntylä, Hansson, Bruine de Bruin,
tion.                                                                            & Parker, 2013). However, as noted by the authors (see also Cokely et
   Copyright: © 2013. The authors license this article under the terms of        al., 2012), highly sensitive numeracy tests were not yet widely available
the Creative Commons Attribution 3.0 License.                                    and could not be used in these studies. Related replication and extension
    ∗ Department of Cognitive and Learning Sciences, Michigan Tech-
                                                                                 studies are currently ongoing in our laboratory.
nological University. Authorship is equal for the first two authors.                  2 Although numeracy tends to predict superior performance, numer-
Correspondence concerning this article should be addressed to Edward             acy is also positively correlated with some non-normative biases. See
T. Cokely, Department of Cognitive and Learning Sciences, Michigan               Peters et al. (2006) for the seminal example of numeracy’s link with
Technological University. Email: ecokely@mtu.edu.                                heuristic processes that can give rise to both normatively superior and
    † Center for Adaptive Behavior and Cognition, Max Planck Institute
                                                                                 inferior judgment and decision making. See Cokely and Kelley (2009)
for Human Development.                                                           for a cognitive process tracing study detailing qualitative and quantitative
    ‡ Department of Psychology, University of Granada                            differences in heuristic search and elaborative encoding.

                                                                            15
Judgment and Decision Making, Vol. 9, No. 1, January 2014                     Numeracy and biases in the highly educated                16

measurement of statistical numeracy in highly educated           assessment of numeracy often used in health and medical
participants such as professionals working in medicine           domains asks participants eight questions in which they
and finance (for a review of available numeracy tests see        judge their personal levels of numeracy (e.g., “How good
Cokely, Ghazal, & Garcia-Retamero, 2013, in press). One          are you at working with fractions;” Fagerlin et al, 2007;
exception is the Berlin Numeracy Test (BNT), which has           Zikmund-Fisher, Smith, Ubel, & Fagerlin, 2007; and for
been found to provide superior psychometric sensitivity          subjective graph literacy see Garcia-Retamero, Cokely, &
in moderate to very highly numerate participants (e.g.,          Ghazal, 2014b). Several studies indicate moderate-to-
college students, professionals, computer literate adults;       high correlations between objective and subjective mea-
Cokely et al., 2012). Accordingly, we build on previ-            sures (Fagerlin et al., 2007; Liberali et al., 2012; Weller
ous research investigating the mechanisms, robustness,           et al., 2013; Zikmund-Fisher et al., 2007). Studies fur-
and generalizability of numeracy by examining the per-           ther show the subjective test can provide unique predictive
formance of two very highly educated community sam-              power beyond intelligence test scores (Låg et al., 2013).
ples on a small set of paradigmatic judgment and decision        Nevertheless, other research indicates that people can be
making tasks. We begin with a literature review provid-          highly overconfidence in reporting their subjective numer-
ing an overview of some of the notable findings and nu-          ical ability. For example, Sheridan, Pignone, and Lewis
meracy assessment tools that are now available. We then          (2003) showed that 70% of subjects reported that they con-
present results of two new studies conducted as part of our      sider themselves to be “good with numbers”, while only
RiskLiteracy.org outreach efforts (e.g., a study included        2% of those respondents correctly answered three objec-
in a newspaper report about the importance of statistics         tive numeracy questions (see also Dunning, Heath, & Suls,
for decision making). We conclude with a discussion of           2004).3
the links between numeracy, metacognition, and superior             Performance based numeracy assessments are the most
judgment and decision making.                                    commonly used methods in the allied decision sciences.
                                                                 The longest-standing and most widely used assessments of
                                                                 numeracy are based on classical testing theory, which es-
1.1    Numeracy                                                  timates theoretical differences in abilities based on one’s
Experts do not agree on an exact and uncontroversial theo-       relative test score (Novick, 1966; see also Cokely et al.,
retical definition of mathematics. Fortunately, quantitative     2013, in press; Lipkus, Samsa, & Rimer, 2001; Peters et
skills are easier to operationalize and measure. For more        al., 2006; Schapira, Walker, & Sedivy, 2009; Schwartz et
than 50 years, researchers have studied the causes and           al., 1997). To illustrate, in 1997, Schwartz et al. (1997)
consequences of numeracy (Huff & Geis, 1954; Paulos,             conducted a seminal randomized cross-sectional numer-
1988), including extensive longitudinal studies conducted        acy study investigating the relations between numeracy
in large diverse samples such as the National Assessment         and relative risk perceptions. Five hundred women were
of Adult Literacy (NAAL; Kutner et al., 2006) and the Pro-       initially mailed the study stimuli and asked to partici-
gram for International Student Assessment (PISA; OECD,           pate. Respondents included 287 mostly older adult women
2012). There is wide agreement that the theoretical con-         (mean age 68 years) who were veterans with modest in-
struct of “numeracy” is not synonymous with pure mathe-          comes (e.g., less than $25,000 per year). The majority
matical skill but instead refers to mathematical or quantita-    of participants had also completed high school (96%) and
tive literacy (Steen, 1990; see also Nelson, Reyna, Fager-       about a third had completed at least some college. Nu-
lin, Lipkus, & Peters, 2008, and Reyna et al., 2009), re-        meracy was assessed with three items that were similar to
flecting an emphasis on “mathematics in context” as de-          and based on items used in the NAAL survey (see previ-
scribed in the US Common Core State Standards Initia-            ous section). Once scored, these items were used to pre-
tives. Specifically, the construct “numeracy” refers to the      dict the women’s understanding of data presented in one
“array of mathematically related proficiencies that are evi-     of four formats (e.g., relative risk reduction versus abso-
dent in adults’ lives . . . including a connection to context,   lute risk reduction with baseline). The women were asked
purpose, or use. . . for active participation in the demo-       to interpret the material provided and to report on the
cratic process and. . . in the global economy” (Ginsburg,        risks/benefits of mammography screening (e.g., “Imagine
Manly, & Schmitt, 2006). At the more basic levels, numer-        1000 women exactly like you. Of these women what is
acy involves the “real number line, time, measurement,           your best guess about how many will die from breast can-
and estimation” whereas higher levels focus on an “under-        cer during the next 10 years if they are not screened ev-
standing of ratio concepts, notably fractions, proportions,      ery year for breast cancer?”). Results indicated that about
percentages, and probabilities” (Reyna et al., 2009).
                                                                     3 The three items were from the test by Schwartz et al. (1997). These
   Within the decision sciences, efforts to understand and
                                                                 results suggest that subjective instruments are likely best suited for spe-
measure numeracy involve both subjective and perfor-             cific purposes, including rapid, rough numeracy assessment among peo-
mance assessments. For example, one validated subjective         ple who have some math anxiety.
Judgment and Decision Making, Vol. 9, No. 1, January 2014 Numeracy and biases in the highly educated 17
half of the women (i.e., 54%) accurately answered two consistently does an item distinguish individuals at higher
questions, while only 20% accurately answered all three versus lower trait levels), and guessing (e.g., true/false
(i.e., most could not convert 1 in 1000 to 0.1%). As ex- items will be guessed correctly 50% of the time). To il-
pected, results also revealed a moderate positive correla- lustrate, Schapira et al. (2012) developed the Numeracy
tion between participants’ final score and their relative risk Understanding in Medicine Instrument (NUMi) to pro-
reduction interpretations, providing evidence of decision- vide a higher-fidelity assessment of basic health numer-
related criterion validity for the brief assessment. acy among less educated patient samples. The 20 item
The results of Schwartz et al. (1997) and the subse- test was developed using a two parameter IRT approach
quent results provided by Lipkus et al. (2001) were timely integrating four numeracy sub-skills (e.g., graph literacy,
for a number of reasons (for reviews see Cokely et al., statistical numeracy). Results reveal that the NUMi test is
2012, in press).4 First, the results provided additional evi- robust and provides good psychometric sensitivity that is
dence that among community samples in the United States suitable for use with less numerate individuals (e.g., older
some sizable proportion of individuals were likely to be adult patient samples). Results also provided evidence of
statistically innumerate (e.g., 20% failed questions deal- construct validity and unique predictive power (e.g., inde-
ing with risk magnitude), a result that accords with find- pendent of the predictions of general intelligence tests).
ings from the NALS and NAALS National Surveys. Such
findings are important, as many efforts designed to sup- Using a Rasch analysis, which is akin to a one param-
port informed and shared decision making rest on an as- eter IRT-type approach, Weller et al. (2013) developed an
sumption that decision-makers are numerate (or at least eight item numeracy measure optimized for use with the
sufficiently statistically numerate; see also Edwards & El- general population of the United States. Test development
wyn, 2009, and Guadagnoli & Ward, 1998). Second, re- involved comparison of 18 items taken from existing mea-
sults indicated that domain framing (e.g., medical, finan- sures of numeracy and a cognitive reflection test. Specifi-
cial, or abstract gambles) did not tend to affect test per- cally, items were drawn from tests developed by Lipkus et
formance or comprehension. This finding indicates that al. (2001) (which includes the items of Schwartz et al.,
various domain-specific items (e.g., items framed in terms 1997), and tests developed by Peters et al. (2007), and
of financial, medical or gambling risks) can provide a rea- Frederick (2005). The resulting scale provides greatly im-
sonable basis for the assessment of domain-general statis- proved psychometric discriminability when used with the
tical numeracy skills, although it is theoretically possible general population of the United States. Evidence also
that domain familiarity will confer some additional deci- indicates that the test provides stronger predictive valid-
sion performance advantages (Levy, Ubel, Dillard, Weir, ity for risk judgments (i.e., Låg et al., 2013; Lipkus et
& Fagerlin, 2014). al., 2001). Despite these notable improvements, one lim-
itation of the Weller et al. (2013) abbreviated numeracy
scale, as well as the test items analyzed by Låg and col-
1.2 Advances in numeracy assessment leagues (2013), is that they combine two distinct types of
After more than a decade of research using classical tests test items with differential ranges of sensitivity to improve
of numeracy, research in the decision sciences has turned psychometric sensitivity of the numeracy assessments. In
to modern psychometric testing paradigms—i.e., Item Re- particular, they include: (1) some relatively difficult items
sponse Theory (IRT) and its variants. In contrast to classi- designed to measure cognitive impulsivity/reflection (i.e.,
cal testing theory, item response theory requires modeling the CRT by Frederick, 2005) and (2) some relatively easy
of probabilistic distributions over test taker’s responses to items designed to measure statistical numeracy.5
specific items. The focus of test development is on the
item rather than on the pooled responses to items as in 5 Although confirmatory factor analysis has indicated that the con-
classical testing theory. A full description of the theory is structs can be considered one factor, there is reason to be cautious with
beyond the scope of this paper (see Lord, 1980; Van der this interpretation. The two types of items have been found to dissoci-
Linden & Hambleton, 1997); however, it is useful to note ate in theoretically notable ways, differentially predicting financial judg-
that IRT tests improve predictive performance by eliminat- ments, reasoning, and risk comprehension (Cokely et al., 2012; Cokely,
Parpart, & Schooler, 2009; Di-Girolamo, Harrison, Lau, & Swarthout,
ing item redundancy with estimated parameters including 2014; Låg et al., 2013; Liberali et al., 2012). Recent results also indicate
item difficulty (e.g., how hard is any particular item for the two types of items can load on different factors (Liberali et al., 2011)
a given trait level), discrimination (e.g., how sharply and and that statistical numeracy alone can capture all reliable variance asso-
ciated with the CRT in some tasks involving highly educated individuals
4 There are also a number of performance measures of numeracy that (Låg et al., 2013). Differences in item type are also responsible for dif-
assess one’s approximate number system—a related but independent the- ferences in psychometric discrimination at different ranges (e.g., CRT
oretical construct. For a recent example of these tests see Lindskog, Win- items are harder and numeracy items are easier; Låg et al., 2013; Weller
man, and Juslin (2013). et al., 2013).Judgment and Decision Making, Vol. 9, No. 1, January 2014 Numeracy and biases in the highly educated 18
1.3 The Berlin Numeracy Test Garcia-Retamero, 2012). Theoretically, the test should
predict performance across the same wide range of do-
Building on the work of Lipkus et al. (2001) and Schwartz mains as other numeracy tests (e.g., the correlation with
et al. (1997), Cokely and colleagues (2012) developed a the test by Schwartz et al., 1997 is around .5). However,
fast psychometric test of differences in statistical numer- unlike other numeracy tests, the BNT is designed to pro-
acy among educated samples of adults living in diverse in- vide greater psychometric sensitivity among moderate-to-
dustrialized countries (e.g., college students, working pro- very-highly numerate individuals, such as highly educated
fessionals, and computer literate adults). The test was cre- participants and professionals. Nevertheless, there could
ated using new statistical numeracy items selected from a be some threshold level of mathematical skill wherein
large pool of candidate items. All items were subjected decision-makers are competent enough to accurately inter-
to think aloud protocol analysis to control for potential pret and perform all requisite calculations present in judg-
confounds from factors such as linguistic confusion. The ment and decision task stimuli. In the same way reading
test was then developed using a decision tree application ability becomes less predictive of performance once one
from the predictive modeling software DTREG (Sherrod, has achieved college level reading proficiency, numeracy’s
2003). The analysis yielded several versions of the test predictive power may wane or fail among very highly ed-
(see http://www.RiskLiteracy.org for links and test format ucated participants because they’re all numerate enough.
recommendation tools), including (i) the adaptive test that To investigate issues in psychometric sensitivity and pre-
adjusts item difficulty based on a test-takers previous re- dictive validity, along with an examination of some key
sponses (2–3 items; about 2.5 minutes duration) and (ii) underlying cognitive mechanisms, we conducted a series
a traditional 4 item paper-and-pencil test (4 items; < 5 of two large studies of paradigmatic judgment and deci-
minutes duration). Psychometrically the decision tree’s sion making tasks in very highly educated samples from
assessment approximates an item response theory analy- the Netherlands.
sis identifying items with high levels of discriminability
across a specified range of item difficulty, with a guessing
parameter of zero. 1.4 Experimenting with public outreach
The construct validity, reliability, and psychometric
sensitivity of the Berlin Numeracy Test was initially es- In 2012, following the publication of the Berlin Numer-
tablished in 21 studies (n=5336) of participants from 15 acy Test and the launch of www.RiskLiteracy.org, we were
countries including assessments of diverse groups (e.g., contacted by a journalist working for de Volkskrant—a
US medical professionals, community samples, Mechan- national daily morning newspaper in Holland.7 He was
ical Turk web-panels). Validation studies have since interested in details of the BNT for an article about the
been extended to participants from 60 countries and in- importance of statistics for decision making. Rather than
clude several patient and physician samples from all over include a direct link to RiskLiteracy.org, we asked if we
the world (Garcia-Retamero, Cokely, & Ghazal, 2014a; could create a unique link to an experiment that would
Garcia-Retamero, Wicki, Cokely, & Hanson, in press). be included in the newspaper article. Along with allow-
Initial and subsequent analyses indicate that the test of- ing for the collection of data, the link would provide users
fers robust sensitivity, with optimal performance among with immediate feedback on their relative numeracy lev-
those who have some college education.6 The test was els (e.g., an estimate of their overall risk literacy). Ulti-
also found to be the strongest predictor of understanding mately, with support from editors, technical support, in-
everyday risks (e.g., evaluating claims about products and ternal review boards, etc., we created a brief online study
treatments; interpreting forecasts), doubling the predictive that newspaper readers could participate in, hosted on the
power of other numeracy instruments and accounting for de Volkskrant website (ca. 5–8 minutes long). In turn, we
unique variance beyond other cognitive tests (e.g., cogni- provided participants with feedback on their initial perfor-
tive reflection, working memory, intelligence). mance (i.e., immediate feedback on their Berlin Numer-
acy Test scores) and later provided a general summary of
The BNT has been validated for the prediction of risk
results included in a second follow-up newspaper article
literacy (e.g., accurate interpretation and comprehension
along with additional learning resources.
of everyday risks). However, relatively few studies have
investigated the relationship between performance on the At a later date, we were invited to take part in the Grand
test and in other types of tasks measuring superior perfor- National Numeracy Survey in the Netherlands.8 Again,
mance (for some related examples see Di-Girolamo et al., one constraint was that our study needed to be very brief
2014; Garcia-Retamero, Cokely, Wicki, & Hanson, 2014; 7 We thank Hans van Maanen, editors, and technical support at de
Riege & Teigen, 2013; Woller-Carter, Okan, Cokely, & Volkskrant.
8 We thank Han van der Maas, Marthe Straatemeire, and other col-
6 Sensitivity was poorest among students at an elite university in leagues and participating researchers with the Grand National Numeracy
China. About 75% of those participants answered all questions correctly. Survey.Judgment and Decision Making, Vol. 9, No. 1, January 2014 Numeracy and biases in the highly educated 19
2.2 Materials, procedures, and hypotheses
Table 1: Demographic data on reported occupation and
education level in Study 1. Data represented as propor- All materials were presented in Dutch.9 Data were col-
tions. lected using online survey software (unipark.de) with re-
cruitment via a link hosted on the de Volkskrant website,
Education
which was included in both online and print versions of a
Occupation (proportion) College degree Masters/PhD newspaper article. Upon logging onto the website, partic-
ipants were redirected to the online survey on the secure
Banking/Finance .04 .66 .41 unipark server and were subsequently presented with an
Statistics/Math. .06 .92 .73 approved electronic informed consent for review and ap-
Computer/Engineer. .17 .78 .54 proval. Next participants read brief instructions and com-
Humanities /Art .05 .85 .68 pleted an adaptive version of the Berlin Numeracy Test,
wherein participants were asked 2–3 questions that were
Medicine/Health .12 .86 .68
selected based on the accuracy of their previous answers
Management/Admin. .12 .74 .49 (i.e., correct answers led to harder questions, incorrect an-
Customer services .01 .46 .24 swers led to easier questions).
Students .08 .57 .34 Participants were next presented with three tasks in
Others .36 .69 .47 a financial context on a new website page. Two ques-
tions were simple lotteries taken from previous research
(Cokely & Kelley, 2009; Frederick, 2005; see Appendix
A). For example, participants were asked whether they
and include the Berlin Numeracy Test with performance would prefer +/− C100 for certain or 75% chance of
feedback. For both studies, we selected paradigmatic +/− C200 (i.e., in either gain or loss frame; see Appendix
judgment and decision criterion tasks based on previous A for all material). The two lotteries were systematically
research. Each task was selected to provide a small but counterbalanced and presented in randomized order (e.g.,
representative window (1–2 items) into central topics in gain first, loss first). The third question on the page was
judgment and decision making, presented either in the an intertemporal choice that has previously been shown to
context of finance (i.e., gain/loss lotteries and intertem- track individual differences in cognitive reflection (Fred-
poral choice) or medicine/health (evaluating clinical trials erick, 2005), namely, “which option would you prefer:
with differing group sizes; subjective confidence in judg- C3400 this month or C3800 next month”. Overall, we
ment). We also collected data on decision latencies using a hypothesized that more numerate participants would make
relatively insensitive but convenient response time metric more normatively superior choices, showing smaller fram-
(i.e., how long was the internet window open during finan- ing effects (i.e., approximating expected value) and pre-
cial decisions). Study 2 (Dutch National Numeracy Sur- ferring more normative discounting rates. Consistent with
vey) provided a replication and extension of Study 1 (de previous findings (Cokely & Kelley, 2009), we predicted
Volkskrant) in which participants completed all the same that total decision latency on the website page featuring all
tasks and also completed the numeracy test by Schwartz three questions (i.e., a rough proxy for total deliberation)
et al. (1997). would be related to numeracy and superior performance.
We further hypothesized that decision latency would par-
tially mediate the relationship between the Berlin Numer-
acy Test and superior financial decision making.
For tasks in the medical context, we presented a mod-
2 Study one: de Volkskrant newspa- ified medical scenario known to be associated with de-
per study nominator neglect, taken from Okan, Garcia-Retamero,
Cokely, & Maldonado (2012; see also Garcia-Retamero
& Galesic, 2009).10 Participants were asked to rate the
2.1 Participants effectiveness of a drug based on fictional results of a clini-
9 We thank Dafina Petrova and several colleagues at de Volkskrant for
About 4500 visitors responded to the newspaper article
facilitating translation of the informed consent and basic test materials.
presented in de Volkskrant in 2012. After removing partic- The BNT translation employed in Cokely et al. (2012) was used in this
ipants who did not complete the entire study, the final data study.
10 We did not assess judgment latencies because both the metacognitive
set used for analysis included 3990 respondents, 64% of
judgment and the denominator neglect question were presented on the
whom were male. The mean participant age was 48 years
same page and we could not control for differences in reading times (e.g.,
(SD = 13.5). Demographic data on reported education and there was a paragraph describing the clinical trials required for the initial
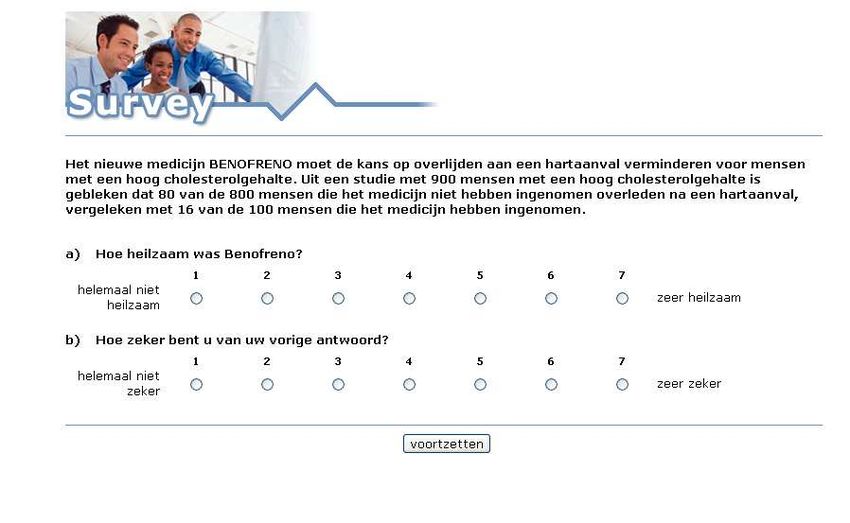
occupational fields are presented in Table 1. judgment, see Appendix).Judgment and Decision Making, Vol. 9, No. 1, January 2014 Numeracy and biases in the highly educated 20
cal trial of a drug designed to reduce heart attack in which
Figure 1: Percentage of participants at each level of nu-
“. . . 80 out of 800 people who did not take the drug died
meracy as measured by the Berlin Numeracy Test. The
after a heart attack, compared to 16 out of 100 people who
four levels represent estimated quartile norms for educated
took the drug”. We then asked participants “How help-
samples from industrialized countries.
ful was this drug” on a 7 point scale. Those participants
75%
who accurately estimated the ratios would find that 10%
of those who did not take the drug died, compared to 16%
of those who did take the drug. Thus, the drug was not
61%
effective. We hypothesized that less numerate participants
who focused on factors like the absolute number of pa-
Percentage of Participants
tients who died (16 died if they took the drug versus 80
50%
died if they didn’t take the drug) would come to a dif-
ferent, non-normative conclusion (i.e., show denominator
neglect bias). Next we asked all participants how con-
fident they were in their previous helpfulness judgment,
using a 7 point scale where 1 indicated not at all confi-
25%
dent and 7 indicated very confident (see Appendix A and
B for exact materials). We hypothesized that accuracy and 17%
15%
confidence should have a non-linear relationship. Those
who do not effectively self-monitor would tend to be very 7%
confident in their inaccurate judgments (i.e., unskilled and
0%
unaware phenomena; Ehrlinger, Johnson, Banner, Dun-
ning, & Kruger, 2008). However, as the quality of one’s 1 2 3 4
metacognitive self-assessment increased so too should ac-
curacy (i.e., a curvilinear relationship). We further hypoth-
esized that the relationship between scores on the Berlin 2.3.1 Financial choices
Numeracy Test and accuracy would be partially mediated
by people’s ability to accurately assess their own judgment A linear regression was used to examine the relation be-
(i.e., degree of overconfidence). tween the BNT and overall score on all three financial
Following all performance tasks, participants were pre- choices (i.e., normative accuracy). Regression indicated
sented with a demographics questionnaire, including ques- that BNT was a moderate sized, significant single predic-
tions on their sex, age, education, and professional field. tor of normatively superior financial decisions (F (1, 3986)
Participants were presented with information about their = 282.7, β = .26, p < .001, R2 = .07—β represents the
numeracy score and their relative estimated risk literacy standardized regression weight). Individuals who scored
(see RiskLiteracy.org for examples). Finally, participants higher on the BNT made more normatively superior deci-
were thanked and debriefed. sions than those with lower BNT scores (see Figure 2).
A significant positive relationship was observed be-
tween education and BNT (r (3988) = .21, p =.0001) and
2.3 Results between education and performance (r (3988) = .16, p =
.0001). To examine further the role of education and other
Our sample from de Volkskrant showed a much higher av-
potentially influential variables, we constructed a series of
erage score on the Berlin Numeracy Test than other past
hierarchical linear regression models with gender and age
samples of college educated participants, including sam-
(model 1), education (model 2), and BNT (model 3) as
ples of practicing surgeons in the EU (Figure 1). The high
predictors of overall financial decisions. The full model
scores were anticipated because participants were (a) read-
(model 3) significantly predicted performance on the three
ing newspaper articles about statistics for leisure, (b) moti-
financial decisions (R2 = .11, F (4, 3655) = 116.53, p <
vated to log on and test their numeracy skill, and (c) highly
.001). The BNT remained a moderately sized predictor of
educated (72% of the participants reported earning at least
superior financial choices with education, age, and gender
one college degree and 50% reported having more than
included (R2change = .04, β = .20) (see Table 2).11
one, see Table 1). Overall 61% of the sample answered
We recorded the time each participant spent on the web-
all questions correctly and 76% scored above the median
page with the financial decisions as a rough proxy for over-
on BNT test (see Figure 1). Also, consistent with previous
findings, men (t (3960) = 5.9, p = .001) and younger adults 11 When only age and gender, not education, were included along with
(t (3620) = 6.11, p = .001) tended to score slightly higher BNT, the coefficient for BNT was little changed (R2 = .10, R2change = .05,
on the BNT than women and older adults. β = .23, p < .001).Judgment and Decision Making, Vol. 9, No. 1, January 2014 Numeracy and biases in the highly educated 21
Table 2: Hierarchical regression predicting performance Figure 2: Percentage of respondents at each level of the
on financial decision tasks. Berlin Numeracy Test who made more normatively supe-
rior financial decisions.
Models
R2
100
F
and β R R2 BNT1
change change
variables BNT2
BNT3
80
Model 1 0.23 0.05 0.05 100.57∗∗ BNT4
Gender ∗∗
Percentage of Participants
−0.23
Age −0.09∗∗
60
Model 2: Educ. added 0.27 0.08 0.25 97.3∗∗
Gender −0.22∗∗
40
Age −0.09∗∗
Education 0.16∗∗
20
Model 3: BNT added 0.34 0.11 0.04 150.01∗∗
Gender −0.20∗∗
Age −0.06∗∗
0
Education 0.11∗∗ Gain Loss Intertemporal
BNT 0.20∗∗
Note: ∗∗
p < .001. perior risky decision making in the gain frame (r (3988)
= .17, p =.001) and in the loss frame (r (3988) = −.17,
p < .001).12 Linear regression indicated that BNT pre-
all deliberation during risky decision making. We found dicted overall performance on combined (gain and loss)
a positive relationship between decision latency and the decisions (R2 = .05, F (1, 3986) = 207.4, β = −.22, p <
BNT (r (3988) = .074, p < .001), between decision la- .001). To compare predictive power relative to other po-
tency and superior financial decisions including all three tentially influential variables, we constructed hierarchical
decisions in aggregate (r (3988) = .068, p < .001) and be- linear regression models with gender and age (model 1),
tween BNT and superior financial decision (r (3988) = .26, education (model 2), and BNT (model 3) as predictors of
p < .001). A mediation model was developed (Preacher & overall risky lottery decisions. The BNT coefficient was
Hayes, 2004). The direct effects of BNT on performance largely unchanged when age, gender and education were
(path c) and the indirect effects of BNT on performance included (β = −.18, p < .001).
via decision latency (i.e., deliberation) are presented in
Figure 3. Results reveal significant and positive direct ef-
fects (path a) of the BNT on latency (B = .09, se = .01, p 2.3.3 Intertemporal choice
< .001), and of latency (path b) on superior decision mak-
ing (B = .09, se = .02, p < .001). An examination of the For the intertemporal time preference question 87% of the
specific indirect effects (path c’) indicates that the relation- total sample made normatively superior choices (i.e., pre-
ship between the BNT and superior decision making was ferred C3800 next month rather than C3400 this month).
partially mediated by decision latency (B = .208, SE = .01, Linear regression indicated BNT was a significant predic-
p < .001; Sobel test value z = 4.04, p < .001). Note that, tor of time preferences (R2 = .03, F (1, 3986) = 115.6, β =
although the relationship is significant, the magnitude is .17, p < .001).13 BNT remained a predictor for intertempo-
modest and smaller than in past studies. We speculate the ral choices when age, gender, and education were included
difference reflects psychometric limits of our rough deci- in a linear regression (β = .12, p < .001).
sion latency assessment (i.e., total website page viewing
time for only three choices) as well as restriction of range 12 We also performed a non-parametric chi-square test to examine the
in our very highly educated sample. relationship between numeracy and framing effects; we found that highly
numerate participants selected more normatively superior decisions for
gains (52% vs 39%, χ(1) 46.1, pJudgment and Decision Making, Vol. 9, No. 1, January 2014 Numeracy and biases in the highly educated 22
Figure 3: Deliberation (i.e., decision latency) partially me- Table 3: Hierarchical regression predicting performance
diated the relationship between the BNT and superior fi- on the medical judgment task.
nancial decision making. The Sobel test of mediation was
significant, z = 4.04, p < .0001. Unstandardized path co- Models
R2 F
efficients are shown with standard errors in parenthesis. and β R R2
change change
variables
Delibration Model 1 0.022 0 0 0.89
Gender −0.02
Age −0.002
.09 (.01) .09 (.02)
Model 2: Educ. added 0.091 0.008 0.008 28.78∗∗
Gender −0.02
Age 0.00
Education 0.09∗∗
c'= .208 (.01)
BNT Performance
c = .22 (.01) Model 3: BNT added 0.205 0.042 0.034 128.34∗∗
Gender 0.001
Age 0.025
2.3.4 Medical judgment Education 0.045∗
BNT 0.19∗∗
Seventy four percent of the total sample made normative
judgments on the medical judgment task.14 Linear regres- Note: ∗ p < .05, ∗∗ p < .001.
sion indicated that the BNT was a significant single pre-
dictor of accuracy of the medical judgments (R2 = .04, F
(1, 3986) = 180.86, β = .21, p < .001). Hierarchical linear creased, the total number of participants with perfect cali-
regression models examined potentially influential vari- bration also increased, while the proportion of participants
ables of age and gender (model 1), education (model 2), who were overconfident decreased (Table 4). We also
and BNT (model 3). The BNT coefficient was essentially found that the strength of the relationship between con-
unaffected by the inclusion of these variables (R2 change = fidence and accuracy increased at higher levels of numer-
.034, β = .19, p < .001; see Table 3). acy, while the strength of the curvilinear model decreased,
as did the difference between the linear and curvilinear
2.3.5 Confidence models (Table 4). These results suggest that participants
who are more numerate also tend to have better judgment
We analyzed the relationship between the BNT, medi- calibration (e.g., less overconfidence). Path analysis in-
cal judgment accuracy, and confidence in judgment. We dicated that confidence partially mediated the relationship
found a positive relationship between the BNT and confi- between BNT and accuracy (Table 5).
dence (r (3988) = .09, p < .001). We also found a positive
relationship between confidence and accuracy of medical
judgments (r (3988) = .26, p < .0001). Curve estimation
indicated that the relationship between confidence and ac- 2.4 Study 1 discussion
curacy was curvilinear and that a quadratic model fit better
than the linear model (R2 for quadratic = .12, R2 for lin-
Taken together the results of Study 1 indicate that even
ear = .07, R2change = .05). Figure 4 shows the best fitting
in very highly educated and highly numerate commu-
models. Note that both the decrease in confidence as ac-
nity samples (Table 6) the Berlin Numeracy Test is a ro-
curacy increased from 1 to 4 and the increase as accuracy
bust predictor of paradigmatic financial and medical judg-
increased from 4 to 7 were highly significant (p < .001).
ment and decision making. Results also indicate that the
This result suggests the presence of an unskilled and un-
numeracy test predicts superior performance in part be-
aware type effect (i.e., participants were highly overcon-
cause it predicts differences in metacognitive processes,
fident at low levels of accuracy yet relatively well cal-
including differences in deliberation (as evidenced by de-
ibrated at higher levels of accuracy). As numeracy in-
cision latencies) and differences in the quality of one’s
14 Choosing 1 on a 7-point scale, in which 7 means that the drug is very self-assessment (as evidenced by differences in overcon-
effective and 1 means drug is not effective. fidence).Judgment and Decision Making, Vol. 9, No. 1, January 2014 Numeracy and biases in the highly educated 23
Table 4: Proportion of participants who had perfect cali- Figure 4: Curvilinear relationship between accuracy and
bration or were overconfident at each level of numeracy. confidence. High levels of overconfidence at low levels
Results of accuracy regressed on confidence at each level of accuracy (i.e., lower numbers on the x-axis) become
of BNT are also presented. more calibrated at higher levels of accuracy. Circle areas
represents the proportion of respondents in each response
Prop. R2 category.
Prop.
BNT perfectly R2 R2 linear
over-
levels cali- linear quadratic − R2
conf.
7
brated quad.
BNT=1 .48 .27 0.03∗ 0.19∗∗
6
−0.16
BNT=2 .56 .21 0.07∗∗ 0.18∗∗ −0.11
Confidence
5
BNT=3 .61 .15 0.05∗∗ 0.15∗∗ −0.10
BNT=4 .65 .08 0.08∗∗ 0.13∗∗ −0.05
4
Note: ∗
p < .01, ∗∗ p < .001.
3
2
Table 5: Mediation through MEDCURVE (Hayes &
Preacher, 2010), indirect effects of BNT on accuracy
1
through confidence judgments.
X Values ab (indirect 95% conf. 1 2 3 4 5 6 7
SE
(BNT) effect) interval
Accuracy
2.3 (–1 SD) .079 .014 .053–.110
3.3 (Mean) .084 .016 .055–.115 ticipants with a mean age of 44 years (SD = 15). Fifty
4.3 (+1 SD) .088 .018 .057–.120 two percent of the sample was male. Thirty percent of the
Note: The table displays results of a medcurve sample had at least one advanced graduate degree.
meditational analysis at the mean BNT score and
at BNT scores +/– 1 standard deviation from the 3.1.2 Material and procedure
mean. Indirect effects (i.e., mediation) of the BNT-
to-performance relation via confidence judgments are All materials and procedures in Study 2 were identical to
shown to be significant with ab indirect effect coeffi- those used in Study 1 except that we included the Schwartz
cients and confidence intervals that do not include zero et al.’s (1997) three item numeracy test immediately before
points. the adaptive Berlin Numeracy Test items.
3 Study 2: Data from the Dutch 3.2 Results and discussion
Grand National Numeracy Survey About 38% of the sample scored perfectly on the Berlin
Numeracy Test (a score of 4) and 57% of the sample
In Study 2 we sought to extend results from Study 1 by scored above the median point on the BNT (see Figure
comparing the predictive performance of the Berlin Nu- 5). This suggests that the Study 2 sample was more nu-
meracy Test with another commonly used brief numeracy merate than the educated samples used to norm the Berlin
test, namely the Schwartz et al. (1997) three item numer- Numeracy Test yet was considerably less numerate than
acy test. the sample from Study 1 (76% of which were above the
median; see Figure 1).
Analyses followed those presented in Study 1. Linear
3.1 Method regression indicated that the BNT predicted superior per-
3.1.1 Participants formance on combined financial decision tasks (β = .24;
R2 = .06, F (1, 1417) = 83.88, p < .001), medical judg-
Data were collected in Holland via an online link included ments (β = .22; R2 = .05, F (1, 1417) = 72.18, p < .001),
as part of Dutch Grand National Numeracy Survey and and confidence judgments (β = .23; R2 = .053, F (1, 1417)
associated outreach efforts. The data included 1418 par- = 79.76, p < .001). A series of sets of hierarchical linearJudgment and Decision Making, Vol. 9, No. 1, January 2014 Numeracy and biases in the highly educated 24
Table 6: Overall performance on medical judgments, fi- Table 7: Hierarchical regression predicting performance
nancial decisions and BNT. on financial decision tasks (Study 2).
Medical Financial Models
Profession N BNT R2 F
judgments decisions and β R R2
change change
variables
Banking/Finance 139 0.85 0.86 0.79
Statistics/Math. 256 0.90 0.90 0.92 Model 1 0.23 0.05 0.05 34.89∗∗
Computer/Eng. 681 0.91 0.89 0.87 Gender −0.22∗∗
Humanities/Art 212 0.89 0.83 0.80 Age −0.07∗
Medicine/Health 459 0.91 0.84 0.83 Model 2: Educ. added 0.26 0.065 0.013 18.15∗∗
Mgmt./Admin. 467 0.90 0.84 0.81 Gender −0.22∗∗
Cust. services 67 0.86 0.83 0.74 Age −0.08∗
Students 306 0.88 0.84 0.84 Education 0.12∗∗
Others 1430 0.89 0.84 0.80
Model 3: BNT added 0.3 0.09 0.03 37.67∗∗
Gender −0.18∗∗
regression models with gender and age (model 1), educa- Age −0.047
tion (model 2), and BNT (model 3) as predictors of finan- Education 0.078∗
cial decision were used to estimate independent contribu-
BNT 0.18∗∗
tions of each factor. In a model including age, gender, and
education, the BNT provided unique predictive power for Note: ∗
p < .05; ∗∗ p < .001.
financial decisions (R2change = .03, β= .18, p < .001)15 (see
Table 7). In a model including age, gender and education
the BNT was also a good predictor of superior medical We found that time spent on financial decisions was pos-
judgments (R2change = .025, β = .17, p < .001) and confi- itively related to performance on financial decisions (β =
dence judgment (R2 change = .036, β = .20, p < .001; see .09, p = .001). However, the relation between BNT and
Tables 8 and 9 for full model). As in Study 1, the BNT time was not quite significant (β = .05, p = .08), and our
coefficient was reduced only a little by the addition of the mediational analysis indicated a non-significant trend to-
other predictors. ward partial mediation (Sobel test of mediation, z = 1.43, p
We again found a curvilinear relationship between ac- = .15). We speculate that this reflects the same psychome-
curacy of medical judgments and confidence (R2 for tric limitations noted in Study 1 (i.e., limited webpage de-
quadratic = .15, as compared to R2 for linear = .08, R2change cision latency assessment sensitivity, restriction of range).
= .074). As numeracy increased, the total number of We note that partial mediation has been seen in other stud-
participants with perfect calibration also increased, while ies (e.g., Study 1, Barton, Cokely, Galesic, Koehler, &
the proportion of participants who were overconfident de- Haas, 2009; Cokely & Kelley, 2009; Woller-Carter et al.,
creased (Table 10). We also found that the strength of the 2012).
relationship between confidence and accuracy tended to
increase at higher levels of numeracy, while the strength
of the curvilinear model tended to decrease, as did the dif- 3.3 Psychometric analysis
ference between the linear and curvilinear models (Table
10). These results suggest that participants who are more Regression analysis indicated the Schwartz et al.’s (1997)
numerate also tend to be better at assessing the accuracy of test was a robust single predictor of financial decisions (β
their judgments (e.g., less overconfidence). Path analysis = .20; R2 = .04, F (1, 1417) = 56.99, p < .001) and medi-
indicated that confidence partially mediated the relation- cal judgments (β = .17; R2 = .03, F (1, 1417) = 40.04, p <
ship between BNT and accuracy. .001). Additional analyses indicated that the BNT doubled
We analyzed the relationship between decision latency, the unique predictive power of the Schwartz et al.’s (1997)
the BNT, and superior financial decisions as in Study 1. test for both superior financial and medical decisions (Ta-
ble 11). A hierarchical linear regression examined the po-
15 We also constructed hierarchical linear regression models without
tential additive effects with models of BNT (model 1) and
entering the education variable into the model (gender and age [model
BNT and Schwartz et al.’s (1997) (model 2). Adding the
1] and BNT [model 2]). Excluding education, we found that the model
was still a relatively good predictor of superior performance (R2 = .09, R Schwartz et al.’s (1996) test to the BNT provided a modest
change = .035, p < .001; β = .19). significant improvement in the predictive power for com-Judgment and Decision Making, Vol. 9, No. 1, January 2014 Numeracy and biases in the highly educated 25
Table 8: Hierarchical regression predicting performance Table 9: Hierarchical regression predicting performance
on medical judgment task (Study 2). on subjective confidence task (Study 2).
Models Models
R2 F R2 F
and β R R2 and β R R2
change change change change
variables variables
Model 1 0.07 0.005 0.005 3.13∗ Model 1 0.13 0.02 0.02 11.67∗∗
Gender −0.04 Gender −0.13∗∗
Age −0.06∗ Age −0.01
Model 2: Educ. added 0.15 0.023 0.018 23.57∗∗ Model 2: Educ. added 0.195 0.04 0.02 26.26∗∗
Gender −0.04 Gender −0.13∗∗
Age −0.07∗ Age −0.02
Education 0.135∗∗ Education 0.14∗∗
Model 3: BNT added 0.22 0.05 0.025 33.96∗∗ Model 3: BNT added 0.27 0.07 0.035 49.24∗∗
Gender 0.001 Gender −0.09∗
Age −0.04 Age 0.02
Education 0.10∗∗ Education 0.10∗∗
BNT 0.17∗∗ BNT 0.20∗∗
Note: ∗
p < .05; ∗∗ p < .001. Note: ∗
p < .05; ∗∗ p < .001.
bined financial decisions (R2change = .015, β = .13) and for The observed predictive power is about as strong as the
medical judgments (R2change = .01, β = .10; see Table 13). meta-analytic estimate of the effect of ibuprofen on pain
Following Cokely et al. (2012) we combined the BNT and reduction (Meyer et al., 2001; Roberts, Kuncel, Shiner,
Schwartz et al.’s (1997) measures together to generate a Caspi, & Goldberg, 2007). It is noteworthy that the rela-
composite BNT-S score (see Figure 6). As would be ex- tionship was observed despite conditions of extreme re-
pected, the BNT-S score showed considerable skew (Fig- striction of range (i.e., the use of very highly educated
ure 6) yet was a robust predictor of superior financial de- samples) and non-ideal measurement conditions (e.g., few
cisions (β = .27; R2 = .07, F (1, 1417) = 108.03, p < .001), criteria). The current findings suggest that the predic-
and medical judgments (β = .24; R2 = .06, F (1, 1417) = tive power of numeracy should tend to be significantly
86.39, p < .001). stronger in more diverse samples (e.g., in the general pop-
ulation, among college students), as found in other studies
(Cokely et al., 2009, 2012). The current results also pro-
4 General discussion vide some of the first evidence that among very highly nu-
merate participants, metacognitive processes continue to
In two large studies conducted with very highly educated partially drive the ability-to-performance relationship (i.e.,
samples, the Berlin Numeracy Test was found to be a ro- deliberation and confidence). These results converge with
bust independent predictor of superior judgment and deci- others indicating that the link between numeracy and su-
sion making across risky decisions, temporal discounting, perior judgment and decision making is not simply a func-
class-inclusion illusions (i.e., denominator neglect), and tion of differences in “doing the math”.
metacognitive judgments (median unique β = .19). The
Berlin Numeracy Test doubled the predictive power of the
well-established test by Schwartz and colleagues (1997), 4.1 Numeracy and metacognition
predicting performance in samples with numeracy scores
that were notably higher than those observed in surgeons As detailed in the introduction, the theoretical construct
and medical students (Garcia-Retamero et al., in press, of numeracy is multifactorial including (1) a practical un-
2014). To put the current observed predictive strength into derstanding of numbers and mathematical procedures, and
perspective, the link between the single predictor BNT and (2) the skills necessary for effective problem solving and
overall task performance is stronger than estimates of the self-regulated learning (e.g., metacognition and thinking
link between gender and observed risk-taking behavior. about thinking; Flavell, 1979; Garofalo & Lester, 1985;Judgment and Decision Making, Vol. 9, No. 1, January 2014 Numeracy and biases in the highly educated 26
Table 10: Proportion of participants who had perfect cal- Figure 5: Levels of numeracy in a Dutch community sam-
ibration or were overconfident at each level of numeracy. ple (n = 1418). Data collected as part of the Dutch Grand
Results of accuracy regressed on confidence at each level National Numeracy Survey.
of BNT are also presented.
40%
38%
Prop. R2
35%
Prop.
BNT perfectly R2 R2 linear
over-
levels cali- linear quadratic − R2
30%
conf.
brated quad.
Percentage of Participants
25%
BNT=1 .32 .29 0.04∗ 0.22∗∗ −0.18 25%
BNT=2 .45 .26 0.07∗∗ 0.18∗∗ −0.11
20%
BNT=3 .56 .16 0.14∗∗ 0.30∗∗ −0.16 19%
18%
BNT=4 .62 .16 0.04∗∗ 0.11∗∗ −0.07
15%
Note: ∗
p < .05; ∗∗ p < .001.
10%
Table 11: Unique predictive power of the two numeracy
5%
tests for predicting risky decisions. Standardized beta co-
efficients presented.
0%
Financial decisions Medical judgments 1 2 3 4
BNT Four Levels
BNT .19∗∗ .19∗∗
Schwartz .13∗∗ .10∗∗
who had a more accurate subjective sense of their judg-
Note: ∗∗
p < .001. ment performance (i.e., estimated confidence) and those
who tended to spend more time deliberating during de-
cision making tended to perform better. While there are
Lucangeli & Cornoldi, 1997; see also Dunlosky & Met- likely many other important metacognitive and numeracy-
calfe, 2009). Numeracy tests appear to predict a wide related skills at work (Peters, 2012; Peters, Meilleur, &
range of behavior because they simultaneously assess both Tompkins, in press; Reyna & Farley, 2006; Reyna et al.,
mathematical knowledge and the metacognitive processes 2009), the current data accord with previous research sug-
involved in effective thinking (Halpern, 1998; Schoenfeld, gesting that deliberation and accurate self-monitoring of-
1992; Schraw, 1998; but for related theory in decision ten play central roles in domain-general superior judgment
making see Baron, 1985, 2008; Baron, Badgio, & Gask- and decision making.17
ins, 1986; Stanovich, 2012; Stanovich, West, & Toplak,
2011; Toplak, West, & Stanovich, in press a, in press
b). For example, in the current studies, we observed links 4.2 Confidence and deliberation
between numeracy, confidence, deliberation, and superior
The relationship between confidence and superior judg-
performance. Because most participants were highly nu-
ment and decision making is well-established (Bruine de
merate, the differences in performance do not likely re-
Bruin et al., 2007), as are the relations between confi-
flect differences in the availability of requisite mathemat-
dence, numeracy, and intelligence (Stankov, 2000). Re-
ical skills. Nearly all participants were numerate enough
search indicates that subjective estimates of confidence
to accurately calculate all expected values, discount rates,
tends to derive from two factors—i.e., self-consistency
and relative proportions. Differences are also unlikely
(e.g., how reliably and quickly a judgment comes to mind)
to reflect variation in levels of short-term motivation or
task goals, as all participants volunteered and logged-on the influence of simple visual aids that eliminate large performance dif-
so they could test their numeracy. Rather than differ- ferences between more and less numerate participants (Garcia-Retamero
ences in goals, motivation, or minimum mathematical un- & Cokely, 2011, 2013, in press; see also Gigerenzer, Gaissmaier, Kruz-
Mickle, Schwartz, Woloshin, 2007, and Peters et al., in press).
derstanding, the observed performance differences appear 17 There are many theories about the causal mechanisms that give rise
to be more metacognitive in nature.16 Those participants to the link between domain-general abilities and superior performance,
as well as many compelling critiques of those theories (Baron, 1985;
16 Appropriate cognitive representations, rather than explicit math Kahneman, 2003, 2011; Reyna at al., 2009; Stanovich & West, 2000,
skills, can also play a role in superior performance, as can be seen with 2008).You can also read