Basics of Atlas Mapping Optimization in the Fergana Valley
←
→
Page content transcription
If your browser does not render page correctly, please read the page content below
E3S Web of Conferences 227, 02003 (2021)                                 https://doi.org/10.1051/e3sconf/202122702003
GI 2021

       Basics of Atlas Mapping Optimization in the
       Fergana Valley
       Kamolakhon Khakimova1,* , Ilhomjon Musaev 2, Akbarjon Khamraliev 2
       1
           FerPI, Department of Geodesy, Cartography and Cadastre, 150100 Fergana, Uzbekistan
       2
           TIIAME, Department of Geodesy and Geoinformatics, 1000000 Tashkent, Uzbekistan

                      Abstract. Thematic maps reflecting the negative or positive impact of
                      natural and anthropogenic environmental factors on human living
                      conditions are of particular importance in modern world ecological and
                      cartographic research. To optimize the ecological situation in the region,
                      including the river regions and oases of Uzbekistan, such ecological
                      mapping involves the creation of atlases of a systematic collection of
                      analytical and synthetic maps. In the world, environmental mapping gives
                      preference to synchronization methods where specific atlas maps are
                      systematically created by interconnecting environmental characteristics,
                      that is, several maps that interactively interact with their didactic texts in
                      GIS software are deployed on a computer screen at the same time. These
                      research programs ArcGIS, QGIS, and SWAT model software focus on
                      database creation, electronic map visualization, modeling, and analytical
                      mapping.
                      Keywords. Ecological Mapping, Digitization, Vectorization, Layers,
                      Themes, Synthetic, Electronic Maps, Modelling.

       1 Introduction
           In the Fergana Valley, pollution of the environment, including air, water, land, by many
       industrial facilities, vehicles and various chemicals, causes great harm to the health of the
       population. Cities can be compared to active volcanoes. Urban industrial enterprises,
       vehicles, and household waste pollute air, water and soil [1].
           Therefore, the main goal of creating an environmental atlas of the Fergana Valley is to
       provide a rich and comprehensive source of information and databases on the
       environmental situation in the Valley, as well as to develop a state environmental policy,
       optimize it and apply it in practice [2]. The ecological situation is unstable and constantly
       changes under the influence of the human factor. Consequently, practical ecological maps,
       nature conservation of territories and cartographic optimization of the natural environment
       are used as the basis for the implementation of the project and strategy, which is intended to
       strengthen environmental education, advocate for the general public and enhance
       environmental culture [3]. Maps of the ecological atlas allow you to visually determine the
       place and time of the ecological state of what happened in the past, at the present time and

       *
           Corresponding author: kamolaxon@mail.ru

© The Authors, published by EDP Sciences. This is an open access article distributed under the terms of the Creative Commons
Attribution License 4.0 (http://creativecommons.org/licenses/by/4.0/).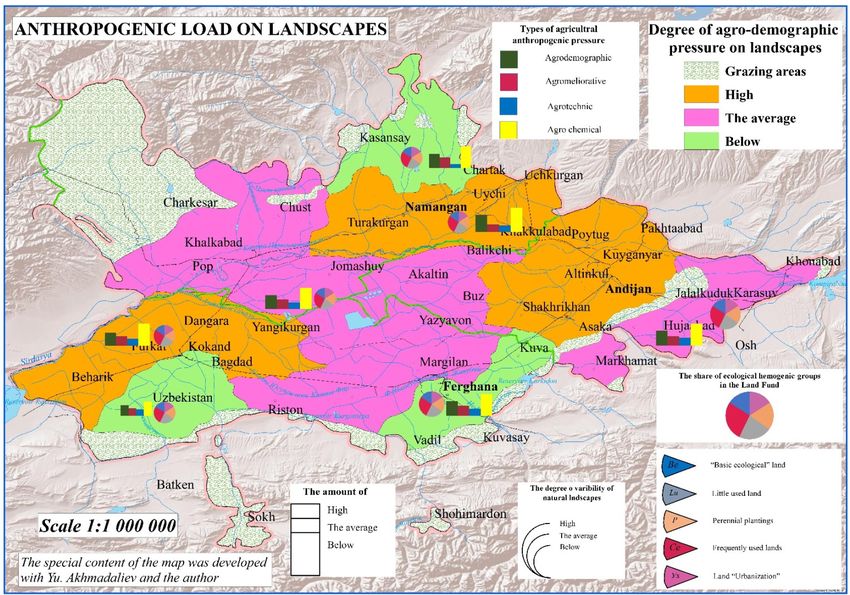
E3S Web of Conferences 227, 02003 (2021)                       https://doi.org/10.1051/e3sconf/202122702003
GI 2021

      which, possibly, will occur in the future, depicting it in color, describing the possibility of
      counteracting this.
          With the help of atlas maps, great opportunities have appeared for showing all the
      changes that occur in nature. Environmental situations are different, they have different
      effects on nature and people in the regions of the republic. Water, soil, atmosphere,
      pollution levels, health impacts and other environmental data cannot be plotted on a single
      map. Therefore, it is necessary to create a complex of maps, that is, an atlas covering all
      areas of ecology. Atlas is a system with specific sets of thematic maps that display human-
      nature interactions, social, natural and man-made elements of society. Therefore, the main
      purpose of mapping is to register and assess the state of the environment [6].
          Environmental atlases include a system of maps dealing with interrelated and
      complementary environmental issues, and also consist of basic base maps of natural and
      socio-economic content. Industry and network maps describe and assess the ecological state
      of certain elements of the environment and represent the environmental problems of various
      industries (such as agriculture, forestry, water management, industry, etc.). The content of
      the ecological atlas maps covers various types of mapping, and also works with many
      objects and events, but among them there are several integrations and syntheses. Maps of
      different types of scientific and practical directions, their inventory, assessment, forecasting
      and combination in content, are shown in different directions, which are characterized by
      their distinctive features.

      2 Methods

      2.1. Study area

         The Fergana Valley is a Valley in Central Asia spread across eastern Uzbekistan,
      southern Kyrgyzstan and northern Tajikistan. (Fig.1.)

      Fig. 1. Map of the study area, Fergana Valley.

         The Fergana Valley is an intermountain depression in Central Asia, between the
      mountain systems of the Tien-Shan in the north and the Gissar-Alai in the south. The
      Valley is approximately 300 kilometers long and up to 70 kilometers wide, forming an area
      covering 22,000 square kilometers. Its position makes it a separate geographic zone. The

                                                       2
E3S Web of Conferences 227, 02003 (2021)                        https://doi.org/10.1051/e3sconf/202122702003
GI 2021

      Valley owes its fertility to two rivers, the Naryn and the Kara Darya, which unite in the
      Valley, near Namangan, to form the Syr Darya.
         The central part of the geological depression that forms the Valley is characterized by
      block subsidence, originally to depths estimated at 6 to 7 kilometers, largely filled with
      sediments that range in age as far back as the Permian-Triassic boundary. Some of the
      sediments are marine carbonates and clays. The faults are up thrusts and over thrusts.
      Anticlines associated with these faults form traps for petroleum and natural gas, which has
      been discovered in 52 small fields. [1]

      2.2. Methods
         Methods of creating an electronic atlas and analysis using modern GIS - programs and
      methods for their creation with a hybrid type of data storage have the most promising
      opportunities. Maps of the ecological atlas allow to display the past, present and future, as
      well as to determine the place and time of the ecological state by depicting them in color,
      which makes it possible to develop measures to protect the components of nature.

                                         I. PREPARATORY WORK

                                              Designing Atlas Maps

                Snap objects by coordinates                          Creating a map program

            Justification based on purpose                     Development of the database

             Development of contents of maps                     Design of a mathematical basis

                            II. CREATION OF ATLAS MAPS AND PUBLICATION

                           The process of work on geographic information system

                                      Development of
              Design layers of
                                       a complex of           Database              Thematic layers
                geographic
                                       conventional          Development             development
                 elements
                                           signs

                                       III. ELECTRONIC DIGITAL MAPS

                 Create different                                                  Preparation of
                 thematic maps                IV. DEVELOPMENT OF                      reports
                                               ATLAS LAYOUT AND
                                               PREPARATION FOR
                Transfer of data to                PUBLICATION                    Publishing maps
                 electronic media                                                    on paper

      Fig. 2. Designing and mapping environmental atlas in a GIS program

                                                       3
E3S Web of Conferences 227, 02003 (2021) https://doi.org/10.1051/e3sconf/202122702003
GI 2021
The object of the study is the environmental atlas of the Fergana region. The subject of
the study is the structure and content of atlas maps reflecting the environmental state of the
Fergana region, developed on the basis of modern GIS technologies. The foundations of
environmental atlas optimization are improved on the basis of maps of "degree of
anthropogenic load on landscapes," demo ecological state "; Improved digital maps
depicting the environmental condition of areas in need of protection in the Fergana region
using TIN (Triangulated irregular network), SHAPE vector file and GRID raster files;
Improved inventory maps using interactive maps as well as the DEM (Digital Elevation
Model).
The cartographic method is most effective in assessing and forecasting environmental
situations in the "Population-nature-society" system (Fig.2). At the same time, in the
ecological atlas created for the first time, along with traditional indicators, a set of
recommendations for the development of ecological culture and a set of measures to
preserve the landscape were used.
The creation of an ecological atlas of the Fergana Valley will have a positive effect in
the future in determining the state of geosystems changing under the intense influence of
human economic activity, in developing a plan of action measures, as well as ensuring
sustainability.
3 Results
The scientific significance of the results of the study is determined by the fact that in
mapping the ecological condition of the Fergana Valley for the first time GIS-technologies
with ArcGIS software, QGIS was used, the structure and content of the ecological atlas of
the Territory were developed, as well as methodological approaches to their creation was
improved.
The structure and draft of the ecological atlas of maps of the Fergana Valley were
developed, on the basis of the geographic information system, moreover, the database
"Ecology of Fergana" and its thematic layers also were developed. According to the
content, the atlas maps are divided into 3 large sections: the reasons for the destruction of
the ecological state; the consequences of environmental degradation; optimization of the
ecological state of the Fergana Valley. Texts and legends were prepared on the maps, which
facilitate the use of the atlas with modern GIS systems (table 1). Content and configuration
changes have been made to reflect the new requirements. The rapidly growing trend in
environmental cartography is highlighted based on new methodological approaches,
assessment criteria and information sources.
Table 1. The structure of the ecological atlas
# Name of map Scale The main content of the maps
Reasons for the destruction of the ecological state
1 Map of anthropogenic 1:1 000 000 Anthropogenic factors are covered by the
factors affecting the scope and measures to improve and
environment protect land resources
2 Pollution map in industrial 1:1 000 000 Industrial centers, the amount of toxic
cities gases emitted from industrial sites is
given
Consequences of ecological degradation
3 Air pollution level map 1:1 000 000 Air pollution level. Shown is the amount
of toxic substances such as dust, gaseous
sulfur, carbon monoxide, nitric oxide,
ammonia, hydrogen sulfide compounds
4 Melioration map (irrigation 1:1 000 000 Newly developed regions, irrigation
4E3S Web of Conferences 227, 02003 (2021) https://doi.org/10.1051/e3sconf/202122702003
GI 2021
networks) agrotechnical measures against deflation
are highlighted. Areas of reclamation
shown
5 Demo-ecological state map 1:1 000 000 The map is a database that provides
anthropogenic pressure on the natural
environment
6 Environmental stress 1:1 000 000 The degree of tension in the ecological
assessment card state in the Fergana Valley, the regions of
the ecological situation; stabilization
Optimization of the ecological state of the Fergana Valley
7 Environmental maps 1:1 000 000 The horizontal range limit is indicated in
the outlines. The distribution of natural
resources that affect human health and the
ecosystem is reflected in the distribution
of territories
8 The degree of anthropogenic 1:1 000 000 The map lists two ecological spaces and
pressure on landscapes economic groups that combine content.
The degree of anthropogenic pressure on
landscapes,
agrodemographic pressure, anthropogenic
pressure on agriculture, ecological gene
groups in the land fund.
9 Environmental protection 1:1 000 000 The degree of variability of natural
map complexes, economic and other human
activities, anthropogenic impact on nature
and its consequences
10 Ecological maps of the 1:25 000 Shown are natural, demographic,
cities of Fergana, Margilan, technogenic, anthropogenic and other
Kuvasoi, Kokand, Andijan indicators of cities, reflecting the
and Asaka ecological state of tension
1. Data from electronic tachometers and GRS devices, imaging equipment, expedition
materials, digital data, copyright originals, existing maps and other source materials were
collected. The cartographic and raw materials were scanned and placed at the same scale as
the raster images, and then placed in memory.
2. The thematic layers of the ecological atlas maps and their tables were compiled, they
were analyzed using the Fergana Valley GIS programs, and a database was created.
3. Classifications of objects, existing tables (attributes) and text data were included in
the computer memory.
4. A system of conventional symbols has been developed.
5. The thematic map layers were loaded and cartographic images were created, which
were edited separately.
6. The layout of the map has been developed and refined for preparation for publication
(Fig.3).
A cartographic base has been prepared for the creation, analysis of thematic layers of
the models of the ecological atlas of the Fergana Valley and their drawings, as well as for
the creation of a database and a map. Cartographic bases were developed from general
geographic elements - the foundations of cartographic and aerospace materials from
elements of mathematical foundations (relief, land users, soil cover, settlements, roads,
borders) in accordance with the scale and projection of the map.
Creation and use of a multimedia ecological atlas of the Fergana Valley is intended to
create a digital model of the valley through a raster image of the valley depression, create a
three-dimensional 3D model of electronic ecological atlas maps, visualization and ways of
5E3S Web of Conferences 227, 02003 (2021) https://doi.org/10.1051/e3sconf/202122702003
GI 2021
using it in environmental protection. They were analyzed on the basis of GIS technology,
methods of indexing space data and through the preparation of forecast and assessment
maps, the monitoring methodology was improved.
ArcGIS geographic information mapping and QGIS-based software use the latest GIS
database designs from raw data. The created system allows to solve the following tasks:
collection and processing of databases; obtaining statistical information about the
parameters of the content structure of any cartographic layer; search for objects by their
attributes, plotting them on top of each other for comparative analysis; simultaneous
viewing of the state of the territory in several layers using mathematical - cartographic
modeling; the use of various imaging techniques, the technique of automatic mapping.
(Fig.4.)
The latter method of using atlas maps can be shown with hypsometric color or coloring,
which improves the readability of the shadows. Hypsometric staining is a set of colors used
to provide additional information about the height of a shaded map. Thus, the ability to
visualize the overall elevation height has been increased.
The above basic hill shade capabilities are available in almost all GIS software
packages, but more advanced techniques are available in Adobe Photoshop.
Triangulated irregular network (TNT), SHAPE vector files, and GRID raster files are
based on the vector data of this area and can often be used to describe concepts that can be
referenced to a surface or generally oriented to a surface. There are many adjacent triangles,
called TNT surfaces that do not collide with each other and they have created electronic
maps of the environmental atlas from numerous points using the Delacney method.
Some 3D visualizations only allow one person to explore. For example, in some vertical
real-time systems, the display may be viewed by a device and used by only one person.
Other devices allow multiple people to view the display at the same time and directly lead a
discussion (for example, CAVE software, which can accommodate multiple people.
The most important aspect of 3D visualization is the use of cartographers to create such
visualizations that can be generalized using existing abstracts (for example, geometric
shapes of objects) or high-level realities (for example, cities with mountains, trees, and
streams filled with movement) (Fig.5)
The use of geoinformation technologies in the field of ecological and geographical
research is the basis of the dissertation. The analysis of existing resources and capabilities
of automated processing of environmental and geographical data and the results of creating
digital electronic maps. The Environmental Atlas is a basic and convenient visual resource
for assessing and predicting the state of the environment.
6E3S Web of Conferences 227, 02003 (2021) https://doi.org/10.1051/e3sconf/202122702003
GI 2021
Fig. 3. Environmental map of the Fergana Valley
7E3S Web of Conferences 227, 02003 (2021) https://doi.org/10.1051/e3sconf/202122702003
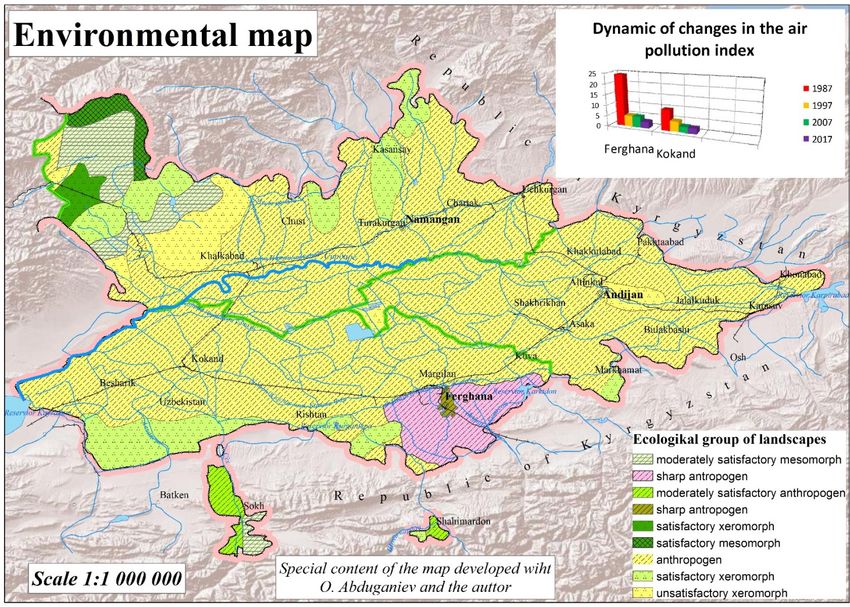
GI 2021
Fig. 4. Map of anthropogenic load on landscapes Fergana Valley
8E3S Web of Conferences 227, 02003 (2021) https://doi.org/10.1051/e3sconf/202122702003
GI 2021
Fig. 5. 3D rendering of ecological map
9E3S Web of Conferences 227, 02003 (2021) https://doi.org/10.1051/e3sconf/202122702003
GI 2021
4 Discussion and conclusion
The scientific significance of the research results is determined by the fact that when
mapping the ecological state of the Fergana Valley, for the first time, GIS technologies with
the ArcGIS and QGIS software were used, the structure and content of the ecological atlas
of the territory were developed, and methodological approaches were improved in their
creation.
The practical significance of the research results is determined primarily in the use of
the above methods in the development of targeted government programs and practical
measures to improve the environmental situation on the basis of conclusions and
recommendations, thematic assessments and inventory maps.
Based on the study, the following main conclusions were drawn:
1. The experience of creating environmental atlases is improving every year. The
methodological developments associated with the theory and practice of creating
atlases are not so great. Modern ecological atlases, created at the present time, are
characterized by the fact that they are based on a systemic principle for updating and
processing geographic information, as well as on the necessary adaptive functions.
2. Proposals are given on the use of a systematic approach in mapping the nature and
ecological state of the Fergana Valley, which made it possible to create a series of
analytical and synthetic ecological maps.
3. Development of the composition and content of the ecological atlas using ArcGIS,
QGIS and the SWAT model allowed the creation of an ecological database. It is
proved that simplified and improved cartographic sources, consisting of several layers
and obtained during the creation of maps of the ecological atlas, are the basis for the
creation of other maps.
4. The use of geo-innovative technologies in atlas mapping will lead to a decrease in
labor costs and time, and an increase in the accuracy of the work performed. At the
same time, proposals for software, mathematical basis, layout layout, and projection,
generalization of visualized maps of the ecological atlas using ArcGIS, QGIS and
SWAT modeling programs based on data characterizing the ecological state of the
Fergana Valley were developed and given.
5. The use of imitations of the inventory of space data based on the objectivity and
practical orientation of information with the interpretation of images and aerospace
images of the atlas, made it possible to create interactive maps.
6. Of particular importance is an operational database of information on geodesy,
cartography and cadastres in the shortest possible time with monitoring of the
environmental situation and operational information in emergency situations, as well
as providing timely access to updated information on the environmental state of the
region.
7. When modeling in a GIS suite of commonly used map servers using internal or
additional tools, the raster and vector data model made it possible to transform the
field in which the spatial distribution of events in the Fergana Valley changes. This
database serves as an important source for obtaining relevant scientific conclusions,
assessing situation, monitoring, and identification of priority areas for the future.
8. The use of GIS technologies in the field of ecological-geographical research and the
use of three-dimensional 3D automated methods for processing existing resources and
ecological-geographical data in the development of content on this basis of ecological
atlas maps, synchronization of maps is proposed.
9. In order to develop assessment and recommendation maps with cartometric indicators
of the ecological state of protected areas in the Fergana Valley, proposals and
10E3S Web of Conferences 227, 02003 (2021) https://doi.org/10.1051/e3sconf/202122702003
GI 2021
recommendations on the trend of planning, assessing and taking into account the
environmental impact are given.
10. Ecological atlas of the Fergana Valley and its practical thematic ecological maps will
serve as a basis for assessing the ecological situation, nature conservation and rational
use of natural resources, as well as optimization of the ecological situation.
The authors wish to thank the "Uzdavyerloyiha" Scientific-Design Institute of Fergana branch and
the Joint Research Center of GeoInformatics at TIIAME for constant encouragement and necessary
support as well as data used in this research and within the framework of the research plan of the
applied project I-8-20 "Creation of the National Atlas of the Republic of Uzbekistan". We also thank
the anonymous reviewers for their valuable comments and suggestions.
References
1. S. Musayev, J. Mellor, I. Musaev, М. Nuretdinova. Impact of climate uncertainties on
agriculture in Fergana Valley of Uzbekistan. Intl J. Innovative research in a
multidisciplinary field. 86.87, 85-91 (2019)
2. S. Musayev, Е. Burgess, J. Mellor. A global performance assessment of rainwater
harvesting under climate change. Conservation, and Recycling. 132, 62-70 (2018)
3. A. Marupov, A. Abdurahmanov, B. Ahmedov. Main Ways to Improve the Efficiency
of Agricultural Land Use in the Fergana Valley Sample. Intl J. Advanced Research in
Science, Engineering and Technology. October 6-10, 11211-11215 (2019)
4. K. Khakimova, A. Marupov, G. Mirzakarimova. Maintaining Cadastral Valuation for
the Effective Use of Agricultural Lands of the Fergana Region. Intl J. Advanced
Research in Science, Engineering and Technology. October 6-10, 11022-11026 (2019)
5. D. Eshnazarov, M. Nuretdinova, S. Ibrokhimova, M. Abdukadirova. Ways and
bargaining methods of geodescents in regional systems of the statecadastre of the
Republic of Uzbekistan. Intl J. Research Culture Society. October 3-10, 41-44 (2019)
6. K. Khakimova. Special issues of correction of the map of nature protection of Fergana
region (Farg'ona viloyati tabiatini muxofaza kilish kartasini tuzatishning alohida
masalalari). Inf. Geo. Soc. Uzb., 6, 199-202 (2010)
7. A. Egamberdiev, K. Khakimova. Atlases are unique cartographic encyclopedias
(Atlaslar - uziga xos kartografik entsiklopediyalar). Inf. Geo. Soc. Uzb., 6, 226-227
(2015)
8. A. Egamberdiev, Sh. Prenov, K. Khakimova. History, modern state and current
problems of cartography development in Uzbekistan (История, современное
состояние и актуальные проблемы развития картографии в Узбекистане). Inf.
Geo. Soc. Uzb., 6, 219-222 (2017)
9. M. Egamberdieva, K. Khakimova, R. Maxamadaliev. Changes in the structure of cities
of Uzbekistan during the years of independence (Mustaqillik yillarida O'zbekiston
shaharlari tarkibiidagi o'zgarishlar). News of the NUU, 7, 389-391 (2017)
10. K. Khakimova, E. Safarov. The Main Theoretical and Methodological Provisions of
the Educational Geoinformation System. Eur. Sci. Rev. Austria.Vienna, 7, 70-71
(2018)
11. K. Khakimova, R. Maxamadaliev, Kh. Manopov. Development of maps for studying
nature conservation and rational use of natural resources in the Fergana Valley
(Разработка карт для изучения охраны природы и рационального
11E3S Web of Conferences 227, 02003 (2021) https://doi.org/10.1051/e3sconf/202122702003
GI 2021
природопользования в Ферганской долине). Inf. Geo. Soc. Uzb. Special issue 6,
152-154 (2018)
12. A. Hamidov. Geoecological significance of natural geographical research in the
Fergana Valley. Modern geography: theory and practice (Int. Sci. Pra. Conf., Tashkent.
92-95, 2006)
13. K. Khakimova. Some issues of creating an ecological atlas of Fergana region. The role
of women scientists in the development of science and technology. Materials of the
Republican scientific-practical conference. 448-449 (2006)
14. K. Khakimova, M. Egamberdieva, D. Eshnazarov. The use of GIS - technologies for
creating electronic ecological maps (Использование ГИС – технологий для
создания электронных экологических карт). Inf. Geo. Soc. Uzb. Special issue 6,
158-160 (2018)
15. A. H. Robinson, J. L. Morrison, P. C. Muehrcke. Elements of Cartography. John
Willey & Sons, USA, 674 (1995)
16. J. Bertin. Semiology of Graphic: Diagrams, Networks, Maps. University of Wisconsin
Press, Madison (1983)
17. P. Wiegand. Learning and Teaching with Maps, Taylor & Francis, London: Routledge,
180 (2006)
18. P. Hurst, P. Clough. Will We Be Lost without Paper Maps in the Digital Age? J. Inf.
Sci. 39, 48–60 (2013)
19. W. Johnson, H. Jellinek, L. Klotz Jr, R. Rao, and S. K. Card. Bridging the Paper and
Electronic Worlds: The Paper User Interface.” INTERACT’93 and CHI’93 Conference
on Human Factors in Computing Systems, Amsterdam, April 24–29 (1993)
20. K. Ooms, P. Maeyer, L. Dupont, N.V. Veken, N.V. Weghe, S. Verplaetse. Education
in cartography: what is the status of young people’s map-reading skills? Car. GIS,
43:2, 134-153 (2015)
12You can also read