Climate network and complexity based El Ni no forecast for 2021
←
→
Page content transcription
If your browser does not render page correctly, please read the page content below
Climate network and complexity based El Niño
                                                                  forecast for 2021
                                                                     Josef Ludescher1 , Jun Meng2,1 , and Jingfang Fan3,1
                                                                  1
                                                                    Potsdam Institute for Climate Impact Research, 14412 Potsdam, Germany
                                                    2
                                                        School of Science, Beijing University of Posts and Telecommunications, Beijing 100876, China
                                                               3
                                                                 School of Systems Science, Beijing Normal University, 1000875 Beijing, China
arXiv:2102.02192v1 [physics.ao-ph] 3 Feb 2021

                                                                                                 Abstract
                                                            The El Niño Southern Oscillation (ENSO) is the most important driver of interannual
                                                        climate variability and can trigger extreme weather events and disasters in various parts of
                                                        the globe. Recently, we have developed two approaches for the early forecasting of El Niño.
                                                        The climate network-based approach allows forecasting the onset of an El Niño event about 1
                                                        year ahead [1]. The complexity-based approach allows additionally to forecast the magnitude
                                                        of an upcoming El Niño event in the calendar year before [2]. Here we communicate the
                                                        forecasts of both methods for 2021. The methods indicate a high probability (about 89% and
                                                        90%, respectively) for the absence of an El Niño in 2021.

                                                1       The El Niño Southern Oscillation
                                                The El Niño-Southern Oscillation (ENSO) phenomenon [3–9] can be perceived as a self-organized
                                                dynamical see-saw pattern in the Pacific ocean-atmosphere system, featured by rather irregular
                                                warm (“El Niño”) and cold (“La Niña”) excursions from the long-term mean state. The ENSO
                                                phenomenon is quantified by the Oceanic Niño Index (ONI), which is based on the average sea-
                                                surface temperature (SST) in the Niño3.4 region in the Pacific (see Fig. 1).
                                                     The ONI is defined as the three-month running-mean SST anomaly in the Niño3.4 region and
                                                is a principal measure for monitoring, assessing and predicting ENSO. We will refer to the ONI
                                                also as the Niño3.4 index. An El Niño episode is said to occur when the index is at least 0.5°C
                                                above the climatological average for at least 5 months. A regularly updated table of the ONI can
                                                be found at [10].
                                                     Since strong El Niño episodes can wreak havoc in various parts of the world (through extreme
                                                weather events and other environmental perturbations) [9, 12–16], early-warning schemes based
                                                on robust scientific evidence are highly desirable. Sophisticated global climate models taking into
                                                account the atmosphere-ocean coupling, as well as statistical approaches like the dynamical systems
                                                schemes approach, autoregressive models and pattern-recognition techniques, have been proposed
                                                to forecast the pertinent index with lead times between 1 and 24 months [4, 17–36].
                                                     Unfortunately, so far, the forecasting methods in operation have quite limited anticipation
                                                power. In particular, they generally fail to overcome the so-called “spring barrier” (see, e.g.,
                                                [37, 38]), which shortens their warning time to around 6 months.
                                                     To resolve this problem, we have recently introduced two alternative forecasting approaches
                                                [1, 2], which considerably extend the probabilistic prediction horizon. The first approach [1] (see
                                                also [39]) is based on complex-networks analysis [40–45]. The method provides forecasts for the
                                                onset of an El Niño event, but not for its magnitude, in the year before the event starts. The second
                                                approach [2] relies on the System Sample Entropy (SysSampEn), i.e., an information entropy, in
                                                the Niño3.4 area. It provides forecasts for the onset and magnitude of an El Niño event at the end
                                                of the foregoing year. Both methods predict the absence of an El Niño event in 2021 with roughly
                                                90% probability. In the following Sections, we describe the methods and their forecasts.

                                                                                                     1
Figure 1: The ONI and the “climate network”. The network consists of 14 grid points in the
“El Niño basin” (solid red symbols) and 193 grid points outside this domain (open symbols). The
red rectangle denotes the area where the ONI (Niño3.4 index) is measured. The grid points are
considered as the nodes of the climate network that we use here to forecast El Niño events. Each
node inside the El Niño basin is linked to each node outside the basin. The nodes are characterized
by their surface air temperature (SAT), and the link strength between the nodes is determined
from their cross-correlation (see below). Figure from [1].
2 Climate network-based forecasting
2.1 The network-based forecasting algorithm
The climate network-based approach exploits the remarkable observation that a large-scale coop-
erative mode linking the “El Niño basin” (i.e., the equatorial Pacific corridor) and the rest of the
Pacific ocean (see Fig. 1) builds up in the calendar year before an El Niño event. An appropriate
measure for the emerging cooperativity can be derived from the time evolution of the telecon-
nections (“links“) between the atmospheric temperatures at the grid points (”nodes“) inside and
outside of the El Niño basin. The strengths of those links are represented by the values of the
respective cross-correlations (for details, see [1, 39]). The crucial entity is the mean link strength
S(t) as obtained by averaging over all individual links in the network at a given instant t [1, 39].
S(t) rises when the cooperative mode builds up and drops again when this mode collapses rather
conspicuously with the onset of the El Niño event. The rise of S(t) in the year before an El Niño
event starts serves as a precursor for the event.
For the sake of concrete forecasting, we employed in [1] daily surface air temperature (SAT)
anomalies for the 1950-2011 period. The data have been obtained from the National Centers for
Environmental Prediction/National Center for Atmospheric Research Reanalysis I project [46, 47].
The optimized algorithm [1, 39] involves an empirical decision threshold Θ. Whenever S crosses Θ
from below while the most recent ONI is below 0.5°C, the algorithm sounds an alarm and predicts
an El Niño inception in the following year. For obtaining and testing the appropriate thresholds,
we divided the data into two halves. In the first part (1950-1980), which represents the learning
phase, all thresholds above the temporal mean of S(t) were considered and the optimal ones, i.e.,
those that lead to the best predictions in the learning phase, have been determined. We found
that Θ-values between 2.815 and 2.834 lead to the best performance [1], with a false alarm rate of
1/20. In the second part of the data set (1981-2011), which represents the prediction (hindcasting)
phase, the performance of these thresholds has been tested. We found that the thresholds between
2.815 and 2.826 gave the best results (see Fig. 2, where Θ = 2.82). The alarms were correct in 75%
and the non-alarms in 86.4% of the cases. For Θ-values between 2.827 and 2.834, the performance
was only slightly weaker. We like to note that for all calculations in the prediction phase, e.g., of
the climatological average, only data from the past up to the prediction date have been considered.
2S
3.5 2
NINO3.4 [°C]
3 1
Θ
0
2.5
-1
2
1981 1985 1990 1995 2000 2005 2010
Year
Figure 2: The network-based forecasting scheme (hindcasting phase). We compare the average
link strength S(t) in the climate network (red curve) with a decision threshold Θ (horizontal line,
here Θ = 2.82), (left scale), and the standard Niño3.4 index (ONI), (right scale), between January
1981 and December 2011. When the link strength crosses the threshold from below, and the last
available ONI is below 0.5°C, we give an alarm and predict that an El Niño episode will start in
the following calendar year. The El Niño episodes (when the Niño3.4 index is at or above 0.5C
for at least 5 months) are shown by the solid blue areas. Correct predictions are marked by green
arrows and false alarms by dashed arrows. Between 1981 and 2011, there were 9 El Niño events.
The algorithm generated 8 alarms, and 6 were correct. In the whole period between 1981 and
December 2020, there were 11 El Niño events. The algorithm generated 11 alarms and 8 of these
were correct.
2.2 Forecasting the next El Niño (2011 - present)
Based on this hindcasting capacity, the approach has already been used in [48] to extend the
prediction phase from the end of 2011 until November 2013 and later in [39] until October 2019. We
like to emphasize that in the forecasting phase, the algorithm does not contain any fit parameters
since the decision thresholds are fixed and the mean link strengths only depend on the atmospheric
temperature data.
Eight out of nine real predictions into the future for the years 2012-2020 turned out to be
correct (see Fig. 3). These predictions were not trivial. For example, as late as August 2012, the
Climate Prediction Center/International Research Institute for Climate and Society (CPC/IRI)
Consensus Probabilistic ENSO forecast yielded a 3 in 4 likelihood for an El Niño event in 2012,
which turned out to be incorrect only a few months later [10,11]. In contrast, the network approach
already forecasted the absence of an El Niño at the end of 2011. In 2013, our algorithm predicted
the return of an El Niño event in 2014, since, in September 2013, S(t) transgressed the alarm
threshold band while the last available ONI (JJA 2013) was below 0.5°C, indicating the return of
El Niño in 2014 (see Fig. 3). This early prediction was also correct: The El Niño event started in
November 2014 (and ended in May 2016) [10]. For comparison, the furthest into the future (ASO
2014) IRI/CPC plume forecast probabilities in December 2013 were 46% for a neutral event, 44%
for an El Niño, and 10% for a La Niña. In 2014, 2015, 2016 and 2018, S(t) did not cross the
threshold from below, thus indicating the absence of an El Niño onset in the respectively following
years, which all turned out to be correct (see Fig. 3). In November 2017, S(t) transgressed from
below the lower threshold band between S = 2.815 and 2.826. Since the last ONI, for ASO 2017,
was below 0.5°C (-0.4°C), this indicated the return of El Niño in 2018 (see Fig. 3), which turned
out to be correct.
In September 2019, S(t) transgressed all thresholds, while the last ONI, JJA 2019, was below
0.5°C (0.3°C). This indicated the onset of an El Niño in 2020 with 80% probability. This prediction
turned out to be incorrect since in 2020 a La Niña started. This was the first forecast error of the
method and the first hindcast of forecast error since 2009 when the method missed the 2009/10
3S
3.5 2
ONI [°C]
3 1
0
2.5
-1
2
2011 2012 2013 2014 2015 2016 2017 2018 2019 2020
Figure 3: The climate network-based forecasting phase. Same as Fig. 2 but for the period between
January 2011 and December 2020. Throughout 2020 the average link strength S(t) stayed above
the threshold, i.e., no alarm for an El Niño in 2021 was given. In the hindcasting and forecasting
phase (1981-2019), our algorithm predicted 28 times (25 of which were correct) the absence of an
El Niño onset. Thus the likelihood based on the past performance of the climate network approach
for the absence of an El Niño in 2021 is 89%.
El Niño.
Before coming to the forecast for the next year, let us discuss the probability that the same or a
better outcome could be obtained by simply guessing using the climatological El Niño probabilities.
In the 71 years between 1950 and 2020, 23 El Niños have started. Accordingly, the probability
that an El Niño starts in a certain year is 23/71. The probability to correctly forecast the El
Niño onsets or their absences between 2012 and 2020 (the forecasting phase) is, therefore, p =
(23/71)2 (48/71)7 ≈ 0.00677 and having 8 out of 9 correct forecasts with one false alarm p =
7(23/71)3 (48/71)6 ≈ 0.0227. Thus the probability for obtaining the same or a better forecast
result by random guessing is p ≈ 0.029, well below the significance level 0.05. Similarly, the
probability that in the whole hindcasting and forecasting period, between 1982 and 2020, random
guessing would yield an equal or better forecasting performance than our algorithm is p ≈ 5.8· 10−5 .
In 2020 S(t) stayed above the threshold throughout the year (see Fig. 3), thus predicting the
absence of an El Niño in 2021 with 89% probability. We like to note that in the entire past where
outside of an ongoing El Niño episode, a correct prediction for the absence of an El Niño onset
was made, in 19 out of 22 cases, S(t) was below the threshold at the end of the year. Thus 2020
does not represent the typical case.
3 System Sample Entropy-based forecast
3.1 SysSampEn
The SysSampEn was introduced in [2] as an analysis tool to quantify the complexity (disorder) in
a complex system, in particular, in the temperature anomaly time series in the Niño3.4 region. It
is a generalization of sample entropy (SampEn) and Cross-SampEn [49]. SampEn was introduced
as a modification of approximate entropy [50, 51]. It measures the complexity related to the
Kolmogorov entropy [52], the rate of information production, of a process represented by single
time series. The Cross-SampEn was introduced to measure the degree of asynchrony or dissimilarity
between 2 related time series [49, 53]. Both have been widely used in physiological fields, however,
a complex system such as the climate system is usually composed of several related time series
(e.g., curves in Fig. 4). Therefore, the SysSampEn [2] was introduced as a measure of the system
complexity, to quantify simultaneously the mean temporal disorder degree of all of the time series
in a complex system and the asynchrony among them. Specifically, it is approximately equal to
the negative natural logarithm of the conditional probability that 2 subsequences similar (within a
certain tolerance range) for m consecutive data points remain similar for the next p points, where
the subsequences can originate from either the same or different time series (e.g., black curves in
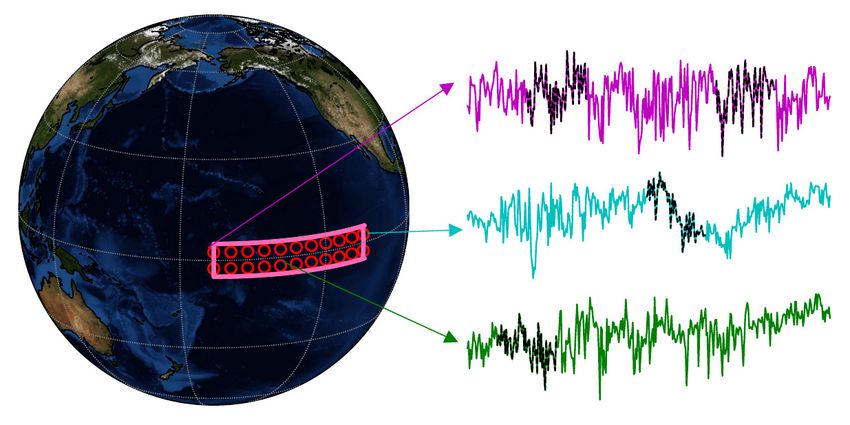
4Figure 4: The Niño3.4 area and the SysSampEn input data. The red circles indicate the 22 nodes in
the Niño 3.4 region with a spatial resolution of 5 × 5 . The curves are examples of the temperature
anomaly time series for 3 nodes in the Niño 3.4 region for one specific year, and several examples
of their subsequences are marked in black. Figure from [2].
Fig. 4), that is,
A
SysSampEn(m, p, lef f , γ) = −log( ), (1)
B
where A is the number of pairs of similar subsequences of length m + p, B is the number of pairs
of similar subsequences of length m, lef f ≤ l is the number of data points used in the calculation
for each time series of length l , and γ is a constant which determines the tolerance range. The
detailed definition of SysSampEn for an arbitrary complex system composed of N time series is
described in detail in [2]. When N = 1, p = 1, and lef f = l, the definition is equivalent to the
classical SampEn [49].
As is the case for SampEn and Cross-SampEn, before the SysSampEn can be used as an effective
tool, appropriate parameter values have to be identified since only certain value combinations
can be used to estimate a system’s complexity with considerable accuracy. The method how to
choose parameter values, which yield to a high accuracy when estimating a system’s complexity,
is described in detail in [2]. We like to note that identifying the parameters, which yield to a high
accuracy, is fully independent of any El Niño magnitude analysis or forecasts. In [2], it was found
the previous year’s (y − 1) SysSampEn exhibits a strong positive correlation (r = 0.90 on average)
with the magnitude of an El Niño in year y when parameter combinations are used that are able
to quantify a system’s complexity with high accuracy.
The linear relationship between SysSampEn and El Niño magnitude enables the prediction of
the magnitude of an upcoming El Niño when the current (y − 1) SysSampEn is inserted into the
linear regression equation between the two quantities. If the result is below 0.5C, the absence of
an El Niño is forecasted. In other words, SysSampEn values below a certain threshold forecast the
absence of an El Niño onset in the following year. Also, an El Niño onset for the following year is
only forecasted if the ONI in December of the current year is below 0.5°C and the SysSampEn is
above a certain threshold.
3.2 Forecast for 2021
Here we use as input data the daily near-surface (1000 hPa) air temperatures of the ERA5 reanalysis
from the European Centre for Medium-Range Weather Forecasts (ECMWF) [54] analysed at a 5
resolution. The most recent months (Nov-Dec) in 2020 are from the initial data release ERA5T,
which in contrast to ERA5, only lags a few days behind real-time. We preprocess the daily time
series by subtracting the corresponding climatological mean and then dividing by the climatological
standard deviation. We start in 1984 and use the previous years to calculate the first anomalies.
52
ONI ( C)
0
-2
1985 1990 1995 2000 2005 2010 2015 2020
Year
Figure 5: Forecasted and observed El Niño magnitudes. The magnitude forecast is shown as the
height of rectangles in the year when the forecast is made, i.e., one year ahead of a potential
El Niño. The forecast is obtained by inserting the regarded calendar year’s SysSampEn value
into the linear regression function between SysSampEn and El Niño magnitude. To forecast the
following year’s condition, we use the ERA5 daily near-surface (1000 hPa) temperatures with the
set of SysSampEn parameters (m = 30, p = 30, γ = 8 and lef f = 330), which were obtained in [2].
The red curve shows the ONI and the red shades indicate El Niño periods. The blue rectangles
show the correct prediction of an El Niño in the following calendar year. The absence of an El Niño
onset in the following year is predicted if the forecasted magnitude is below 0.5C or if the current
year’s December ONI is ≥ 0.5C. White dashed rectangles show correct forecasts for the absence of
an El Niño. Grey bars with a violet border show false alarms. The pink rectangle shows the missed
El Niño event 2009/10. There were 10 occurrences of low SysSampEn accompanied by a low ONI
in December, as is the case in 2020 (green rectangle). In 9 out of these 10 cases, the hindcast was
correct. Thus the method predicts with 90% probability the absence of an El Niño in 2021.
For the calculation of the climatological mean and standard deviation, only past data up to the
year of the prediction are used. For simplicity, leap days are excluded. We apply for the ERA5
data the same parameter combination for the SysSampEn as in [2]: m = 30, p = 30, γ = 8 and
lef f = 330.
Figure 5 shows the results of the analysis. The magnitude forecast is shown as the height of
rectangles in the year when the forecast is made, i.e., one year ahead of a potential El Niño. The
forecast is obtained by inserting the regarded calendar year’s SysSampEn value into the linear
regression function between SysSampEn and El Niño magnitude. The regression function for
the 2021 forecast is obtained from the best linear fit between the two quantifies for all correctly
hindcasted El Niño events before 2020. The red curve shows the ONI and the red shades indicate
El Niño periods. The blue rectangles show the correct prediction of an El Niño in the following
calendar year and grey rectangles with a violet border show false alarms. There are 13 cases where
the forecasted magnitude is above 0.5C while the ONI in December is below 0.5C, 9 of these cases
are followed by an El Niño, while the remaining 4 cases are false alarms. White dashed rectangles
show correct forecasts for the absence of an El Niño. Only one El Niño event was missed, 2009/10,
shown as a pink rectangle. There were 10 occurrences of low SysSampEn accompanied by a lower
than 0.5C ONI in December. In 9 out of these 10 cases, the hindcast was correct. The forecasted
magnitude for 2021 is far below 0.5C, as shown by the green rectangle. The SysSampEn value
for 2020 is 0.717, i.e., well below the threshold value of 1.35. Thus the method predicts with 90%
probability the absence of an El Niño in 2021.
6Acknowledgements
We thank the East Africa Peru India Climate Capacities (EPICC) project, which is part of the
International Climate Initiative (IKI). The Federal Ministry for the Environment, Nature Conser-
vation and Nuclear Safety (BMU) supports this initiative on the basis of a decision adopted by the
German Bundestag.
References
[1] Ludescher J, Gozolchiani A, Bogachev MI, Bunde A, Havlin S, Schellnhuber HJ (2013) Im-
proved El Niño forecasting by cooperativity detection. Proc Natl Acad Sci USA 110:11742-
11745; ibid. doi:10.1073/pnas.1317354110.
[2] Meng J, Fan J, Ludescher J, Ankit A, Chen X, Bunde A, Kurths J, Schellnhuber HJ (2019)
Complexity based approach for El Niño magnitude forecasting before the spring predictability
barrier. Proc Natl Acad Sci USA, 117:177-183; idid. doi:10.1073/pnas.1917007117.
[3] Dijkstra HA (2005) Nonlinear Physical Oceanography: A Dynamical Systems Approach to the
Large-Scale Ocean Circulation and El Niño (Springer, New York).
[4] Clarke AJ (2008) An Introduction to the Dynamics of El Niño and the Southern Oscillation
(Elsevier Academic Press, London).
[5] Sarachik ES, Cane MA (2010) The El Niño-Southern Oscillation Phenomenon (Cambridge
University Press, Cambridge).
[6] Power S, Delage F, Chung C, Kociuba G, Keay K (2013) Robust twenty-first-century projec-
tions of El Niño and related precipitation variability. Nature 502:541-545.
[7] Wang C, et al. (2017) El Niño and Southern Oscillation (ENSO): A review, in: Coral Reefs
of the Eastern Tropical Pacific, eds Glymn PW, Manzello D, Enochs IC (Springer, Berlin).
[8] Timmermann A, et al. (2018) El Niño-Southern Oscillation complexity. Nature 559:535-545.
[9] McPhaden MJ, Santoso A, Cai W (Eds.) (2020) El Niño Southern Oscillation in a Changing
Climate (John Wiley & Sons, Hoboken).
[10] National Oceanic and Atmospheric Administration, Climate Prediction Center.
https://origin.cpc.ncep.noaa.gov/products/analysis monitoring/ensostuff/ONI v5.php
[11] International Research Institute for Climate and Society, Earth Institute.
https://iri.columbia.edu/our-expertise/climate/forecasts/enso/current/
[12] Davis M (2001) Late Victorian Holocaust: El Niño Famines and the Making of the Third
World (Verso, London & New York).
[13] Wen C (2002) Impacts of El Niño and La Niña on the cycle of the East Asian winter and
summer monsoon. Chin J Athmos Sci 26:359-376.
[14] Kovats RS, Bouma MJ, Hajat S, Worrall E, Haines A (2003) El Niño and health. Lancet
362:1481–1489.
[15] Donnelly JP, Woodruff JD (2007) Intense hurricane activity over the past 5,000 years con-
trolled by El Niño and the West African monsoon. Nature 447:465-468.
[16] Corral A, Ossó A, Llebot JE (2010) Scaling of tropical-cyclone dissipation. Nature Phys 6:693-
696.
[17] Cane MA, Zebiak SE, Dolan SC (1986) Experimental forecasts of El Niño. Nature 321:827-832.
[18] Latif M et al. (1994) A review of ENSO prediction studies. Clim Dyn 9:167-179.
7[19] Penland C und Sardeshmukh PD (1995) The optimal growth of tropical sea surface tempera-
ture anomalies. J Clim 8:1999-2024.
[20] Tziperman E, Scher H, Zebiak SE, Cane MA (1997) Controlling Spatiotemporal Chaos in a
Realistic El Niño Prediction Model. Phys Rev Lett 79:1034-1037.
[21] Kirtman BP, Schopf PS (1998) Decadal Variability in ENSO Predictability and Prediction. J
Clim 11:2804-2822.
[22] Landsea CW, Knaff JA (2000) How much skill was there in forecasting the very strong 1997-98
El Niño? Bull Amer Meteor Soc 81:2107-2119.
[23] Fedorov AV, Harper SL, Philander SG, Winter B, Wittenberg A (2003) How Predictable is
El Niño? Bull Amer Meteor Soc 84:911-919.
[24] Galanti E, Tziperman E, Rosati A, Sirkes Z (2003) A Study of ENSO Prediction Using a
Hybrid Coupled Model and the Adjoint Method for Data Assimilation. Mon Weather Rev
131:2748-2764.
[25] Kirtman BP (2003) The COLA anomaly coupled model: Ensemble ENSO prediction. Monthly
Weather Review 131:2324-2341.
[26] Chen D, Cane MA, Kaplan A, Zebiak SE, Huang D (2004) Predictability of El Niño over the
past 148 years. Nature 428:733-736.
[27] Müller P, von Storch H (2010) Computer modelling in atmospheric and oceanic sciences:
Building Knowledge (Springer, Berlin).
[28] Palmer T, Hagedorn R (2006) Predictability of Wheather and Climate (Cambridge Univ Press,
Cambridge, UK).
[29] Chen D, Cane MA (2008) El Niño prediction and predictability. J Comput Phys
227:3625–3640.
[30] Luo JJ, Masson S, Behera SK, Yamagata T (2008) Extended ENSO predictions using a fully
coupled ocean-atmosphere model. J Clim 21(1):84-93.
[31] Yeh SW et al. (2009) El Niño in a changing climate. Nature 461:511-514.
[32] Chekroun MD, Kondrashov D, Ghil M (2011). Predicting stochastic systems by noise
sampling, and application to the El Niño-Southern Oscillation. Proc Nat Acad Sci USA
108(29):11766–11771.
[33] Chapman D, Cane MA, Henderson N, Lee DE, Chen C (2015) A Vector Autoregressive ENSO
Prediction Model. J Clim 28:8511-8520.
[34] Meng J, Fan J, Ashkenazy Y, Bunde A, Havlin S (2018) Forecasting the magnitude and onset
of El Niño based on climate network New J Phys 20:043036.
[35] Noteboom PD, Feng QY, Lopez C, Hernández-Garcı́a, Dijkstra HA (2018) Using network
theory and machine learning to predict El Niño. Earth Syst Dynam 9:969-983.
[36] Ham YG, Kim JH,Luo, JJ (2019) Deep learning for multi-year ENSO forecasts. Nature, 573,
568-572.
[37] Webster PJ (1995) The annual cycle and the predictability of the tropical coupled ocean-
athomosphere system. Meteorol Atmos Phys 56:33-55.
[38] Goddard L et al. (2001) Current approaches to seasonal to interannual climate predictions.
Int J Clim 21:1111-1152.
[39] Ludescher J, Bunde A, Havlin S, Schellnhuber HJ (2019) Very early warning signal for El
Niño in 2020 with a 4 in 5 likelihood. arXiv:1910.14642.
8[40] Tsonis AA, Swanson KL, Roebber PJ (2006) What do networks have to do with climate? Bull
Amer Meteor Soc 87:585-595.
[41] Yamasaki K, Gozolchiani A, Havlin S (2008) Climate networks around the globe are signifi-
cantly affected by El Niño. Phys Rev Lett 100:228501.
[42] Donges JF, Zou Y, Marwan N, Kurths, J (2009) The backbone of the climate network. EPL
(Europhysics Letters) 87:48007.
[43] Gozolchiani A, Havlin S, Yamasaki K (2011) Emergence of El Niño as an autonomous com-
ponent in the climate network. Phys Rev Lett 107:148501.
[44] Dijkstra HA, Hernández-Garcı́a E, Masoller C, Barreiro M (2019) Networks in Climate (Cam-
bridge Univ Press, Cambridge, UK).
[45] Fan J, Meng J, Ludescher J, Chen X, Ashkenazy Y, Kurths J, Havlin S, Schellnhuber HJ
(2020) Statistical physics approaches to the complex Earth system. Physics Reports 896:1-84.
[46] Kalnay et al (1996) The NCEP/NCAR 40-year reanalysis project. Bull Am Meteorol Soc
77:437-471.
[47] National Oceanic and Atmospheric Administration, Earth System Research Laboratory.
http.//www.esrl.noaa.gov/psd/data/gridded/data.ncep/reanalyis.html
[48] Ludescher J, Gozolchiani A, Bogachev MI, Bunde A, Havlin S, Schellnhuber HJ (2014)
Very early warning of next El Niño. Proc Natl Acad Sci USA 111:2064-2066; ibid. doi:
10.1073/pnas.1323058111.
[49] Richman JS, Moorman JR (2000) Physiological time-series analysis using approximate entropy
and sample entropy. Am J Physiol Heart Circ Physiol 278, H2039–2049.
[50] Pincus S (1995) Approximate entropy (ApEn) as a complexity measure. Chaos 5, 110–117.
[51] Pincus SM (1995) Quantifying complexity and regularity of neurobiological systems. Methods
Neurosci 28, 336–363.
[52] Kolmogorov AN (1958) New metric invariant of transitive dynamical systems and automor-
phisms of Lebesgue spaces. Dokl Akad Nauk SSSR 119, 861–864.
[53] Pincus S, Singer BH (1996) Randomness and degrees of irregularity. Proc Natl Acad Sci USA
93, 2083–2088 (1996).
[54] ERA5 Climate reanalyis. https://climate.copernicus.eu/climate-
reanalysis?q=products/climate-reanalysis.
9You can also read