Benefits of PPP Lending Through Community Banks During the COVID-19 Recession
←
→
Page content transcription
If your browser does not render page correctly, please read the page content below
Benefits of PPP Lending Through Community Banks
 During the COVID-19 Recession

 Paper for the CSBS Banking Analytics Competition

 University of California at Irvine

 Abhishek Karimpuzha Devarajan
 Qi Wang
 Qingqing Yu
 Wanjing Xu
 Yixuan Cai

 Academic Adviser: Professor Gary Richardson
1

Abstract
During the COVID-19 pandemic, the Paycheck Protection Program (PPP) was designed to keep
small businesses running and reduce unemployment. Preliminary research done by CSBS
suggests that community banks played a large role in distributing PPP loans to small
businesses. In this paper, we examine the effect of PPP lending by community banks on the
county-level unemployment in 2020 and 2021.Our regression model reveals that community
banks lending decreased unemployment more than comparable lending of non-community bank
lending. Possible explanations for our finding include the speed that the community issues the
loans, the high forgiveness rate of loans extended by community banks, and the industrial
composition of PPP loans by community banks.
2

1. Introduction
 The 2022 Conference of State Bank Supervisors’ (CSBS) annual Data Analytics

Competition asks us to examine the role that community banks played in the U.S. economy

during the COVID-19 pandemic. The focus is the PPP lending program. Teams must propose a

hypothesis that demonstrates the role community banks played during the pandemic and develop

a data analytics model to test their hypothesis using Paycheck Protection Program (PPP) data

from the Small Business Administration, CSBS and elsewhere.

 Our hypothesis is that PPP lending via community banks may have had a different impact

on local economies than PPP lending through other institutions. Community banks’ business

model, which emphasizes ongoing relationships with local business borrowers, may have made

them particularly effective distributors of PPP loans. Our analysis finds this to be the case. PPP

lending through community banks tended to have been more effective than PPP lending via

larger institutions. Each dollar of PPP lending via community banks lead to a larger decline in

unemployment in the county where the borrower was located. Our main finding might be

explained by our two subsidiary findings. First, PPP loans extended by community banks were

forgiven at a much higher rate than PPP loans extended by banks which were larger and less tied

to a locality. Higher forgiveness rate indicates that businesses which borrowed from community

banks used PPP loans to pay costs of business, particularly payroll costs, which kept employees

on their payroll and off of unemployment. Second, community banks extended PPP loans

quicker than non-community banks. This helped borrowers to keep their employees on the

payroll and provided funds to local communities quicker in times of need. These findings

provide new insights for regulatory and policymaking purposes and add value to stakeholders

such as bankers, businesses, and the general public, etc.

3

 We reach these conclusions via the following analytic methods. In the first step, we

created a data set as the foundation of our analysis. We began with the PPP loans data provided

by CSBS and the BLS unemployment rate from 2019 to 2021 by using STATA. Then, we

assigned PPP loans value via county zip code in R. In addition, we analyzed aggregate data

which illustrated in tables, including the different proportion of PPP loans in community banks

and non-community banks, the forgiveness value of PPP loans in both kinds of banks, the

changes and trend of unemployment rate among the whole county. Moreover, to demonstrate

visualized and macroscopical pictures of the relationship between PPP loans approval amount,

forgiveness amount in both community banks and non-community banks and unemployment

rate, we produced seven maps of the USA mainland based on our data set by using STATA.

Furthermore, we built four quantitative regression models to understand the numerical

relationship of (1.) change in unemployment rate and total PPP loans value; (2.) change in

unemployment rate and PPP loans value made by non-community banks; (3.) change in

unemployment rate and PPP loans value made by community banks; (4.) change in

unemployment rate versus non-community bank loan value and community bank loan value.

Lastly, we made one line plot and two scatter plots by STATA to see the proportion of

community banks PPP loans lending in all PPP loans made by both kinds of banks overtime.

 Community banks played an important role in PPP loans. Community banks gave quick,

flexible and personal loans to local people and small businesses. Furthermore, community banks

helped to adjust the unemployment rate in a positive way. From our mapping result, if the place

has a high unemployment rate, it will also have a high use of PPP loans. The relationship

between the unemployment rate and PPP loans are all positive in results and regression lines in

both community bank figures and commercial bank figures, but community banks have a

4

stronger result than commercial banks, which means that community banks give more help for

unemployed people than commercial banks. The results showed that when the PPP loans are

going up, the unemployment rate will go down. We also find that the forgiveness of loans has a

high rate in community banks, this means that community banks accept people who don't pay

back their loans and this does increase the rate of the economic growth.

 We substantiate our findings in the remainder of this essay. Section 2 reviews the current

literature on PPP lending. Section 3 provides background information necessary to understand

our arguments and statistical methods. Key information includes a description of the COVID-19

pandemic and its economic effects in the United States, details of the Paycheck Protection

Program (PPP), and a description of community banks focussing on their characteristics and

unique features. Section 4 presents the methods that we use to analyze the data, and the result we

got from it.

2. Literature Review

 In response to the negative effect of COVID-19 on economic conditions, policy makers

of the U.S. federal government passed the Coronavirus Aid, Relief, and Economic Security Act

(CARES Act) on March 27, 2020. That act establishes the Paycheck Protection Program (PPP)

as a way of providing loans to support small business owners and offsetting revenue loss during

business shutdowns. Existing studies about the Paycheck Protection Program mainly explore its

impact on the job market and banking system. Providing a comprehensive assessment of

financial intermediation and the economic effects of the Paycheck Protection Program (PPP),

Granja, J., Makridis, C., Yannelis, C., & Zwick, E. (2020) reveal that banks played an important

role in mediating program targeting, which helps explain why some funds initially flowed to

regions that were less adversely affected by the pandemic. In another literature, Kapinos, P.

5

(2021) uses U.S. county-level data to study county-Level determinants and effect on

unemployment. By focusing on the major goal of this program, some literatures began to

investigate whether it is effective for boosting the economy and avoiding related issues of

COVID-19 pandemic. To indicate the overall effectiveness of the program, Sabasteanski, N.,

Brooks, J., & Chandler, T. (2021) explore the types of business that received PPP funding, the

ranges of loan amounts provided, the types of banks that processed the loans, the

cost-effectiveness of jobs saved based on the loan range, and the racial distribution of loan

recipients. In a more specific way, Allen, K. D., & Whitledge, M. D. (2021) analyzes the

effectiveness of Paycheck Protection Program (PPP) for small business lending of loans of

$150,000 or less using Google mobility data.

 Among these literatures, few of them analyze the role of community banks to local

businesses. To determine whether the impact of community differs from other banks in Paycheck

Protection Program, our paper examines the relationship between community banks and local

businesses by developing hypotheses and creating analytics models based on the PPP loan data.

In terms of database, Barraza, S., Rossi, M., & Yeager, T. J. (2020) collect monthly county-level

labor data through April 2020 from the Bureau of Labor Statistics to study the short-term causal

effect of the Paycheck Protection Program on unemployment. In addition to the county level

unemployment data, this paper draws FDIC (Federal Deposit Insurance Corporation) data to

show areas with more community banks and match PPP loan data by zip code to reveal

geographic distribution of PPP funds across U.S. counties. In terms of research method and

model, Marsh, W. B., & Sharma, P. (2021) study bank responses to the Paycheck Protection

Program (PPP) and its effects on lender balance sheets and profitability through a Bayesian joint

model that examines the decision to participate. Given our assumption that the distribution of
6

community banks was exogenous to the COVID-19 Pandemic and the PPP lending program, our

paper builds a panel regression with difference-in-difference estimators to show the influence of

PPP lending from community banks compared to other banks on the local economy.

3. Background

3.1 COVID-19 Pandemic

 The new respiratory illness starts to spread at the end of year 2019, it is known as

Coronavirus disease or COVID-19. COVID 19 had a very strong contagious disease, with a very

high incubation period and mortality rate. The virus tends to lie dormant in a person’s body for 2

to 4 weeks long, and followed by symptoms such as cough, fever, difficulty breathing, muscle

aches, headache, loss of taste and smell etc. Elder people and people who have compromised

immune systems are more likely to have risk in COVID 19. The mode of transmission is through

close contact, and viral particles are spread in poorly ventilated or crowded rooms. To slow and

stop the quick spread of COVID 19, several countries like China, Korea, Italy, and Iran imposed

major restrictions on travel, work and import and export. The government advises people who

have symptoms to stay at home and calls on everyone to wear face masks to prevent close

contact. But these moves have had little success, COVID 19 cases surged millions of people over

the next few months in different places all over the world, and the number is counting. At the

same time, due to the insufficient understanding of the new crown, there is no way to develop an

effective vaccine in a short period of time. The surge in the COVID 19 had led to increased

pressure on hospitals for treatment. Hospitals in various countries were full and insufficient of

beds for those critically ill patients. Furthermore, since the COVID-19 Pandemic broke out

suddenly, hospitals did not have extra time to purchase and collect medical materials, the medical
7

staff were insufficient, and the long working hours made those medical staff tired, etc. These

were all the reasons that caused several places’ medical systems to be on the verge of collapse.

 The long-standing COVID-19 pandemic has not only affected people’s basic lives, but

also directly affected the economic markets of some countries, such as Italy, the United States,

Spain, China, etc. Since the government asked people to stay at home to avoid close contact, the

industrial chain of stores, companies, production lines, etc., has been shut down for a while, and

this status has continued for a long period of time. It is easy to understand that this kind of

situation will cause the GDP decline quickly, since the calculation of GDP=CA+I+CB+X. Where

“CA” is consumption, “I” is Private investment, “CB” is government spending, and “X” is net

exports. Also if no one consumes anything in the past several months, the number of

consumption will get lower compared to the day before. Not to mention that not only the

consumption is getting lower, the net exports are also decreasing at the same time due to the

closure of ports.

3.2 Paycheck Protection Program Loans

 In order to reduce the impact of COVID-19, the US government began to reduce

economic activities in March 2020. A large proportion of the small businesses stopped working

or temporarily closed since then. This caused overall employment to increase significantly. To be

more specific, the unemployment rate of the United States climbed from 4.4% to 14.7% from

March 2020 to April 2020 according to BLS, which rose to record high. The unemployment rate

increased by 10.3% in only one month. If a large number of small businesses shut down, the

economy would be hit, which might cause a series of serious consequences. One of these is that

the public loses confidence in the US economy.
8

 In this case, the federal government needed to take some appropriate actions. The Paycheck

Protection Program, henceforth PPP, is an SBA (U.S. Small Businesses Administration)-backed

loan that helps businesses keep their workforce employed during the COVID-19 crisis. PPP

loans aim to help small businesses cover their usual expenses like payroll costs and other eligible

costs to get through this difficult time. Under this circumstance, workers can stay at home

without working and meanwhile the economy can function relatively well.

 In addition, to encourage the small business owner to spend most part of PPP loans on their

employees’ salary, the act regulated that qualified borrowers may be eligible for PPP loan

forgiveness. For example, for first draw PPP loans’ lenders who satisfy that employee and

compensation levels are maintained, the PPP loans proceeds are spent on payroll costs and other

eligible expenses, and at least 60% of the proceeds are spent on payroll costs during the 8- to

24-week covered period, they are qualified for full loan forgiveness.

3.3 Community Banks

 “Loan funds were disbursed by financial institutions including commercial banks, thrifts,

credit unions, and fintechs. This mode of distribution mirrored the standard SBA loan programs

that support small businesses and utilized the SBA’s existing lender networks. That said, the loan

terms, eligibility, and forgiveness conditions differed substantially from existing SBA loan

programs.”(Marsh & Sharma, 2021)

 Community banks are institutions that issue depositary and lending issues in small and

certain geographic areas. They are owned and operated by commercial institutions and they

spread over the whole country as the foundation or basis of cities and towns. The primary

customers for community banks are local individuals and small businesses. As a result,

individuals can easily find several community banks, for example Carver Bank, Ally Bank,
9

Bankers Trust etc., near their current locations. Since community banks only serve for certain

locations, they are more specialized in specific regions than bigger banks. In other words, they

are effective lenders because they have knowledge of borrowers in their areas. They know more

about their neighborhood and local economy and cultures.

 Community banks value customers’ personal relationships like family history to decide

whether to make a loan or not, the loan issued, the interest rate and so on. In contrast, big

commercial banks tend to evaluate their customers using standard criteria such as credit scores,

earnings, assets etc. The knowledge that community banks have of their local customers are their

advantages compared to large national banks. These advantages rendered PPP loans functioned

at a quicker speed and further overcome the economic fallout during the covid-19 pandemic.

 Community banks contribute a lot in Paycheck Protection Program lending. Yosif, N. (

2021) pointed out that community banks made 60 percent of all PPP loans—including 72 percent

of PPP loans to minority businesses. Moreover, community banks put more effort on vulnerable

businesses in the period of pandemic by “accounting[ing] for 67 percent of PPP loans to

industries with average hourly earnings of $10 to $20 per hour. They also accounted for over 50

percent of all PPP loans to industries with average hourly earnings between $20 and $50 per

hour.” In addition, community banks play a much more important role in rural and suburban

communities than in cities by “accounting for 85 percent and 72 percent of all PPP loans,

respectively—while accounting for 51 percent of PPP loans in urban communities.”
10

4. Method and Results
4.1 Data Sources

 The data sources we used for this project include PPP loan-level data, 2020 and current

unemployment data, US county names and FIPS codes, and NAICS codes for industries. The

PPP loan-level data was provided by CSBS for the 2022 Data Analytics Competition. We

collected the unemployment data from the Bureau of Labor Statistics (BLS). Our table of US

county names and FIPS codes comes from the US Department of Agriculture (USDA). Finally,

we received a table matching two-digit NAICS codes to their respective industries from the

Census Bureau. Along with collecting these data sources, we also merged and transformed the

data in order to create the models and figures we used in this paper. These transformations will

be covered in the following paragraphs.

 First, we will address the modifications made to the PPP loan-level dataset. We began by

assigning each loan in the PPP loan-level dataset a county FIPS code based on the county of the

loan borrower. We chose to use FIPS codes in order to give each loan a unique county ID, which

would not have been possible using county name alone. Additionally, using county and state

name would not be as efficient as a FIPS code, due to the fact that different datasets have

different standards for capitalizing or combining the county and state names. FIPS assignment

was done by matching the county and state names to the respective FIPS code using the table

from the USDA. Using the FIPS codes, we aggregated the total loan values

(currentapprovalamount), the total dollars forgiven (forgivenessamount), and the number of jobs

reported (jobsreported) by borrower country. We also tallied each of the previously mentioned

statistics based on community bank status. These variables are represented by a suffix “_cb” or
11

“_ncb” for community bank and non-community bank respectively. We calculated the total

forgiveness rate (forgivenessrate) using the formula in Equation 1.

Equation 1:

 =

For CB and NCB, we modified Equation 1 to use the “_cb” and “_ncb” versions of the variables.

 The next dataset that we made modifications to was the unemployment data from the

BLS. Originally, the data we collected included the 2020 yearly average unemployment rate, as

well as a monthly average unemployment rate for the months from December 2020 to January

2022. At the time of our analysis, the BLS did not publish the yearly average unemployment rate

for 2021. Instead, we used the monthly averages for the months of 2021 to calculate this figure

ourselves. From there, we merged the unemployment data with our PPP loan-level data via the

borrower county FIPS code. Then, we calculated the change in unemployment rate using the

formula in Equation 2.

Equation 2:

 ∆ = 2021 − 2020

In Equation 2, the Unemployment variables represent the yearly average unemployment rate,

with the subscript indicating the year.

The other datasets we used were not modified for this analysis.

4.2 Mapping Analysis
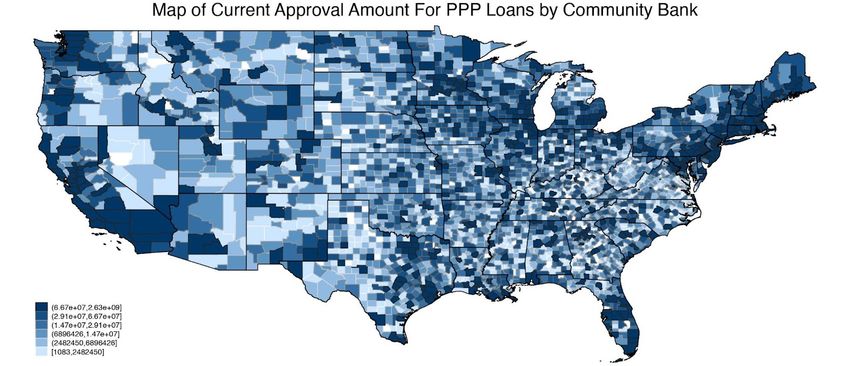
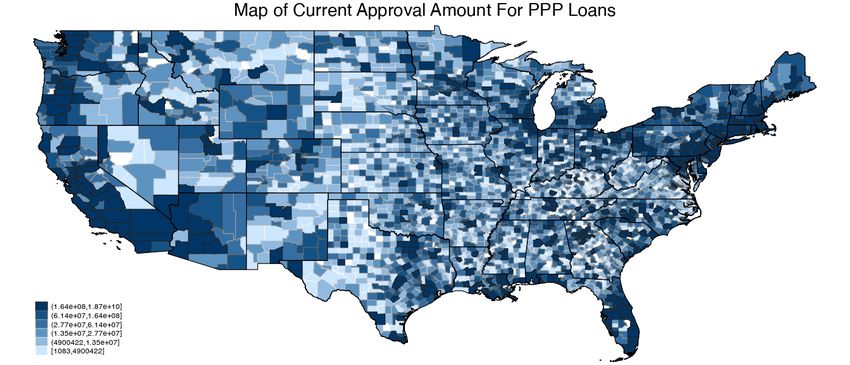
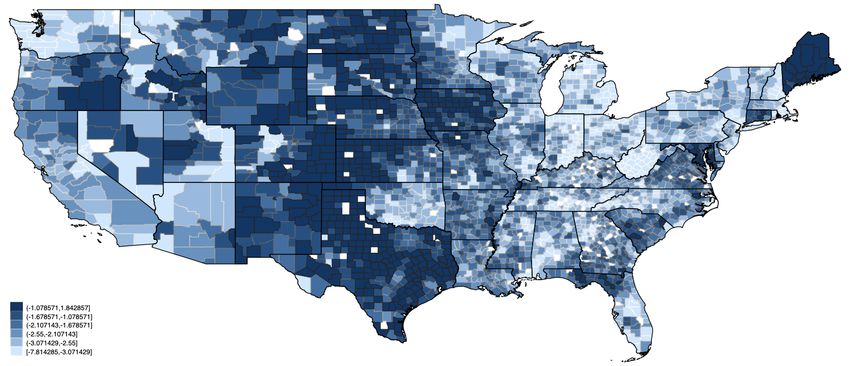
12

 We began our analysis by mapping sets of variables from our datasets by US county. In

total, there are seven maps drawn for the following: (1.) Change in the unemployment rate from

2020 to 2021; (2.) Current approval amount of Total PPP loans value made by banks; (3.)

Current approval amount of PPP loans value made by community banks; (4.) Current approval

amount of PPP loans value made by non-community banks; (5.) Forgiveness rate for total PPP

loans made by banks; (6.) Forgiveness rate for PPP loans made by community banks; (7.)

Forgiveness rate for PPP loans made by non-community banks. These maps clearly show how

PPP loans are disbursed by geographic location and how PPP loans are related to unemployment.

 There are three patterns found from the seven maps. One, PPP lending is negatively

correlated with changes in unemployment by county in 2020-2021. This correlation means that

in counties that receive more PPP lending the unemployment rate recovered more quickly after

the peak of the covid pandemic. Lighter regions on the map of the change in unemployment by

county indicate larger decreases in unemployment. However, those regions are darker on the map

of the current approval amount and the forgiveness amount for both community banks and

non-community banks. Inverse colors show that PPP loans helped small businesses maintain job

positions, and thus decreased the unemployment rate from 2020 to 2021.

 Two, more PPP loans were borrowed on the east and west coasts. Most darker regions are

located on the east and west coasts, which means that more small businesses were operating in

those areas. Larger amounts of current approval from banks helped them overcome the recession

caused by COVID-19. The midlands have not been affected as much as the east and west coasts.

And thus the PPP loans approval value is lighter in middle regions. This pattern stays true for

PPP loans made by both community banks and non-community banks.
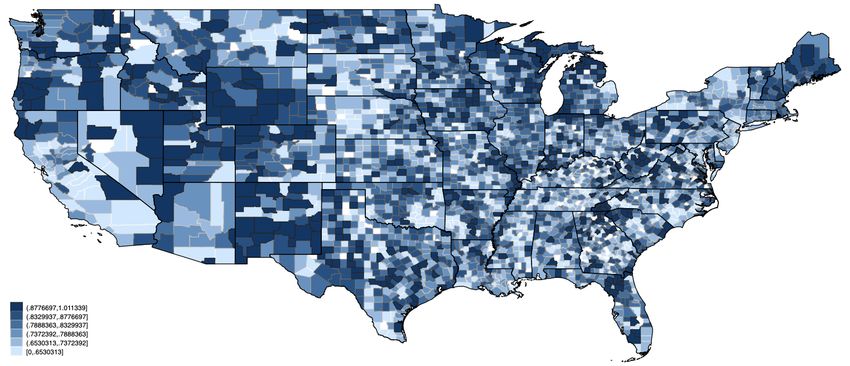
13

 Three, the forgiveness rate for total PPP loans was higher in the midland of the United

States. Although businesses from midland borrowed less PPP loans than those from east and

west coasts, the money they received from PPP loans was mainly put in payroll costs. According

to the SBA, businesses or individuals that spend at least 60% of their total loan on payroll costs

will receive full forgiveness over the 8- to 24-week covered period. This illustrates that those

darker regions remark businesses on the midland paid most of the PPP loans in employee’s

salaries in order to improve workers’ life situation. Again, this pattern is true for PPP loans made

by both community banks and non-community banks.

4.3 Regression Analysis

 After noting the negative correlation between community bank (CB) PPP lending and

change in unemployment, we constructed a series of simple linear regressions to quantify the

nature of this relationship. In total, we developed four linear models: (1.) Change in

Unemployment from 2020 to 2021 regressed against Total Lending Amount, (2) Change in

Unemployment from 2020 to 2021 regressed against Lending Amount by CB, (3) Change in

Unemployment from 2020 to 2021 regressed against Lending Amount by non-Community

Banks (NCB), and (4) Change in Unemployment from 2020 to 2021 regressed against Lending

Amount by CB and Lending Amount by NCB. In all of these models, the lending amount was

measured in billions of dollars. Using the variable definitions from Section 4.3, we define the

variable Lending as is shown in Equation 3.

Equation 3:

 = 9
 10
14

The variables CBLending and NCBLending are defined similarly, with currentapprovalamount

being replaced by currentapprovalamount_cb and currentapprovalamount_ncb respectively.

 Our first model, shown in Equation 4, was used to ascertain whether or not there was a

significant relationship between the amount of PPP lending and the change in unemployment.

Equation 4:

 ŷ = β0 + β1( ) + ε

Based on the results shown in Table 1, it is clear that these variables have a significant

relationship. Expanding on this result, we can see that in models 2 and 3, represented by

Equations 5 and 6 respectively, the relationship between dollars loaned and change in

unemployment continues even after filtering for a certain bank type (CB or NCB).

Equation 5:

 ŷ = β0 + β1( ) + ε

Equation 6:
 ŷ = β0 + β1( ) + ε

In particular, Table 1 shows us that the coefficient in model 2 is larger than the coefficients of

model 1 or model 3. This seems to indicate that CB lending has a larger impact on decreasing the

unemployment rate than NCB or aggregate lending.

 We continued our regression analysis with model 4, which places both CB and NCB

lending in one model (see Equation 7).

Equation 7:

 ŷ = β0 + β1( ) + β2( ) + ε
15

The exact coefficients given in Table 1 for this model may not be completely accurate. CB

lending and NCB lending are highly correlated variables, leading to collinearity within the

model. In this case, the coefficients are biased towards 0 and the standard errors are biased

upwards. However, despite these biases, it is clear that CB lending has a larger effect on the

change in unemployment rate than NCB lending does.

4.4 Robustness Checks:

 In order to test the robustness of our regression analysis, we calculated a few more tables

that measure the impact of community bank lending. First, we calculated the percentage of PPP

loans that were forgiven by community and non-community banks. The results are shown in

Table 2. We found that community banks were much more likely to offer loan forgiveness to

small businesses than non-community banks. This trend holds true whether the percentage of

forgiven loans is calculated based on the number of loans issued, or the total value of loans

issued. PPP loan forgiveness is highly correlated with lower unemployment rates. This is due to

the criteria that businesses need to meet in order to have their loans forgiven. Specifically, a

business can have their PPP loan forgiven if they use the funds of that loan to pay their

employees. These employees are then able to keep their job instead of collecting unemployment

insurance. With this information in mind, the results in Table 2 seem to firmly support the results

implied by our regression analysis.

 Along with the percentages of forgiven loans, we also looked at the distribution of loans

across various industries. Using the NAICS codes provided by CSBS, we tallied up the number

of loans distributed and the total value of those loans by industry and by bank type. We found

that in all industries aside from agriculture, NCB loans outnumbered CB ones. The other industry

where the gap between CB and NCB lending was small was the mining industry. Interestingly,
16

both of these industries tend to be clustered in rural areas of the country. This presents the

question of whether it was CB lending that led to falling unemployment rates, or if rural

communities were quick to recover from the pandemic for other reasons. For instance, it is

possible that rural regions managed to avoid large spikes in COVID cases due to their low

population densities. Originally, we were planning to investigate this issue using the County

Business Patterns (CBP) data from the Census Bureau. However, as of April 20, 2022, CBP data

for 2020 has yet to be published.

4.5 Loan Timing

 The timing data are sorted from PPP loan data provided by CSBS. The dataset clearly

recorded the date of loan lending, the amount of PPP loans made by all banks and community

banks, borrowers’ names, and their counties. Using the date of loan lending, we collapsed the

sum of PPP loans by date and assign data to two categories: all banks and community banks.

 With the data collapsed by date, we drew a set of three graphs. Figure 8 is the count of

loans issued of PPP loans by all banks and by community Banks. The time period is set for the

first draw of PPP loans from April to September of 2020. The blue line represents the total PPP

loan times made by all banks and the red line represents the PPP loans times made by

community banks. This figure gives us a picture of how many community banks issued PPP

loans by date compared to all issuing banks.

 We also calculated the proportion of PPP loans made by community banks. The formula

for this proportion is the number of PPP loans made by community banks divided by the total

number of PPP loans made by all banks. For the scatter plots in Figure 9 and Figure 10, we only

included the percent of PPP loans made by community banks on weekdays. The aim was to
17

avoid outliers, as only non-community banks made loans on weekends. The scatter plots are

lucid to show how many PPP loans were made by community banks on each issuing day. Figure

9 and figure 10 demonstrate that the proportion of PPP loans extended by community banks for

the first draw and the second draw of PPP loans.

 Figure 8 shows counts for PPP loans made by all banks and by community banks. One

finding from this line graph is that PPP loans made by all banks had a peak up to 800,000 counts

and PPP loans made by community banks had a peak up to 180,000 counts around May 1, 2020.

Most PPP loans were made by both kinds of banks three months after the outbreak of

COVID-19. According to U.S. Bureau of Labor Statistics Data, the unemployment rate

decreased after April 2020. PPP loans might also contribute to this decline, helping businesses

pay wages and keep their businesses afloat. Furthermore, non-community banks issued PPP

loans much more times and higher loan value than community banks, but community banks

always took action at a higher speed. The peak of counts for community banks’ lending times

was earlier than the peak of total counts for both kinds of banks.

 Figure 9, the proportion of PPP loans extended by community banks, reached its peak in

April 2020, which is the very beginning time of the first draw of PPP loans. Then, the percent of

PPP loans issued by community banks declined as time went by and kept stable around

approximately 20%. The proportion of PPP loans made by community banks was over 80% in

the first week and over 50% in the following couple of weeks. This means that community banks

acted very rapidly in assigning loans to local small businesses and individuals in the first few

weeks of PPP loans acts implementation. The first spot in the scatter plot shows that only less

than 20% of PPP loans disbursed by large banks indicates that community banks were much

more helpful than non-community banks when the PPP loans act came into the effort. But here
18

we are not sure about the reason. Did community banks know more about their customers so that

they could better serve clients compared to big banks? Or did community banks have stronger

incentives to take action to assign PPP loans? Or did smaller community banks have less

processes than large banks so they could distribute loans quicker? To figure out these questions,

we need more information provided by the CSBS team.

 Figure 10 shows the trendency when the second draw PPP loans implemented. Around

January 2021, the COVID-19 situation in the US became very severe. Reported cases boomed in

late January and early February 2021. During this time, the proportion of PPP loans made by

community banks first increase to over 75% (peak) in late January and then kept descending

overtime. Community banks reacted very sensitively to the second PPP loans acts which are

determined by covid situation. These loans helped employees who tested positive and who

needed to work from home overcome their difficult time and prevented them losing their jobs. In

contrast, non-community banks reacted to the second PPP loans much slower.
19

5. Reference

Allen, K. D., & Whitledge, M. D. (2021). Further evidence on the effectiveness of community

banks in the Paycheck Protection Program. Finance Research Letters, 102583.

Barraza, S., Rossi, M., & Yeager, T. J. (2020). The short-term effect of the Paycheck Protection

Program on unemployment. Available at SSRN 3667431.

Granja, J., Makridis, C., Yannelis, C., & Zwick, E. (2020). Did the Paycheck Protection Program

hit the target? (No. w27095). National Bureau of Economic Research.

Kapinos, P. (2021). Paycheck protection program: County-level determinants and effect on

unemployment.

Marsh, W. B., & Sharma, P. (2021). Government loan guarantees during a crisis: The effect of

the PPP on bank lending and profitability. Federal Reserve Bank of Kansas City Working Paper,

(21-03).

Sabasteanski, N., Brooks, J., & Chandler, T. (2021). Saving lives and livelihoods: The Paycheck

Protection Program and its efficacy. EconomiA, 22(3), 278-290.

Yosif, N. (2021). PPP data show community banks served those most in need. Default. Retrieved

April 21, 2022, from

https://www.icba.org/newsroom/blogs/main-street-matters/2021/11/10/paycheck-protection-prog

ram-data-show-community-banks-served-those-most-in-need
20

6. Figures and Tables

Figure 1: Change in Unemployment Rate by County 2020-2021
21

Figure 2: Current Approval Amount for Total PPP Loans
22

Figure 3: Current Approval Amount for PPP Loans by Community Bank
23

Figure 4: Current Approval Amount for PPP Loans by Non-community Bank
24

Figure 5: Forgiveness Rate for Total PPP Loans
25

Figure 6: Forgiveness Rate for PPP Loans by Community Bank
26

Figure 7: Forgiveness Rate for PPP Loans by Non-community Bank
27

Figure 8: Counts for PPP Loans Made by All Banks and PPP Loans by Community Banks
28

Figure 9: Percent of PPP Loans Extended by Community Banks in 2020
29

Figure 10: Percent of PPP Loans Extended by Community Banks in 2021
30

Table 1 : Regression Results

 All Loans Only CB Only Non-CB CB and Non-CB
Variables (1) (2) (3) (4)

Total PPP Loans -0.19935 ***
($ bil) (0.028)

Community -0.98143*** -0.61270 *
Bank PPP Loans (0.136) (0.259)
($ bil)

Non-Community -0.23560 *** -0.10672 .
Bank PPP Loans (0.0335) (0.06402)
($ bil)
Notes: Standard error in parenthesis. Significance level indicated by *** - 0.001, ** - 0.01, * - 0.05, . - 0.1.
31

Table 2: Percentage of Loans Forgiven by Bank Type
 Forgiven By Number Forgiven By Value

Bank Type # All Loans # Forgiven Percent Total Value Forgiven Value Percent
 (mil) (mil) ($ mil) ($ mil)

Community 2.3 1.4 61.5% 561,155 126,992 77.3%

Non- 6.1 2.4 38.8% 396,902 242,730 61.2%
Community

All 8.4 3.8 45% 164,253 369,722 65.9%
32

 Table 3: Loans Distributed by Industry and Bank Type
NAICS Industry Title # # CB # NCB # All CB NCB All % cb % cb
Code Businesses Loans Loans Loans Loan Loan Loan Loans Loans
 (mil) (10k) (10k) (10k) Value Value Value (Count) (Value)
 ($ bil) ($ bil) ($ bil)

23 Construction 1.51 24.75 50.53 75.28 23.36 44.05 67.41 32.9 34.7

11 Agriculture, Forestry, Fishing and 3.68 39.25 14.83 54.08 7.66 5.96 13.62 72.6 56.2
 Hunting

72 Accommodation and Food Services 9.00 15.17 37.00 52.17 14.48 29.56 44.03 29.1 32.9

21 Mining .032 1.43 1.51 2.94 1.94 2.71 4.65 48.5 41.8

42 Wholesale Trade .70 5.68 1.97 25.42 6.81 20.93 27.73 22.4 24.5

54 Professional, Scientific, and Technical 2.41 21.43 69.05 90.48 17.64 50.69 68.32 23.7 25.8
 Services

81 Other Services (except Public 1.92 25.85 97.02 122.87 10.63 31.21 41.84 21 25.4
 Administration)

52 Finance and Insurance .77 6.74 16.41 23.15 3.88 8.59 12.47 29.1 31.1

92 Public Administration .26 .59 1.65 2.24 0.62 1.25 1.88 26.4 33.2

62 Health Care and Social Assistance 1.70 17.30 51.26 68.54 21.72 48.17 69.88 25.2 31.1
33

56 Administrative and Support and Waste 1.65 9.71 37.89 47.60 7.07 21.96 29.03 20.4 24.3
 Management and Remediation Services

61 Educational Services .43 2.66 9.78 12.43 3.54 8.78 12.32 21.4 28.8

53 Real Estate Rental and Leasing .89 11.57 25.96 37.53 5.04 11.68 16.72 30.8 30.1

71 Arts, Entertainment, and Recreation .38 5.04 18.85 23.89 2.50 7.21 9.71 21.1 25.8

51 Information .37 1.97 8.08 10.06 2.12 7.55 9.67 19.6 21.9

22 Utilities .05 .34 .71 1.05 0.55 0.88 1.43 32.2 38.7

55 Management of Companies and .08 .21 .95 1.16 0.37 1.15 1.51 17.9 24.2
 Enterprises
You can also read