Big Data for Population and Social Policies - Pulse Lab Jakarta
←
→
Page content transcription
If your browser does not render page correctly, please read the page content below
Big Data for Population and Social Policies
               Rajius Idzalika, Zakiya Pramestri, Imaduddin Amin, Yulistina Riyadi
               and George Hodge
               Pulse Lab Jakarta - United Nations Global Pulse
               E-mail: {rajius.idzalika, zakiya.pramestri, imaduddin.amin, yulistina riyadi,
               george.hodge}@un.or.id

               Abstract.
                   Harnessing big data for policymaking is an evolving paradigm, which is being influenced
               by the rapid advancements in technology that are producing real-time data exhausts of our
               everyday activities. With the aim of accelerating the adoption of big data applications in the
               areas of population dynamics and social development research, we present a brief introduction
               to big data research approaches for researchers and practitioners in these fields. We discuss big
               data fundamentals, methods, potentials, as well as challenges and how to address them. We
               highlight these aspects with evidence drawn from use cases in the hope of increasing support
               for the continuation, improvement and expansion of big data analytics in policymaking and the
               operational delivery of public programmes.

1. Introduction
The birth of big data was predicted decades ago when studies from as early as the 1940s observed
that the capacity required for information storing was growing exponentially [1]. Those studies
talked about analog data, before internet and mobile phone were so widely available. The
researchers arrived at a similar conclusion that an explosion in information availability would
be the future.
   The information technology (IT) penetration in modern society undoubtedly changes,
gradually and in some cases radically, the way people interact, behave and ultimately produce
data. The spread of information technologies is noticeable in all regions of the world, minus
a few remote and isolated locales. Mobile phones enable communication between faraway
places, and in a more flexible and personalized fashion. The internet itself catalyzes digital
innovations and provides opportunities to improve the quality of life in various aspects, ranging
from distance learning to the development of smart cities. Drones and satellites nowadays can
capture landscapes and aerial images. More innovations in the IT industry, such as the latest
blockchain technologies will color and shape the life of humans in unimaginable ways.
   In 2014, there were about three billion internet users, and with access increasing day by day,
we are sure to reach the four billion mark [2]. In some places, mobile phones are found more
often in homes than electricity or clean water [3]. With more and more similar data emerging
in the digital world, there are more opportunities to study human behavior at a finer level [4].
In a nutshell, this massive amount of digital data is what is commonly referred to as big data.
   Big data is a relatively novel concept and one that is still foreign for a large audience,
including some researchers who traditionally work with large data sets such as government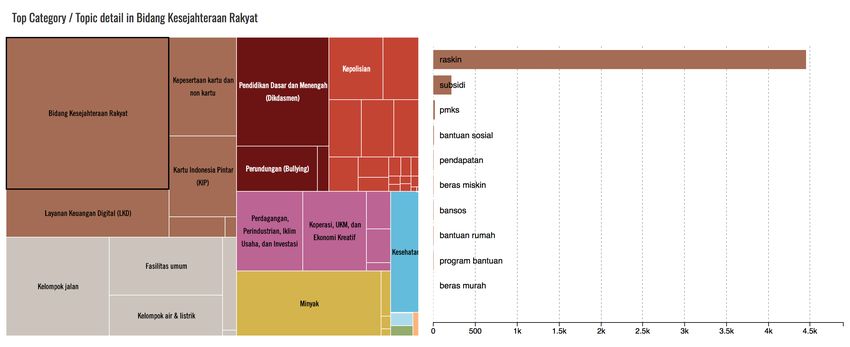
census. In the past, data like those were considered as high volume data, but with limited types
of measurement [5]. Big data analytics on the other hand, requires additional expertise and
unconventional technical skills to extract information that is sparsely distributed along the data
spectrum.
   The private sector, from early on, has seen the opportunities that big data provide for business
development. Business enterprises have been driving the recent developments in the fast yet
complex processing and analysis of big data to extract valuable insights, widely known as data
science. The process of adopting big data for research and policymaking in the public and social
sectors is much slower due to delays in the adoption of cutting-edge IT tools.
   The contribution of this paper is two-fold. First, it provides a brief introduction of the
fundamental aspects of big data, contextual to the public domain. Second, it highlights some
of our use cases to demonstrate the potentials and capabilities of big data for complementing
conventional data sources in demographic measures and social policies. These two contributions
are significant because they either directly or indirectly support building an evidence-based
policymaking culture.

2. Theoretical Framework
2.1. Understanding the basics
Digital data may be described as electronic trails of people’s activities - the volume of which has
been expanding exponentially, with even more variety and higher velocity. Big Data has those
three characteristics (volume, variety and velocity), which are common terms used in describing
and analyzing data sets.
    Examples of big data include tax records (government data), retailer data (corporate data),
and unstructured data from satellites. Harnessing these types of data and utilizing the
appropriate technologies can potentially provide solutions for many social problems. Big data
o↵ers what traditional data does not provide: the ability to measure new variables, i.e. using
digital footprints as a proxy to detect emotions and to record behaviors, examining large samples
that provides a wide space for scientific explorations, and employing real-time data to capture
social issues early and bring timely solutions.
    Although there is no exact number to describe the current data volume size, and many
people do not know how fast the data changes in big data terms, many researchers agree that
big data cannot be e↵ectively analyzed by using traditional tools and techniques. Thus, a set of
a new techniques, more advanced tools and an improved digital infrastructure are required to
accommodate and analyze those data sets.
    Big data technology such as computing cluster, a distributed file system is now available
both on premise solution and cloud environment (for instance Google Cloud Platform and
Amazon Web Service). However, since big data is still evolving, new findings and tools are
also constantly emerging. Despite these developments, big data analysis is now in high demand
across organizations of di↵erent types.
    As we transition from small data to big data analysis, technology is not the only barrier. The
complexity of decisionmaking is also a major challenge, as now we have to consider data that is
rapidly changing. For this reason, many advance algorithms are needed to help humans make
calculated and timely decisions. Machine learning is one approach that is now being considered
for such purposes.
    A machine learning algorithm is an application of artificial intelligence technology that,
if given more data, is able to learn by itself with increased accuracy and precision. It is a
useful technique to uncover patterns in big data and to reduce reliance on human judgment or
intervention. R and Python are the most popular programming languages used for such purposes.
However, many machine learning techniques lack computational efficiency in handling massive
volume and high speed data. Thus, researchers are now developing more e↵ective techniques
[6]. One of the current state-of-the-art machine learning tools is deep learning, which is modeled
after the structures and functions of the human brain. An introductory reference to machine
learning can be found in Introduction to Machine Learning [7]. Readers with adequate statistics
background may find it easier to study machine learning from a statistical perspective [8]1 ,
while readers more interested in the practical guidance of predictive model might find Applied
Predictive Modeling [9] more appealing.
2.2. Potentials and Implication in Public Sector
In the public sector, big data is a new, evidence base toolkit for policy, which usually relies on
four sources: statistical data and administrative data, research-based evidence, evidence from
citizens and other stakeholder, and evidence from evaluations conducted by governmental or
non-governmental institution [10]. The primary issue is, how to ensure that insights from big
data can be e↵ectively used as evidence in the policymaking process. Below we discuss some
examples of the potential use and implications of big data in the public sector, as well as the
challenge of bringing it forward.
With the benefit of being able to provide large variety of data in near real-time, big data
has the potential to contribute towards improving crisis management, including early warning
for emergency preparedness, disaster impact monitoring for emergency response, and in migrant
crises. The crucial roles of big data in times of crisis and disasters are also discussed in Meier’s
book [11]. For example, analysis of mobile data together with crowdsourcing of real-time
images, has been used to understand the ground situation and population migration during
the Haiti earthquake [12]. Mobility pattern is also being analyzed from social media data
during haze crises [13]. Some other big data projects provide a platform to collect, visualize and
analyze data from various types of sources to enhance the information delivery in crisis situation
[14, 15, 16, 17, 18, 19].
On the other hand, looking at the policy-making process in the public sector lens, big data
has become another tool to support information-based implementation. Based on policy design
principals discussed in [20], there are two ways in which government is using data for pursuing
policy outcomes; using it as substantive policy instruments and procedural policy instruments.
As substantive policy instruments mean the government is collecting data to enhance evidence-
based policymaking, while as procedural policy instruments mean the regulatory activities by
government related to information legislation. One example of how the government is using
big data as substantive information tools is using new data source such as citizen’ complaint,
and social media data to complement the existing survey and administrative data in developing
policy. Meanwhile, the example of procedural policy instrument is the government’s initiatives
to regulate open data and integrate data across government agencies.
An example of the practice of integrating big data in the government system is one that Pulse
Lab Jakarta has worked together with the Government of Indonesia to develop a National Citizen
Feedback Dashboard. Build on the first iteration using the SMS-based system for collecting
citizen feedback on public services in Nusa Tenggara Barat province to develop a dashboard to
process, analyze, and visualize the citizen’ feedback data from SMS-based system and Twitter,
Pulse Lab Jakarta brought the dashboard to a greater scope at the national level. Working
together with LAPOR! (the national citizen feedback platform) team from the Office of the
President’s Sta↵, we developed a dashboard to visualize trends from the complaints, key issues
and problem broken down in topics such as bureaucracy, social welfare, education, etc. along
with geographic visualizations. More details about the dashboard will be discussed in section
3 in this paper. Refer to the discussion in the paper by Pellini, et al. [21], the Executive
1
Although machine learning is the more popular term of the two, its concept overlaps largely with statistical
learning and their di↵erences are subtle. The noticeable di↵erence is that machine learning is more practical while
statistical learning is more procedural, i.e. checking assumptions is still required.Office of the President’s Sta↵ expressed their positive feedback upon the dashboard integration
in the government office as the data from the dashboard complement the reports from line
ministries on their day-to-day business. Although it is still too early to see the long-term impact
in the governance and policy-making ’cycle’, the above example shows evidence that using big
data to complement information in substantive policy-making has already been initiated by the
government and is being used in the short and medium term of policy planning and monitoring.
Aside from its impact as information tools in the policy-making process, big data also has
implications for strengthening governance, accountability, and transparency in the public sector.
Big data brings benefits of five main aspects: sharing, learning, personalizing, problem solving,
and government innovation [22]. Sharing means big data has a role in strengthening the system
of sharing data across agencies. Big data is also boosting the learning culture as the increase in
data availability and the new tools require new skills. With the more granular data available,
big data enables government to personalizing data. Big data also enhances problem solving
mechanisms with more opportunities for pattern observation and correlating data across the
fields. With enriched information, big data also allows more innovations both in the public and
private sectors, by having more insights for planning, monitoring, and evaluation cycle. Last,
with more available data sources that can be accessed publicly, as well as the movement of
government in releasing their data through open data, it is enabling better accountability and
transparency.
In fact, harnessing big data in public sector faces challenges on government capacity and
enabling environment. Regulatory issue is among the top challenges. Most big datasets are
owned by private enterprise. To access their data, government must have clearer regulations,
frameworks, and incentives for them to share the data [21]. Regulation is also needed to
coordinate and determine clearer roles from data collection to data sharing across agencies.
Then, there is a question of data readiness in public sector culture. The advanced technology and
information demand public capacity to process information and produce outcomes by e↵ectively
allocating capable resources, creating agencies, and developing standard operating procedures
[23]. This indicates the importance to ensure that big data use fits into the organizational
structures and activities, linked to the value chain of big data process [24]. Challenges in data
readiness also include weak institutional mechanism in public sector. A typical problem that
often arises is the data silos in many government agencies. Big data can potentially increase the
complexity of this silo system, if not supported by the organizational structure and capabilities
[25]. Finally, big data utilization brings potential and implication in public sector, while some
challenges typically don’t arise until it takes place. In principal, big data utilization ideally
will have future implications in policy decision when it achieves three essential designs: (1)
the improvement and execution of public services linked to new technologies, (2) technologies
transforming the way government is organized and (3) technologies boosting values such as
transparency and accountability [26].
2.3. Bias, Covariate Shift and Other Technical Challenges
Moving from the structural challenges, there are also technical challenges during data collection
and processing of big data. The first and primary issue concerns the coverage errors and biases.
There is an inherent tendency to overgeneralize the results of the majority to represent the
whole. This is a threat for any underrepresented society, including the disabled, ethnic minority
groups and other marginalized groups. This fact is particularly true for observational studies,
in which big data is passively collected with no intention for research. Consequently, big data
does not meet the ideal expectation to be reliable as a complementary source of insight from
traditional data sources. Some examples of big data bias include:
(i) A bias towards the urban, wealthy and young demographics in mobile data and
crowdsourced data(ii) A bias towards larger objects, the ones that are only visible at specific resolutions in satellite
images data
(iii) A bias towards urban and wealthy demographics in financial data
(iv) A bias towards extroverts and users of open personality traits in social media data
Even in a research setting that implements strict statistical approach for a valid inference, using
a large sample size without a careful research design can magnify the biases that lead to more
incorrect conclusions.
Conducting longitudinal study using big data faces a substantial problem called covariate
shift. This term describes a systemic bias due to the di↵erent information contained between
training set and test set in machine learning [27]. As an example, a training set is built from
the past information and a test set is created from data collected later. When a new policy is
introduced, it impacts the future. The information contained in data from the past and data
in the future are not the same, making the prediction inaccurate. The example above describes
what is called a system drift. Two other types of drift as the sources of covariate shift are
population drift and behavioral drift. Population drift is the shifting of population who are
producing big data, and behavioral drift is the shifting of the way people produce big data [28].
Covariate shift could also happen in cross-sectional data if the separation between training set
and test set is not conducted properly.
Other challenges include algorithmic confounding, and with dirty, sensitive, inaccessible
and incomplete limitations [28]. Dirty and incomplete issues are not new, and are normally
found in conventional data sources. They are worth mentioning because the e↵orts of cleaning
up could magnify exponentially when the data size (observations and variables) gets larger.
But even before conducting such a massive data cleaning, researchers first have to deal with
the tremendous task of accessing big data. Big data held by governments and corporates is
inaccessible for several reasons. Notably, their data usually contains sensitive personal records
and leakages will trigger negative responses and worse, lawsuits.
Finally, algorithmic confounding is a challenge that come up more with engineering. Data
scientists and data engineers might be fully aware of it, especially when they are carrying out
data processing and analysis. Within the system that shapes the information perception by the
users, algorithm can be less favorable of certain groups or individuals. There are three potential
sources that could result in biases when deploying machine learning: the programmers who
create it; the defined metrics; and the data to feed the predictive models [29].
Each of these challenges requires di↵erent solutions. As a rule of thumb, it is common to
iterate during data cleaning, processing and analyzing to obtain high quality data and results.
Programming for each step should be conducted in an efficient manner to save time for achieving
high quality results. Moreover, when investigating the causes of imbalance classes, it is a good
practice to examine the algorithms that created the data given that they are accessible. This
is also a reason to encourage algorithms transparency, accountability and reproducibility within
the data science and research communities.
Furthermore, five dimensions of solution to overcome machine bias are proposed [29], i.e.
ethical consideration when programming (ethics dimension), utilizing ensembles, randomization
and hierarchical classification model (technical dimension), regulating sensitive personal data
uses by corporations (political dimension), encouraging diversity and multicultural working
environment (social dimension) and deepening exploration on machine ethical problem
(philosophical dimension).
The European Union recently has introduced General Data Protection Regulation (GDPR),
strictly regulating the usage of personal data, which is relevant for any enterprise that conducts
business in the European Economic Area [30]. It requires full anonymization, unless consent to
release individual data is explicitly stated by the owner. This is one step forward in reducing biastowards certain groups using sensitive personal information with political power. The United Nations and other organizations that show strong preferences on gender equality and encourage potential candidates from disabled groups also directly contribute to fight over machine bias from social perspective. However, statisticians have long struggled with the biases because of the non-probability sampling method. We can learn from their lessons on how to tackle such biases with their firm theoretical foundation and empirical work. Big data can be simply seen as a non-probability sample drawn from a huge population. Hence, we can use various adjustment techniques for non-representative samples such as weighting, calibration and matching to eliminate bias such as the empirical work implemented by [31],[32],[33],[34],[35],[36],[37],[38], and [39] Covariate shifts, meanwhile, can be avoided by carefully designing and examining the training set and test set. Randomization is the gold standard to select observations for each sampling bucket. Eventually, when covariate shift becomes unavoidable, treating results with great caution is a must2 . 2.4. Accessing Big Data The first barrier to harnessing big data in public sector is obtaining the correct data. In this section, we provide two working strategies to overcome such barrier, namely, forming public- private partnerships and public-generated data. Government digital record is also a big data source. In this paper, we choose to not address how to access big data from the government, because we believe the readers are knowledgeable with expertise on this matter. 2.4.1. Public Private Partnership Data partnerships take many forms, this sub-section will focus on two types of partnership and explore some of the building blocks of a successful partnership. For example, the simplest partnership is bilateral, between a data producer and researcher. To build such a partnership, capacity, trust, an organisational strategy aligned with the objectives of the data partnership, and a regulatory environment that permits the research are needed for both parties. The owners of many new data sources reside in the private sector, therefore, the capacity of engaging in this kind of partnership is related to their abilities to share the data, and the availability of time to absorb the methods and approaches deployed by the researchers in developing insights from the big data. Because some big data sets are sensitive, the most appropriate form of sharing is to give researchers access to the data within the systems of the data owner, the so-called ’walled garden approach.’ But, to do this, the data owner requires the capacity to set up, manage and monitor the server(s) accessed by the researchers throughout the project, as well as set-up and monitor the data flows to the server(s). These requirements may involve some initial data processing, anonymization and aggregation, or the construction of a model based on the original dataset to create synthetic data, all of which takes time and specialist skills. In addition, assuming that the research project and data partnerships are aligned broadly with the organisational strategy of the data owner, the capacity to absorb the methods used in the research is also important, such as designating the time of some analysts to understand the analytical steps and the codes developed by the researchers. On a couple of occasions, Pulse Lab Jakarta has unfortunately encountered organisations that had the interest to enter into a data partnership, but did not have the capacity to do so. 2 A prominent strategy to dealing with covariate shift is to measure the shifts by Kullback-Leibler divergence [40] or using decision tree learning [27] and making adjustment thereafter, such as by weighting the observed covariates using density estimation that taking into account the density of the whole population, i.e. Heckman model in linear regression [41],[27],[42]. Another strategy is to skip the learning methods that are prone to covariate shifts, i.e. ID3, naive Bayes and soft-margin SVM, and stick to methods that are known to be robust, i.e. logistic regression and hard-margin SVM [27].
On the other side of the data partnership, the receiving organization or researchers must also
have the capacity to manage data access, as well as to produce valuable methods and insights
from the data. The authors are aware of some examples from social organisations that are
motivated by the popularity of the use of big data. They developed data partnerships with data
owners, only for the data owners to discover that the partner did not have the capacity to do
anything useful with the big data. Under such circumstances, it is inadequate for a third party
to analyze the data, as it creates unnecessary legal complexity; the data owner may as well
work directly with the third party that has the data analysis capacity. Trust is built on back-
and-forth interactions, aligned incentives, and mutually satisfactory contracts between the data
partners, such as non-disclosure agreements. Additionally, the credibility of the partners is also
crucial, which is based on their reputation and past experience of successful data partnerships
and research projects. Concerning the regulatory environment, the data partnership must be
legally compliant, which is becoming more complex considering the EU General Data Protection
Regulation mentioned above. But as we are discussing the use of data for good intentions, data
partnerships should go beyond being legally compliant; they should also be ethical. The informed
consent of the research subjects should be important condition for data partnerships in the social
and public sectors.
    Due to the limitations of bug data, such as coverage errors and biases, multilateral data
partnerships with many data owners and research organizations can be of merit. For example,
it is not possible to understand trends in e-commerce from one e-commerce company: is the
observed change due to an increase in sales, a growth in the market, or a growth in market
share by the data owner? Multilateral data partnerships for public policy and social good
encounter the same challenges as bilateral data partnerships, described above, with an increase
in administrative and legal complexity. For example, as the ’walled garden approach’ is less
applicable to multilateral data partnerships, the data owners must share data with some level of
aggregation and ensure that sensitive insights to their business or its customers are not shared.
    Data partnerships require trust and time to build, but they can be very beneficial to both
the data owners and the recipients as they can uncover new value from data, new business
opportunities, and new policy insights for public good.

2.4.2. Public Generated Data Another approach to making big data more available is to
generate them via public participation. In this section, we describe two common e↵orts, citizen
science and crowdsourcing projects.

Citizen Science In 2005, Wikipedia was the earliest to define citizen science as a project (or
ongoing program of work) which aims to make scientific discoveries, verify scientific hypotheses,
or gather data which can be used for scientific purposes, and which involves large numbers of
people, many of whom have no specific scientific training. Other scholars also provide useful
definitions, including Cohn [43], who in 2008, defined citizen science as a type of research
collaboration involving the public to participate in scientific research projects to address real-
world problems. In a recent policy paper [44], it describes citizen science as ’around the globe,
thousands of research projects are engaging millions of individuals many of whom are not trained
as scientists in collecting, categorizing, transcribing, or analyzing scientific data. These projects,
known as citizen science...’(p. 1436). Citizen science emphasizes collaborative intelligence and
co-creating scientific and community-based solutions [45]. The participants are referred to as
citizen scientists who assist projects related to science. Their contributions may vary from
monitoring wild animals and plants or other environment markers. The similarities among these
definitions are the existence of the collaboration beyond institutional boundaries, the activities
that are part of the scientific process, and the collaboration between the public and professional
scientists [46].
The emerging popularity of citizen science in the past decade is a result of societal and
technological development [46]. The societal change is marked by higher levels of education, as
well as more understanding in the scientific concept, increase in leisure time, and the growth
of healthy retirees, especially in developed countries. The growth of technology results from
the development of web-based systems and mobile phone penetration which contribute to the
availability of necessary instruments to carry out these citizen science projects. For example, a
smart phone is very useful device to collect data, especially with the various sensors that the
modern smart phone carries.
Citizen science has the potential to contribute to policy-making processes. Among
environmental policy makers, particularly in Europe and the UK, the awareness of citizen science
has started around 2008 [46]. The data gathered by citizens through citizen science projects
started to be included to supplement official data [47].
There are six categorizes of citizen science projects based on the activities [46]. The
categorization are Passive Sensing, Volunteer Computing, Volunteer Thinking, Environmental
and Ecological Observation, Participatory Sensing and Civic/Community science. More details
of the categories are explained below.
(i) Passive sensing is when citizen scientists provide information that are collected through
sensors made by themselves. For example: The Air Sensor Toolbox [48]. Organized by
volunteers as the Clean Air Coalition of Western New York, it aims to collect air samples
using simple devices and find out about what is in the air, because there were suspicious
smells and smoke coming from the largest industrial facilities in the town of Tonawanda,
New York. The results collected by the volunteers prompted the New York Department
of Environmental Conservation worked with the Environmental Protection Agency to do
further air quality testing. The data is used to pass the regulations on the industrial facilities
to improve operations, monitor for leaks and upgrade pollution controls, and finally, decrease
benzene levels in the air by 86 percent.
(ii) Volunteer computing is the usage of unused computing resources, e.g. personal computer,
tablet, smart phone to complex computer models. For example: The Computing for Clean
Water [49], a project collaboration between researchers at Tsinghua university in China
and IBM World Community Grid to run simulation of water filters design. The project
team has discovered how water can pass through carbon nano-tubes much more easily than
previously predicted. This research on a fundamental physical process holds potential for
improving access to clean water for millions through more efficient water filtration and
desalination, as well as possible applications in clean energy and medicine.
(iii) Volunteer thinking is when participants contribute their ability to recognize patterns or
analyze information that will then be used in a scientific project. For example: Galaxy Zoo
[50] asked participants to classify galaxies and map the universe
(iv) Environmental and Ecological Observation is when participants are asked to monitor
environmental pollution or observe flora and fauna. For example: Big Garden Birdwatch
[51] from the UK is a project where participants are asked to observe and identify birds.
(v) Participatory Sensing is similar to Environmental and Ecological Observation. The main
di↵erence lies within this type of project in which participants have more roles and control
over the process. They are more actively involved in deciding what is be collected and
analyzed. For example: project EveryAware [52] is a project in which participants used
their smart phones to monitor noise and air pollution data, utilizing a software provided
by project organizers. The project organizer works together with the participants to collect
noise information. This project o↵ers a novel way to access environmental information from
the public and it may trigger changes in the citizens behavior due to better awareness of
their environmental situation. The data collected through this project could potentiallyhelp researchers to understand the connections between objective ecological data and the
citizens perception of their environment.
(vi) Civic/Community science involves using a bottom-up approach. The initiators are the
participants who identify a certain problem and try to address the problem by using scientific
methods and tools. In a typical project, the problem formation, data collection, and analysis
are often carried out by project participants members who work together with scientists or
established laboratories. For example: SafeCast [53] project was developed as a response
to the Fukushima earthquake. In 2011, citizens of Fukushima developed a DIY radiation
meter to be used while driving . The project was proposed at a technology conference and
a Tokyo Hackerspace, a club where people who are interested in tinkering with technology
meet and work together.
Haklay [46] introduced a conceptual factor, where there are three factors to be considered
when analyzing the policy aspect of citizen science. These are level of geography; di↵erent policy
domains that are the results of various areas or topics related to the citizen projects and level
of engagement; and the type of citizen science activity.
(i) Level of geography - The policy formation and control as well as the actors operating
are dependent on a specific geographical area, where the project is executed. A
geographical area starts from local/neighborhood, city, regional, state/country, and finally
continental/global scale.
(ii) Di↵erent policy domains - Citizen science influences multiple di↵erent areas or topics,
such as agriculture and food, urban planning and smart cities, humanitarian support and
development aid, science awareness, and support of scientific e↵orts. These di↵erent areas
or topics will influence di↵erent areas of policymaking.
(iii) Level of engagement and the type of citizen science activity - Explaining the citizen science
projects based on the types of activities such as: Passive Sensing, Volunteer Computing,
Volunteer Thinking, Environmental and Ecological Observation, Participatory Sensing and
Civic/Community science.
From a policy perspective, citizen science projects need to be analyzed according to their
geographical scale local, city, regional, country, and continent/global (in which, di↵erent levels
of geographical scale influence levels of participation towards the projects). Consequently, once
the scope of geographical increases, then the role of individual participants in the whole scientific
process diminishes [46].
An exemplary case is data collected by citizen scientists during observation of a tree disease
outbreak (Chalara, also known as Ash Dieback). The UK Department of Environment, Food
and Rural A↵airs (Defra) recognized that the data is able to confirm the scale of the spread
of the disease. The current plans for addressing this disease and, more generally, Defras Tree
Health Management plan integrate citizen science into the operation of the policy [47].
Citizen science can support data collection to elicit high-quality information for policymaking.
However, policy makers should be aware of the adverse e↵ect of using this citizen science
approach, such as the potential of conflict due to citizen science, the use of indigenous knowledge,
and the potential risks from Do-It-Yourself (DIY) Science activities [46]. Information collected
by citizen in citizen science project might seem inherently confrontational, such as at the local
and city level, where the community collects information to oppose or challenge local industrial
facilities or future plans by local authorities, The challenge in using indigenous knowledge may
occur as a result from collecting information on sensitive information such as the location of an
endangered species. Potential risks related to DIY science activities may happen if a project
includes a tool making process which including handling dangerous materials as part of the tool.
Without proper understanding of the risks, as well as appropriate safety procedures, citizen
scientists might end up endanger themselves, as well as others.Crowdsourcing The term ”crowdsourcing” was first introduced in 2005 by Je↵ Howe and Mark
Robinson, editors at Wired, to describe how businesses were using the Internet to ”outsource
work to the crowd” [54]. Howe defines crowdsourcing as ’the act of a company or institution
taking a function once performed by employees and outsourcing it to an undefined (and generally
large) network of people in the form of an open call. This can take the form of peer-production
(when the job is performed collaboratively), but is also often undertaken by sole individuals.
The crucial prerequisite is the use of the open call format and the large network of potential
laborers.’ [55]
Crowdsourcing has gained more popularity in the past decade. Unlike the first application
for-profit purposes like Threadless, InnoCentive and iStockphoto, crowdsourcing is also being
applied in various sectors for non-profit purposes, such as in public sector. Crowdsourcing
has also been used to aid democratic processes, for instance: in law and strategy processes,
participatory budgeting, and citizen petition sites.
Particularly in Indonesia, crowdsourcing has gained more recognition. A crowdsourcing
project that was initiated independently is Kawal Pemilu [56] (English: ’guard the election’).
This is a website used to provide calculation of ballot counts of Indonesian citizen during
Indonesia’s 2014 general election using crowdsourcing. The crowdsourcing method was used
to provide transparency in calculating citizen’s voice and to avoid electoral fraud. Kawal Pemilu
was geared by 700 volunteers who counted the vote tally documents manually and released the
count result on its website in real-time and the result was updated every ten minutes to the
general public. By using crowdsourcing to provide transparency of ballot counting, Indonesia
has started a new era in which citizens can play a crucial part in ensuring that the democratic
journey of the country is going in the right direction.
Another crowdsourcing project initiated nationally was by the Government of Indonesia
through Kantor Staf Presiden (Office of the President of Indonesia) through a system called
LAPOR! [57], a crowdsourcing platform for complaint-handling. In this platform, Indonesian
citizens can submit their complaints and the system will pass their complaints to the related line
of ministries, directorate, etc. to be followed up. LAPOR! Is also available via mobile application
for Android, BlackBerry, and iPhone to ease and widen its accessibility and usability.
At the sub-national level, Jakarta has its own crowdsourcing platform which has almost
similar functions to LAPOR!. This one is called Qlue [58], a crowdsourcing platform that
collects complaints from citizen and connects citizens with information to improve and enhance
public services in Jakarta. The system was launched on 15 December 2014. The Qlue system
organizes various types of citizens complaints by directing its users to use labels, geo-tag and
photo/video. One success story of the Qlue system is the impression from citizens about the
government tackling illegal street vendors and public facilities. The citizens say that problems
regarding waste management, illegal street vendors, and sewage problems are responded to by
local government very quickly [59].
3. Results and Discussion
In this section, we present our selected use cases that utilize various big data sources for
development sector and humanitarian action. They largely overlap with population dynamics
and social studies. Each case study will briefly describe what we did and the potential impact
for government agencies and policymaking cultures.
3.1. Social Media
Social media is a potential new data source to complement traditional data sources, especially
to better understand the situation on the ground and to observe the dynamics related to the
concerning issues faster. Indonesia, as one of the countries with high Twitter penetration, has
opportunity to utilize the Twitter data to get more insights in supporting social policies. Weexplored the potential of Twitter data to capture insights on the following case studies in four
sectors: food and agriculture, public health, humanitarian action, and urban dynamics [60].
3.1.1. Food and agriculture We explore the potential of Twitter data to nowcast food price
at the national level. The objective of this study is to understand the basic commodities’
price dynamics in near real-time. We extract Twitter data with a set of keyword related to
food commodities as a primary data source, and extract official statistics data as ground-truth
dataset.
We select four commodities, namely beef, chicken, onion, and chili by considering the data
availability in the conversation in Twitter as well as the country priorities for food security issues.
From the Twitter data, we extract two information; the price mentioned in the conversation,
and the volume of relevant messages related to the commodities over time. Then, we develop a
model to nowcast each commodity price based on the price extracted from the tweets messages,
volume of tweets today and volume of tweets yesterday. After that, we compare the result of
nowcasting price with the official data. The result shows that there is high correlation between
the price from nowcasting model with the official price, which is 0.76 for chili and more than 0.8
for other commodities [61, 62].
This initiative shows the opportunity to utilize social media data in filling out the data gaps
and reduce the time delay for sensing food commodities price dynamics. By sensing the price
dynamics of basic needs in near real-time, the government can have early-signs of event that
may lead to economic shock or crisis, and have immediate policy to response.
3.1.2. Public health Together with UNICEF and Government of Indonesia, we explore the
potential of Twitter data to understand the public perception on immunization. We capture all
conversation related to immunization, defining main sub-topics, perform analysis to get insights
from the conversation, as well as to understand the networks of the influencer in social media.
By using related keywords, we collected 88,368 relevant tweets in Bahasa Indonesia from the
period January 2012 to December 2013. We classify the conversations into four main sub-topics:
religious concerns, disease outbreaks, vaccine side e↵ects on health conditions, and launching of
new vaccine product. Then, we analyse the conversation dynamics, identify the top keywords
for each sub-topic, the most-shared contents, and the network of influencers [63].
The study explores the potential of using social media data to give insights on the socialization
process of developed programs to the relevant government and development agencies, to leverage
rapid response to public concerns, and to support a more strategic planning on launching any
social program.
3.1.3. Humanitarian action Using the case study of haze events in Indonesia, we use social
media data to observe ground truth situation from citizen perspectives, in order to complement
the information that is usually captured by satellite data and official data. This is also to
support the government in gaining more knowledge on the a↵ected population. With the study,
we could observe the hotspots dynamics and user mobility as impact to the event.
At the beginning of the study, we defined a set of taxonomy related to haze situation and
impact, to capture all relevant messages in Twitter. We run experiment that shows these
messages are highly correlated with the hotspots dynamics observed by satellite [64]. We also
use the location information that available in geo-stamp tweet, to infer a set of places a user has
been visiting and analyze the typical movement characteristics during normal situation and haze
situation. We observe that during haze weeks, some people increase their mobility by hundreds
kilometers compared to the normal weeks when they usually makes short distance trip. This
may indicate the population mobility for evacuation during the haze events [13].3.1.4. Urban dynamics We investigate the potential of using social media data to infer
commuting statistics in Greater Jakarta area. We collect more than 38 millions tweets from
1.4 million of users. From the Twitter activity data per each user, we infer two important
locations which are the origin and destination of their daily activities at sub-district level. We
define origin location as the location where a user mostly have tweets activity between 9 pm
and 7 am, while destination location as the location with most tweets activity during weekdays
which are not the origin location. We then extracted 305,761 users who have enough data on
their origin and destination location that could be inferred.
The study shows that the result has similarity with the official statistics of commuting survey
produced by Indonesian Central Bureau Statistics (BPS) in 2014 that covers 13,120 households.
A cross-correlation score between our study with the official statistics shows a value of 0.97. In
addition, when we rank the origin-destination pairs based on the proportion from number of
commuters, it shows that 22 out of 25 origin-destination pairs have the same order with the
results from the official statistics [65].
This study is potentially used to provide insights to the policy makers on the population
behavior, particularly human movements in urban areas. This should leverage knowledge as a
basis for creating policies in city operations and strategic urban planning.
3.2. Mobile Data
Whenever a mobile phone call or a transaction is made, a data called CDR (Call Detail Record)
is automatically generated by the network operator. It has the information such as which cell
towers the caller and recipients were connected to at the time and the duration of the call. From
that kind of data, many information can be inferred such as a subscriber’s mobility based on
changes in location of multiple transactions, a subscriber’s connectivity based on a list of call
recipients and so on. Furthermore, a popular mobile data analysis framework bandicoot [66] is
able to identify subscriber characteristics that fall into three categories: (a) individual such as
calls behavioral pattern; (b) spatial such as radius of gyration, entropy of places and; (c) social
network such as clustering coefficient and others.
Mobile data has been used as an alternative to census data [67],[68] and considered to be
used as official statistics source by Indonesian National Statistics Bureau [69].
3.3. Financial Data
Financial records are big data sources that can improve design and implementation of social
policies because:
(i) they are personal data, and depending on the level obtained, i.e. customer level, account
level, or transaction level, the information contained can be very rich.
(ii) they directly provide raw information on personal financial patterns, i.e. spending, saving,
borrowing, investment, insurance.
The combination of financial data and other data sources such as socio-economic background,
market price, location and climate can be a powerful tool to support social, economics and other
relevant aspects in policy decision making and evaluation.
As pointed out previously, however, financial records are biased towards urban and wealthier
population. It is also more likely to cover more educated rather than less or uneducated
population. Consequently, policies that target lower income, rural and less educated residents
are lacking evidence based supports for further improvement from this type of data.
Microfinance data is an alternative data source from microfinance institutions used to
complement the regular financial data. Microfinance institutions provide financial services to
low income population, marginalized groups and non-bankable customers, which make their data
a great source to generate insights on these communities.Together with the United Nation Capital Development Funds (UNCDF), we analyzed customer journey using data from four leading microfinance institutions in Cambodia, which in combination has approximately 21 percent of the total market share [70]. The objective of this study is to provide a background information that is useful to shape national financial inclusion planning and design. The study used The Kaplan-Meier as the primary analytical approach to measure the survival rates (lifetime and failure rates) of lending and saving customers. The study estimated that reducing passive account and borrowers exit each by at least ten percent increases the deposit and loan portfolio significantly to keep the interest rate a↵ordable, as well as reduce a sizable operational cost. The recommendation for policymaking is to design a better product development to improve customer journey and target saving mobilization for women and young customers into the national financial inclusion strategy. 3.4. Crowdsourced data In this section, we will present two case studies on the implementation of data innovation for social goods in public sectors namely Translator Gator and Social Listener. 3.4.1. Case study 1: Translator Gator Translator Gator (TG) is a web-based crowdsourcing platform which combines some gamification elements to collect translation, synonym, categorisation, and evaluation of given keywords in multiple languages. In 2016 and 2017, we created two crowdsourcing translation projects, Translator Gator 1 and 2, to crowdsource the translation, synonym, categorisation, and evaluation of approximately 2,000 words or phrases in English to be translated to targeted languages. Below is a short description of the two projects. Translator Gator 1 had three main aims. First, the public sector in developing countries has quite a limited knowledge to implement a project to collect such a taxonomy, especially when we attempt to monitor public sector’s programs in Indonesia from social media, despite its clear needs. Second, on social media, many linguistic variations, including jargons and slangs, make building a list of keywords more challenging as words, context and, by extension, meaning change from region to region. Third, given the rich linguistic and cultural diversity in Indonesia, this poses some difficulties in that many languages and dialects are used in di↵erent provinces and islands. For instance, ‘electricity blackout’ can be written in various ways even in the national Indonesian language, such as mati lampu, lampu, mati, mati listrik, listrik mati, and pemadaman. It is also worth noting that such linguistic variation issue can be observed in many countries. Translator Gator 1 was launched between January 25, 2016 and May 31, 2016 in Indonesia. We crowdsourced the translation of words or phrases in English related to development for six most spoken languages in Indonesia: Indonesian, Javanese, Sundanese, Minangkabau, Bugis, and Malay. In support of humanitarian and disaster management e↵orts, Pulse Lab Jakarta rolled out Translator Gator 2 to use the wisdom of the crowd to create disaster-related keywords for languages spoken in ten ASEAN countries and in Sri Lanka. The crowdsourcing project was running between April 22, 2017 and July 31, 2017. In the short-term, the project was intended to raise awareness among tech savvy youth in the participating countries of disaster risks, management and response. In the mid- to long-term, the crowdsourced taxonomies will be used for computational social research initiatives, not only to better understand the responses of a↵ected populations before/during/after a disaster, but also to better communicate with them through various channels. For Translator Gator 1, we collected over 109,000 contributions across all tasks from approximately 300 registered users in Indonesia. Two languages reached above the 80% completion rate, Indonesian (100%) and Javanese (80%) [71]. Meanwhile, for Translator Gator 2, we received nearly 1.8 million contributions across 4 tasks. From a total of 29 target languages,
five languages were fully translated and five other languages were 80+% translated. Some of
the top users are based in Vietnam and Myanmar [72].
The results of the crowd-sourcing projects are promising. The projects were able to gather
relatively large number of data from multiple countries. Crowd-sourcing also shows potential in
engaging with the public to contribute to policy development. However, creating a successful
crowd-sourcing project requires skills, and a good understanding of technological skills to support
the project. This means that appropriate investment is needed before starting a project, and
that the project management aspect should also be taken into account.
3.4.2. Case study 2: Social Listener Listening and monitoring social media or citizen voice can
be challenging. Government needs a platform where they can easily listen and monitor what
their citizens are saying in relation to certain topics.
Social listener is a platform that collects, analyze and present information from multiple data
sources, for example: social media data, citizen feedback and so on. The platform shows a
dashboard that monitors conversation from selected data set. To operate it, a user needs to
provide a list of topic and sub-topics of interest. Each sub-topic is represented by keywords or
taxonomy using Boolean search format. These keywords are used as a filter to capture relevant
information from the data and the visualization will be presented in a way where people can
easily extract insights. The platform is able to provide message distributions and its dynamics,
topic cluster and trending topics.
For this case study, we only select two types of datasets, a citizen complaint data from
LAPOR! And social media data from Twitter. LAPOR! is considered as active participation
from public as they need to submit to specific platform, while Twitter is considered as passive
participation from public.
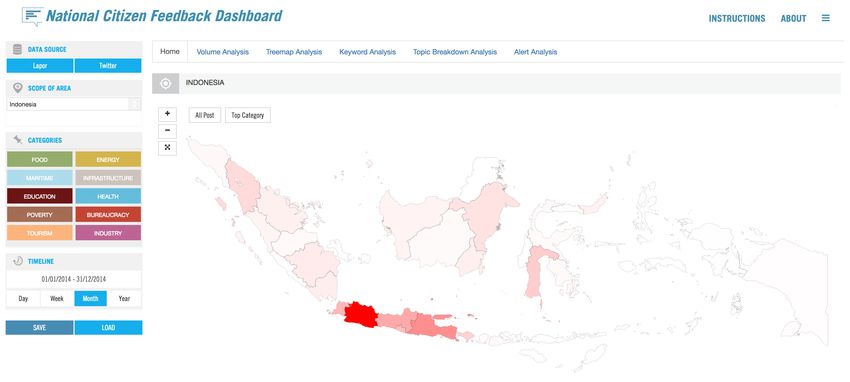
Figure 1. Geographic Distribution at Social Listener Platform
Figure 1 presents general overview of Social Listener for National Citizen Feedback Dashboard
[73] from Twitter data for a year. The left panel of the image shows the data source, from
LAPOR! and from Twitter. Then, ten categorizations relevant to President Joko Widodo
Nawacitas program. The last panel on the left also shows how we control the timeline. The
middle part shows geographic distribution of relevant messages. The dashboard allows users
to go deeper in city level to filter only relevant messages from selected city. The darker colorFigure 2. Topic Breakdown and related keywords means the area has more relevant messages. In this case, Java island has most relevant messages compare to other main islands. Figure 2 shows a visualization of the top category is in the citizens welfare (Bidang Kesehatan Rakyat). To get more detailed results, it also shows that the keywords raskin and subsidi have dominated the conversation. From this case study, we show a few potential applications of public generated data, for example, gathering a large number of data in the context of social policy, and obtaining feedback or input from the public. Nevertheless, there are some limitations and challenges to recreating such a platform. For instance, deciding whether this approach would be a suitable solution to problems identified, how to go about designing the platform to answer objectives, and finding out if we have the ability to manage this project, and so on. On the other hand, we show some potential advantages of using this method: (1) gathering large amount of data with the help of the crowd, (2) the potential utility of gathering near real-time information on public policy issues and their corresponding locations, (3) and by learning how to better listen to citizen, governments can use these voices as part of the policymaking processes, and (4) enhancement of data analysis for prioritization/rapid response and deriving insights from di↵erent citizen feedback. 3.5. Urban Data Along with the rise of the ‘smart city’ and its implementation, digital technologies have increased over the world and across sectors to support traditional city operations. This phenomenon leads into exponential data production from various urban data sources, such as sensors, the Internet of Things (IoT), citizen-generated content, transportation data, administrative data and customer transaction records from the private sector. This abundance of data can be leveraged to support the government in better understanding the dynamics of urban citizens , and further, for developing better local policies. Together with Jakarta Smart City (JSC), we analyzed public transportation passengers behavior by exploring the potential of using transportation records data from smart card AFC (Automated Fare Collection) system administered by Transjakarta, the Jakarta Bus Rapid Transit (BRT), citizen report data on traffic condition, and weather data. We gathered 72,515,002 passenger tap-in data produced by 3,124,174 smart cards with each record containing several information such as (a) corridor ID, (b) station ID, (c) type of transaction, (d) transportation card ID, and (e) transaction timestamp. From the data, we analyze the temporal regularity pattern and classify regular trips that
You can also read