Bikes for All evaluation: summary of overall findings (2018-2020) - Glasgow Centre for Population Health
←
→
Page content transcription
If your browser does not render page correctly, please read the page content below
Bikes for All evaluation:
summary of overall findings (2018-2020)

                Gregor Yates
                Bruce Whyte
     Glasgow Centre for Population Health
                 August 2020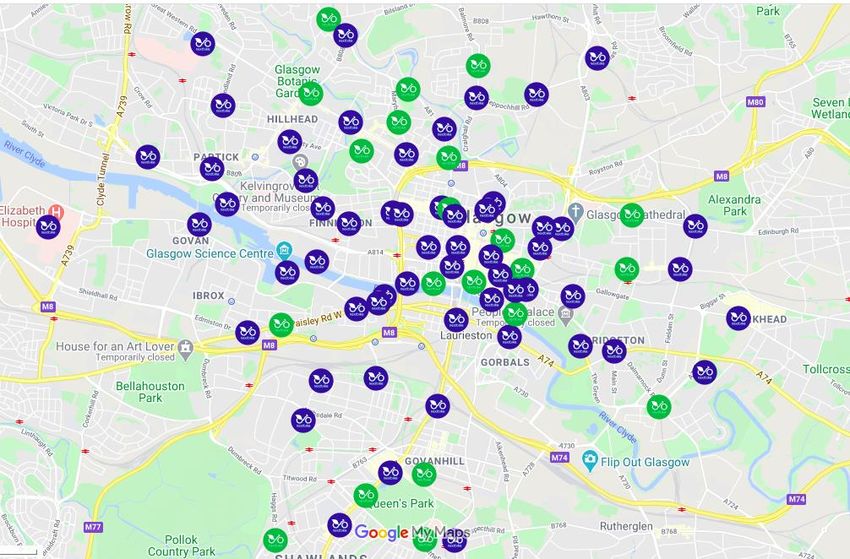
Acknowledgements
The Bikes for All project is managed and evaluated by a partnership of CoMoUK, Bike for
Good, the Glasgow Centre for Population Health, Cycling Scotland and nextbike. The
authors would like to acknowledge the support of members of the Bikes for All steering
group and, in particular, Nina Bocard from Bike for Good, who has managed the delivery of
the project and supported participants to complete the evaluation surveys. This group have
worked together effectively for two years in order to deliver and evaluate the project.

Steering group organisations and members:
CoMoUK: Allie Paige; Harriet Cross; Chris Slade.
Bike for Good: Nina Bocard; Victoria Leiper.
Cycling Scotland: Kath Brough.
Glasgow Centre for Population Health: Gregor Yates; Bruce Whyte.
nextbike: Valentin Ken Niikado.

We would also like to thank the following organisations and community groups for supporting
participation and encouraging their members to sign up over the two-year period:
Migrant Help; Flourish House; Bridgeton Family Learning Centre; Thenue Housing
Association; Central and West Integration Network; Govan Community Project; NHS Restart;
NHS Esteem; Glasgow City Mission; Glasgow Clyde College ESOL; Glasgow Kelvin College
ESOL; SEAL community health (Gorbals); British Red Cross; Youth Community Support
Agency; Night Shelter; Rosemount Lifelong Learning; NG Homes; Crossreach; Springburn
ESOL classes at Glasgow Kelvin College; Community Link practitioners across the city;
NuMe Health and Wellness Project at the Maryhill Hub; Department of Work and Pensions;
and Queens Cross Housing Association.

Finally, we are grateful for the funding received from the European Social Fund in year one
and from Paths for All through the Smarter Choices Smarter Places fund in the year two.

Report authors:
Gregor Yates                                         Bruce Whyte
Public Health Research Specialist                    Public Health Programme Manager
Glasgow Centre for Population Health                 Glasgow Centre for Population Health
Email: Gregor.yates@glasgow.ac.uk                    Email: Bruce.whyte@glasgow.ac.uk

Web: www.gcph.co.uk
Twitter: @theGCPH

                                                                                              1
Contents

Executive summary…………………………………...................................................................3
    1.1 Background and evaluation approach……………………………………………………..5
    1.2 About Bikes for All……………………………………………………………………………5
    1.3 Evaluation of Bikes for All…………………………………………………………………...5
    1.4 Survey components…………………………………………………………………...….....6
2. Profile of respondents…………………………………………………………………………...7
    2.1 Profile of baseline survey respondents…………………………………………………….7
    2.2 Profile of follow-up respondents………………………………………………………....…9
    2.3 Distribution of participants………………………………………………………………….11
3. Findings…………………………………………………………………………………………...13
    3.1 Cycling participation………………………………………………………………………...13
    3.2 Journey types………………………………………………………………………………..15
    3.3 Feedback on support and participation…………………………………………………..15
    3.4 Barriers to nextbike use……………………………………………………………………17
    3.5 Improving the Bikes for All experience……………………………………………………18
4. Discussions and recommendations……………………………………………………………19
    4.1 Discussion of findings………………………………………………………………………19
    4.2 Covid-19 considerations……………………………………………………………………20
    4.3 Recommendations……………………………………………………………………….…21
References……………………………………………………………………………………………22
Appendix 1…………………………………………………………………………………………...23
Appendix 2…………………………………………………………………………………………...24

                                                                                                2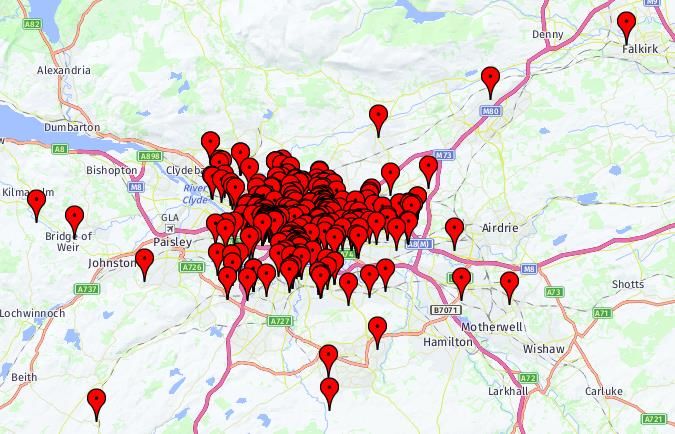
Executive summary

This report summarises feedback from participants involved in Bikes for All (BfA) over a two-
year period (April 2018 to end-March 2020). The project is managed and evaluated by a
partnership of CoMoUK, Bike for Good, GCPH, Cycling Scotland and nextbike, with GCPH
providing evaluation support and Bike for Good being the delivery organisation. The project
continues to be funded and delivered in 2020 without the involvement of GCPH as the formal
evaluation partner.

Information and feedback from participants has been collated through baseline and follow-up
surveys. Survey results presented here follow on from a more comprehensive year one
report published in 2019. Our findings show that BfA has been an effective approach for
encouraging participation in cycling among under-represented groups and minority
population groups from across Greater Glasgow. In year two, Bike for Good staff were able
to engage with an even more socially excluded population, with many more participants
being unemployed and/or seeking aslyum. Year two participants were also less likely to
cycle before signing up, meaning that the project contributed to a greater proportion of new
cyclists in the city over this period. However, it is notable that only modest numbers of older
people have engaged with the project over the two years.

Bike for Good staff provide a range of support and concessions to participants, as well as
offering significantly discounted membership of the nextbike hire scheme (£3). The different
elements of the project (e.g. events, one-to-one support, route advice, women-only rides and
the option to pay by cash) have been found to be useful and have ensured that participants
have received comprehensive support to take up cycling. However, many aspects of
provision were deemed more useful by participants in year one than year two, which
suggests that attention should be paid to how various aspects of the project are delivered in
future years. Similarly, the impact of participation on mental wellbeing, physical health and
fitness, along with knowledge of where to cycle, cycling confidence and financial
circumstances were more likely to be positive in year one than year two. It is worth noting
that the cohort of participants were more likely to be living in challenging circumstances in
year two, and that the majority of participants benefited across the whole two-year period.

The findings presented here reflect the experiences of participants prior to Covid-19. The
continued delivery of Bikes for All will be dependent on careful planning and revision in order
to ensure safe social distancing and to minimise the risk of viral infection. This will mean the
temporarily suspension of group rides and events which bring participants together.

                                                                                                  3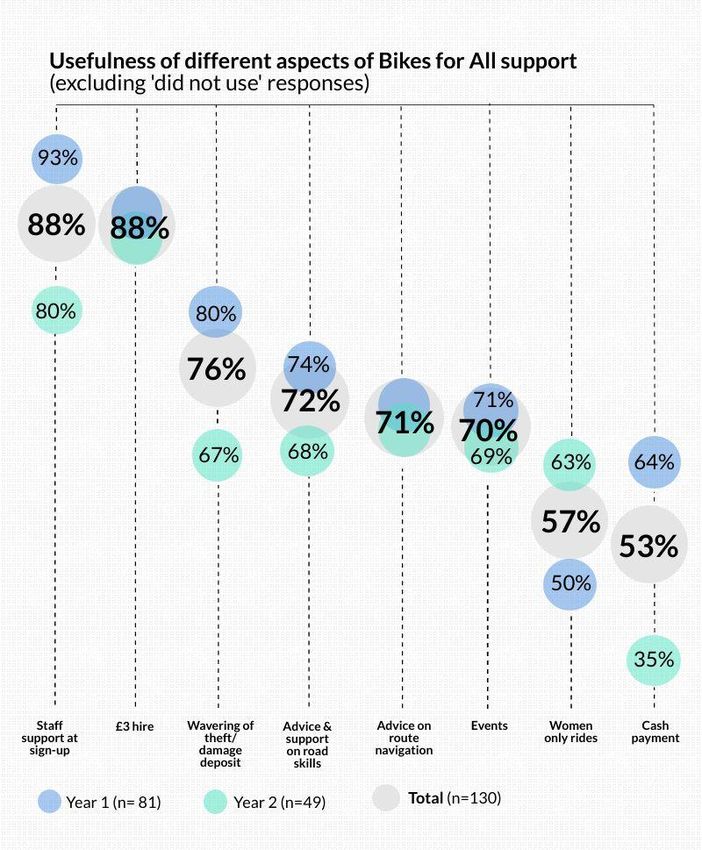
However, given the challenge of social distancing on other forms of transport and the
restrictions on travel for people who do not have access to a car, it is important that cycling
is enabled in ways that are safe, both in terms of traffic and exposure to viral infection.

Glasgow has ambitious climate change targets on which there has been progress during
‘lockdown’ due to an increase in cycling and a reduction in vehicular travel. However, as
Covid-19-related restrictions on movement are eased, there is a risk that car use will
increase to levels beyond that seen in pre-Covid times, in part to avoid public transport use
to reduce potential exposure to viral infection. To help avoid this, we need to ensure that
recent increases in cycling are sustained and built on – with cycle hire being part of this
continued growth – and that access to cycling is promoted in an inclusive manner through
projects like Bikes for All.

                                                                                                  4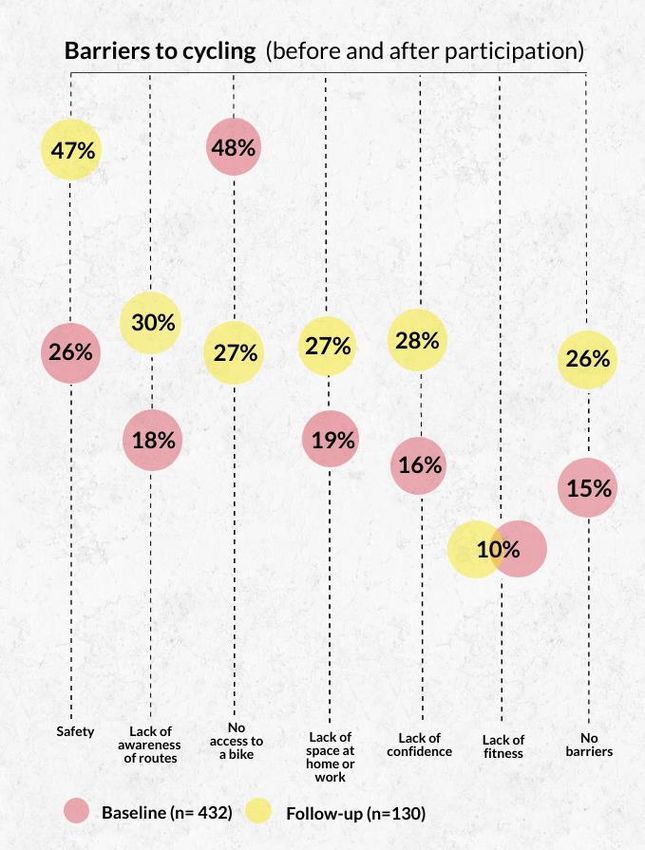
1. Background and evaluation approach

1.1 About Bikes for All

Bikes for All (BfA) is a Glasgow-based project which aims to increase the accessibility of
cycling by breaking down barriers such as ability, confidence or income through the
provision of shared bikes and one-to-one support. The project is delivered by Bike for Good
and has been managed and evaluated by a partnership of CoMoUK, Bike for Good, the
Glasgow Centre for Population Health, Cycling Scotland and nextbike from April 2018 to the
end of March 2020. BfA offers annual membership of the city-wide bike hire scheme,
nextbike Glasgow, for £3. Participants can pay by cash and no bank account is required.
The aim is to reduce inequalities in access to cycling by providing low-cost bike hire and by
reducing barriers to first-time cyclists and people who wish to return to cycling. Additional
support to take up cycling is provided through bike rides for different population groups,
route-finding advice and confidence-boosting road-skill sessions.

Participants have been recruited by Bike for Good staff through their existing relationships
with Glasgow-based community groups. Targeted recruitment has focused on people who
face financial barriers, those not currently cycling or without access to a bike, and population
groups that are less likely to cycle (e.g. ethnic minority groups and women). Between 2018
and 2020, 516 people signed up for Bikes for All, with 224 signing up in year one (April 2019
to end-March 2019) and 292 signing up in year two (April 2019 to end-March 2020).
Participants made 14,673 bike rentals over the two-year period.

1.2 Evaluation of Bikes for All
The evaluation of the programme’s reach and impact has been led by the Glasgow Centre
for Population Health. A comprehensive year one evaluation was published in November
20191. This was based on data retrieved through the baseline and follow-up surveys
reported on here, as well as commissioned qualitative research through focus groups and
one-to-one interviews. The year one report presented substantive background information
that provides additional context to the findings presented here.

For year two, data continued to be collected for the baseline survey (issued at sign-up), and
follow-up survey (issued at least three months after initial participation). Responses to the
follow-up were provided by those willing to take part in further research. It was therefore on a
voluntary basis rather than with an expectation of signing up.

                                                                                                5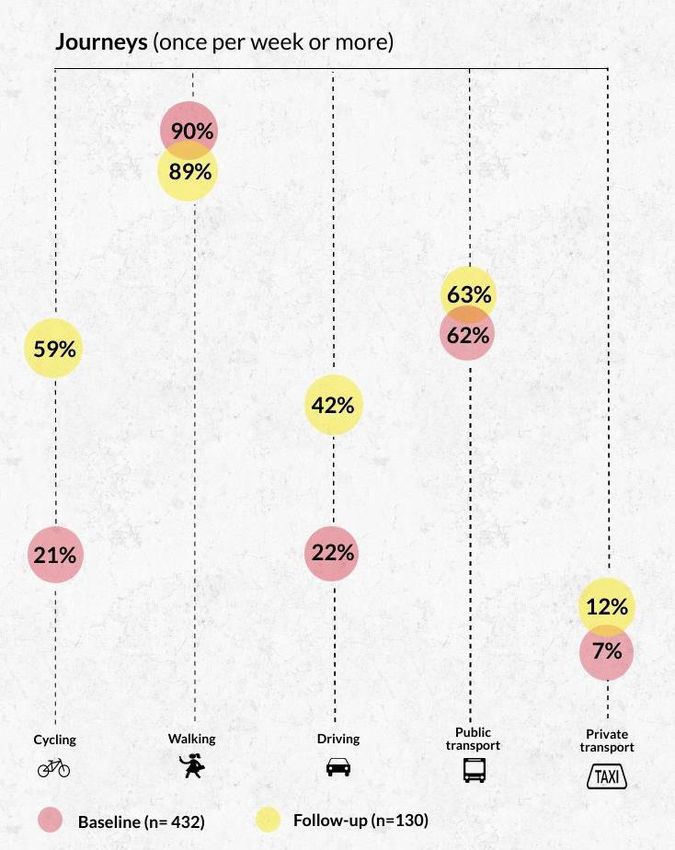
The results presented here cover a two-year period (April 2018 to end-March 2020), and
also draw comparisons between the year one (April 2018 to end-March 2019) and year two
findings (April 2019 to end-March 2020). The purpose of presenting the findings in this way
is to provide an overall picture of the project’s reach and impact over the period and to show
how this changed across both years.

1.3 Survey components
Both the baseline and the follow-up surveys captured information on the socio-demographic
characteristics of participants (i.e. gender, age, ethnicity, work status, living situation,
resident status and home postcode), as well as information on each participant’s general
health, their current levels of physical activity and the perceived barriers to cycling. The
follow-up survey included additional questions to assess the impact of participation. Data
were captured over a 24-month period from April 2018 to the end of March 2020. In total,
432 participants completed the baseline survey (84% of all participants) and 130 completed
the follow-up survey (25% of all participants and 30% of baseline survey respondents).
Differences in the results presented here between year one and year two through follow-up
responses should be treated with some caution due to the relatively low response rate in
year two (see Appendix 1).

                                                                                               6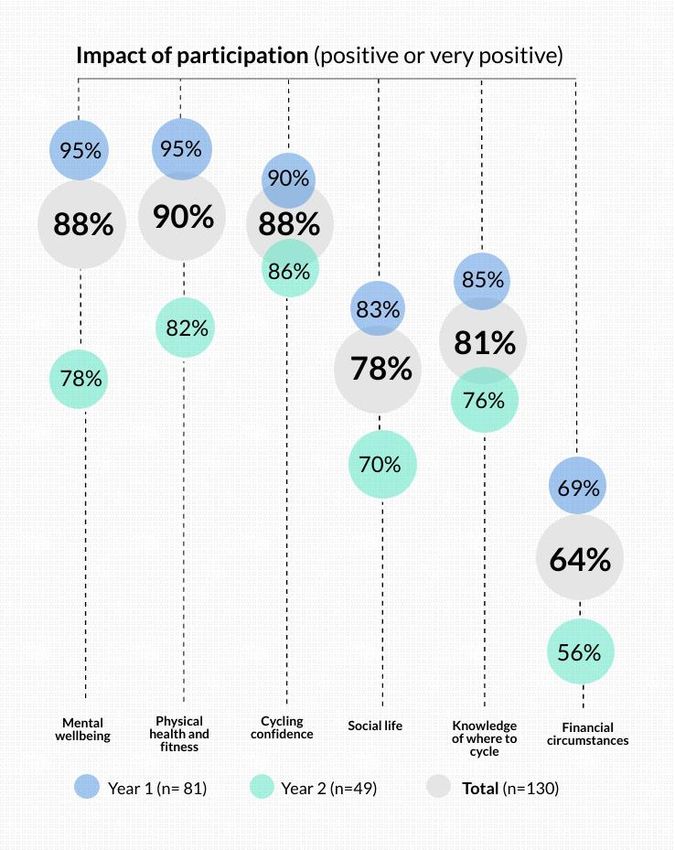
2. Profile of respondents

This section sets out the demographic profile of baseline and follow-up survey participants.
This is important for understanding who took part and how results from baseline to follow-up
should be compared and interpreted.

2.1 Profile of baseline survey respondents

The demographic profile of baseline survey participants is provided in Table 1a. These are
presented for year one, year two and both years combined to give a demographic profile of
participation throughout the programme. This shows that the gender split of participants was
consistent across both years with slightly more men than women signing up, and that more
young people (aged 16-24) participated in year 2. There was also a doubling in the
percentage of unemployed people taking part (28% to 57%) and an increase in homeless
participants (9% to 26%) and asylum seekers (26% to 46%) in the second year. Eleven
percent of participants selected ‘other’ as their work status, with most of these participants
defining this in terms of being an asylum seeker or refugee, a small number citing illness or
recovery from illness, and others having a disability or having caring responsibilities. For
those answering ‘other’ in relation to living situation (31%), most (n=60) were waiting to be
housed or living in temporary accommodation, some were staying with friends or relatives
(n=13) and a small proportion were in supported accommodation (n=6), sheltered
accommodation (n=5), housing association accommodation (n=3) or a hostel (n=3). Finally,
as perhaps is expected given the increased number of homeless participants in year two,
fewer had access to a bike at home. Bike for Good staff were commended in year one for
reaching population groups that were less likely to cycle due to personal or financial barriers.
In year two, those signing up were even more likely to face social exclusion or barriers to
participation in various ways, including people living in precarious circumstances. This is
perhaps testament to the good working relationships that Bike for Good developed with the
city’s integration, housing and homeless organisations over the course of the project.

a
 Some columns may not add up to 100% due to rounding. For work status, columns may add up to
over 100% as participants were able select more than one response option.

                                                                                                 7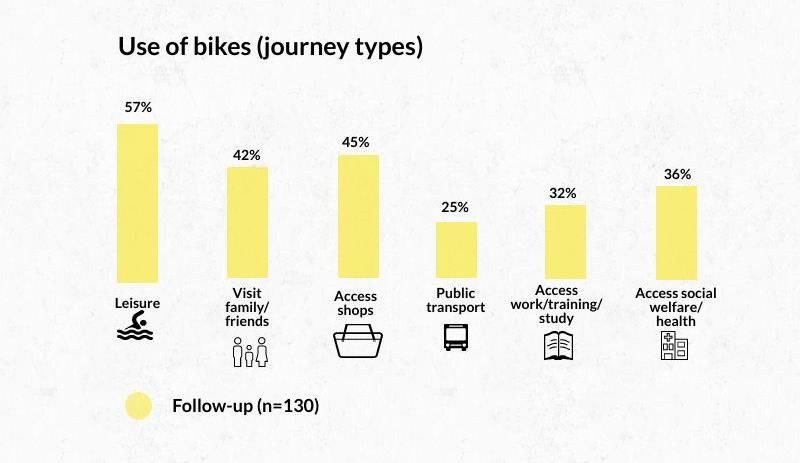
Table 1. Demographic profile of baseline survey respondents.

Baseline survey             Year one (n=189)      Year two (n=243)      Total: (n=432)

Time of data capture        Mar 2018 - Apr 2019   Apr 2019 - Apr 2020   Mar 2018 - Apr 2020

Gender
Male                        55%                   57%                   56%

Female                      42%                   43%                   43%
Prefer not to say / other   3%                    0%                    1%
Age
16-24                       17%                   26%                   22%
25-44                       58%                   54%                   55%
45-64                       24%                   18%                   21%
65+                         1%                    1%                    1%
Ethnicity
BME                         49%                   50%                   50%
Work status
Full time                   22%                   4%                    12%
Part time / temporary       14%                   9%                    12%
Unemployed                  28%                   57%                   44%
Retired                     4%                    3%                    4%

Student                     24%                   20%                   22%
Other                       13%                   9%                    11%
Living situation

Own / mortgaged             24%                   11%                   17%
Rent (private / social)     35%                   23%                   28%
Homeless                    9%                    36%                   24%
Other                       32%                   30%                   31%
Residency
UK resident                 61%                   39%                   48%
Seeking asylum              26%                   46%                   38%

Refugee status in UK        10%                   14%                   12%
Prefer not to say / other   3%                    1%                    2%

Access to transport at home

Bike                        21%                   12%                   16%

Car                         n/a (not asked)       15%                   15%

                                                                                              8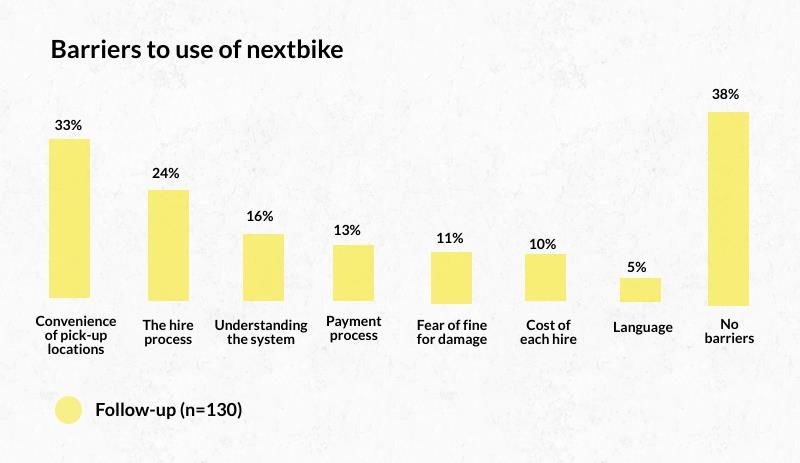
2.2 Profile of follow-up respondents
The follow-up survey was completed by baseline survey respondents who were willing to
take part in further research at least three months after participation. In total, 130 participants
(30% of baseline respondents) completed the follow-up survey over the two-year period; 81
participants in year one and 49 in year two. When comparing differences in results from the
baseline survey to the follow-up, it is important to be aware of the demographic differences
between these two sets of respondents. Data collected on follow-up respondents shows that
there was a slightly more even gender split than there was for the baseline survey; there was
an older age profile, there were fewer BME respondents (37% versus 50%); fewer were
unemployed (27% versus 44%); more owned their own property (29% versus 17%) and
fewer were seeking asylum (17% versus 38%). These differences are perhaps inevitable
due to language barriers, the transient nature of this population and the precarity of some
participants’ living situations. Differences observed in the results between the baseline
survey and the follow-up should therefore be considered on the basis that the follow-up
sample is a less socially excluded population.

                                                                                                 9
Table 2. Demographic profile of follow-up survey respondents.
Follow-up survey Year one (n=81) Year two (n=49) Total: (n=130)
Time of data capture March 2018 - April 2019 April 2019 - April 2020 April 2018 - April 2020
Gender
Male 52% 55% 52%
Female 47% 45% 47%
Prefer not to say/ other 1% 0% 1%
Age
16-24 12% 9% 12%
25-44 54% 50% 53%
45-64 29% 36% 31%
65+ 5% 5% 5%
Ethnicity
BME 40% 43% 41%
Work status
Full time 19% 12% 16%
Part time/temporary 16% 18% 18%
Unemployed 23% 36% 27%
Retired 7% 6% 7%
Student 32% 16% 27%
Other 9% 6% 11%
Living situation
Own/mortgaged 32% 24% 29%
Rent (private/ social) 36% 42% 38%
Homeless 21% 18% 20%
Other 11% 16% 13%
Residency
UK resident 63% 60% 63%
Seeking asylum 16% 20% 17%
Refugee status in UK 15% 18% 16%
Prefer not to say/other 6% 2% 4%
102.3 Distribution of participants
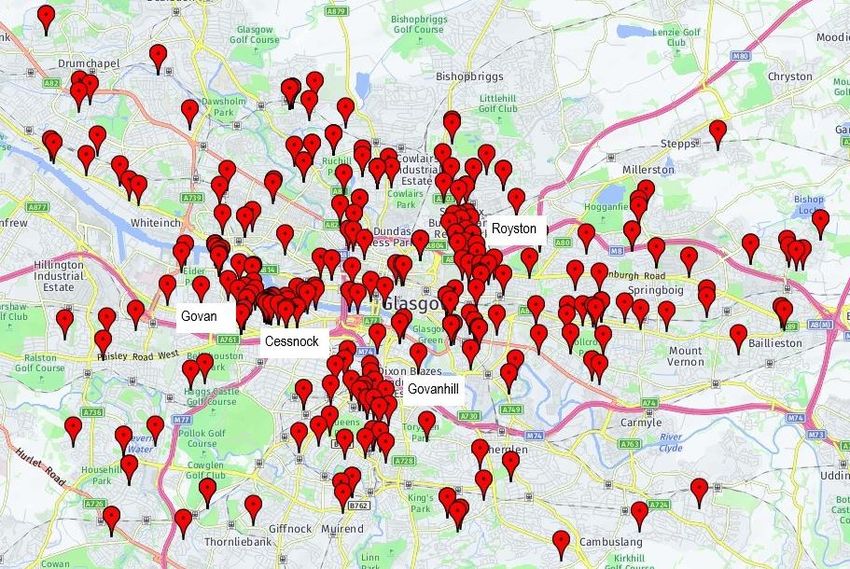
Figure 1 shows the location of nextbike stations across Glasgow. Stations marked by a
green symbol indicate where it is also possible to hire an e-bike. The map shows that many
of the stations are clustered in city-centre areas and the west of the city. However, recent
expansion has seen growth in the number of stations to the south, east and north. Figures 2
and 3, meanwhile, show the distribution of Bikes for All participants across Greater Glasgow
and Scotland. These maps show that people took part from across Greater Glasgow and
beyond, with many not having a nextbike station next to their residential address. Figure 3
shows clustering of participants around Govan, Cessnock, Govanhill and Royston.
Figure 1: Map of nextbike station locations.
Source: nextbike
11Figure 2: Postcodes of Bikes for All participants (all areas of residence).
Figure 3: Postcodes of Bikes for All participants (Greater Glasgow residents).
123. Findings
Findings included here are primarily presented for the full two years of the project, although
comparisons are made between year one and two where notable differences were found.
Appendices 1 and 2 present the responses to all survey questions in a tabulated form.
3.1 Cycling participation
The main barriers to cycling before and after participation are presented in Figure 4. This
shows that respondents were more likely to consider most factors to be a barrier after
participation. In particular, safety, lack of awareness about where to cycle, lack of confidence
and a lack of storage space at home or at work were all more likely to be barriers after
participation. As perhaps would be expected with participation in this project, no access to a
bike was less likely to be a barrier afterwards and more people felt that there were no
barriers at this point. Figure 5 shows how participants travelled (at least once a week) before
and after taking part in the Bikes for All project. This shows a considerable increase in
cycling from 21% to 59%, but little change in other forms of travel other than driving, which
increased from 22% to 42%. It is worth noting that follow-up respondents are a less socially
excluded population (i.e. more likely to own or have access to a car). Appendix 1 includes
information on participants who never used different modes of transport. This shows that
63% never cycled before signing up, compared with 18% afterwards. The percentage who
never cycled before participation was higher in year two than year one (71% versus 52%).
13Figure 4: Barriers to cycling. Figure 5: Journeys (once per week or more).
143.2. Journey types
Figure 6 shows the percentage of participants using bikes for different journey types after
participating in the Bikes for All project. The most common type of journey was for leisure
purposes, followed by accessing the shops and visiting friends and family. A quarter of
participants used bikes to access other forms of transport. The main difference between year
one and year two was a reduction in participants visiting friends or family (see Appendix 2).
Figure 6: Journey types.
3.3 Feedback on support and participation
Figure 7 shows how useful participants felt various aspects of the project were (follow-up
responses). These results cover the two-year period (in grey) but are also presented for year
one (in blue) and year two (in green) to show differences over these time periods. Results
were more positive in year one than year two, but these differences were generally small.
The two exceptions to this were women-only rides, which were more likely to be useful in
year two, and cash payments to hire a bike, which around a third found useful in year two
compared with two thirds in year one. Figure 8 shows the impact of participation on a range
of factors over the two-year project. Overall, the impact on programme participants has been
very positive for their health and wellbeing, cycling confidence and in relation to their social
lives. While the impact on financial circumstances is lower, over the two years nearly two-
thirds of participants noted a positive impact on their financial circumstances. While these
differences are worthy of note, the low response rates in year two means that they should be
treated with some caution.
15Figure 7: Usefulness of support. Figure 8: Impact of participation.
16Participants were also asked to comment on the financial impacts of taking part. Responses
to this question largely mirrored those reported for year one (i.e. reduced public transport
costs, reaching employment more easily, that financial benefits were only possible when the
weather permitted travel by bike, and for some, that no financial benefits were experienced).
In year two, some comments indicated that considerable savings were made.
“I have saved £150 for three months.”
“Saved us a lot of money, we don't use buses or trains much at all now.”
“Especially for the short trips, nextbike saved a lot of money.”
As well as providing large savings, some comments indicated that transport poverty had
been alleviated (that a lack of money was no longer preventing people from travelling).
“When I have had no money for bus fare, I have used a ‘bikes for all’ bike to get to
appointments or things like that that I need to get to.”
“Knowing there is a mode of affordable transport available to me if I get in a fix is
hugely reassuring.”
Questions were also included in both the baseline and follow-up surveys asking how
participants perceived their own general wellbeing and health and the amount of exercise
they were undertaking. These questions revealed only small increases in positive results
from baseline to follow-up, albeit from an already high starting point (see Appendix 2).
3.4 Barriers to nextbike use
Figure 9 presents the barriers to nextbike use for participants over the two-year project
period. Differences between year one and year two are presented in Appendix 2. This shows
that although major differences were not found for most of the barriers listed, fewer
participants in year two felt that the convenience of pick-up locations were a barrier (26%
versus 38%), a higher percentage felt that cost was a barrier (14% versus 7%) and more felt
that there were no barriers (44% versus 35%). Improvements relating to the convenience of
pick-up locations from year one to year two perhaps reflect the expansion of nextbike over
this period, with better reach in the north, east and south of the city. The hire process
remains prohibitive or confusing to around a quarter of participants, although a step-by-step
guide on how to hire a bike developed during the project should support more people to
overcome this barrier if it was made widely available.
17Figure 9: Barriers to nextbike use.
3.5. Improving the Bikes for All experience
In year one, open-ended comments on how the experience of Bikes for All could be
improved were offered in relation to:
increasing the number of nextbike stations
expectations being met/improvements not being needed
better bike maintenance
issues relating to the return or pick-up of bikes
the design or comfort of bikes.
(Listed in order from most commonly to least commonly mentioned.)
In year two, further comments were made on the benefits of the project and on increasing
the number of stations. Comments relating to desired expansion were mainly attributed to
the north and the east of the city, as well as beyond the current western station limits. It was
suggested that new stations should be within residential areas to allow easier access.
“It would be good if the pick-up point for bikes for all were closer to where people
reside. I think the bikes would be used more often then.”
Other suggested improvements included bike repair or road safety sessions, offering more
time for free, extending the project to include e-bikes and offering WiFi at stations.
184. Discussion and recommendations
4.1 Discussion of findings
Findings for the two-year period largely mirror those presented for year one; in summary that
a diverse pool of people from across Greater Glasgow took part and the impacts of
participation were positive for most. In year two, Bike for Good staff were able to engage an
even more socially excluded population, with many more participants being unemployed
and/or seeking aslyum. This is a positive development that will accelerate the diversification
of cyclists across Glasgow.
The project successfully engaged participants from ethnic minorities. Over 200 Bike for All
participants were from a Black or minority ethnic background, representing 50% of all
participants. This is important because we know that people from ethnic minority groups
currently cycle less than White people, but more people from ethnic minority groups want to
start cycling than any other group – 55% of people from ethnic minority groups who currently
do not cycle would like to start2.
Year two participants were less likely to cycle before signing up, meaning that the project
contributed to a greater proportion of new cyclists in the city over this period. However, it is
notable that only modest numbers of older people have engaged with the project over the
two years. This may be due to the types of organisations that Bikes for All staff have worked
with, but it might also reflect a lack of confidence to cycle in this population group.
In keeping with findings presented for year one, perceived barriers to cycling tend to
increase after participation. In particular safety is a concern for many, and it is clear that
overcoming some barriers will require investment or support beyond that which is possible
through this project. The issue of safety was highlighted in a recent report on cycling
intentions post-‘lockdown’, where new cyclists expressed a strong wish to see more
dedicated cycle lanes as a means of encouraging them to continue cycling after once Covid-
19-related restrictions on movement were lifted3.
As expected, people were much more likely to use a bike to complete journeys after signing
up, but it it is notable that cycling did not appear to displace other modes of transport. This
suggests that participation in Bikes for All and access to a nextbike generally extended the
transport options available to people and allowed them to access other forms of transport to
connect journeys. Comments on the financial impacts of participation showed that for some,
19all other forms of travel were unaffordable. This meant that cycling was the only viable way
of getting around the city for longer journeys.
As already stated, the impacts of participation across a range of factors, including health,
cycling confidence, social life and financial circumstances, were positive for most. However,
these impacts were more likely to be positive in year one than two. Similarly, many aspects
of provision were deemed to be more useful by participants in year one, which suggests that
some attention should be paid to how the project is delivered in future years. These factors
should be considered alongside feedback on how the experience could be improved, which,
while also mirroring some of the feedback from year one – such as increasing the number of
stations, maintaining bikes better and resolving issues relating to the pick-up or return of
bikes – included offering more time for free, offering e-bikes and providing WiFi at stations.
These suggestions would be worth considering if funding became available to deliver them.
Additional considerations will be needed in light of the Covid-19 pandemic, such as
measures to reduce the likelihood of viral transmittion through surface contact and a
reduction in activities that bring participants together.
4.2 Covid-19 and climate change
These findings reflect project impacts prior to the arrival of Covid-19 and the subsequent
‘lockdown’ from March 23rd 2020. Restrictions on movement and the need to practise social
distancing present both opportunities and challenges for shared use forms of travel.
Although nextbike suggests that shared-use bikes present a low risk for virus transmission4,
this risk is greater than it is for bike owners or those undertaking non-contact forms of travel.
However, to minimise the risk of transmission, nextbike have taken several measures,
including ensuring that their own staff disinfect bikes when arriving and leaving a workshop
and advising users to wash their hands before and after use and wearing gloves if possible3.
With cycling being promoted5 and replacing other forms of physical activity during the
lockdown phase, there is an opportunity to capitalise on this temporary change in the longer
term. Indeed, a survey of cyclists during lockdown showed that 14% intended to cycle more
once lockdown restrictions on movement were lifted3. Opportunities to expand cycling
infrastructure are already being considered across many cities, with the creation of
temporary cycle lanes facilitating the increased demand while also enabling safe social
distancing6. The requirement for social distancing may change in months to come, but the
increased demand for cycling should continue to be considered in relation to how space is
allocated in urban areas. As public transport continues to operate at reduced capacity, there
is a strong case to expand bike hire schemes – and associated projects which support their
20use – and to invest further in cycling infrastructure. The decision to offer free hire for the first
30 minutes of nextbike use in Glasgow over an eight-week period7 (beginning at the end of
June 2020) is a welcome short-term measure, but many bike schemes and associated
projects rely heavily on short-term funding. More substantial and longer-term investment
would allow bike hire providers and partners to plan for the future and encourage longer term
travel behaviour change. This may be particularly important for facilitating city journeys that
are too far for people to walk, and with car journeys showing the greatest rebound after
lockdown8, those without access to a car should have a safe alternative to public transport.
Despite being overshadowed by the pandemic in recent months, tackling climate change
remains an important public health challenge. Since the beginning of lockdown, restrictions
on travel have reduced carbon emissions and improved air quality, with data collected
across major UK cities showing that although changes in air quality have varied considerably
across cities, all have experienced improvements due to a reduction in vehicular travel9. For
Glasgow, the reduction in vehicular traffic has significantly advanced efforts towards
reaching its target of becoming carbon neutral by 2030, and a return to pre-Covid pollution
levels would be a missed opportunity and a backwards step. The lockdown period has
provided an insight into what cities could look like in the future, while also highlighting the
powers that governments have at their disposal to influence travel behaviour, should
intervention be deemed necessary in the interests of public health.
4.3 Recommendations
Recommendations offered after year one remain relavant and should be considered
alongside those offered here. These were for the providers of bikes (nextbike and Glasgow
City Council), Bikes for All partners, others looking to implement similar projects elsewhere
and for organisations that have the resources to improve conditions for cyclists. Taking these
different interests into consideration and acknowledging the new context that we are now
living in, our recommendations at the end of year two are as follows:
1. Bike for Good staff should continue to encourage participation from socially excluded
people and those furthest from participating in cycling activity. Further consideration
should be given to how older people could be encouraged to take part, perhaps
through the inclusion of e-bikes if affordable.
2. Bike for Good should consider opportunities to improve aspects of project provision
where participant satisfaction levels have reduced from year one to year two. This
should include consideration of measures that may be necessary due to social
distancing and infection control.
213. Bike for Good should continue to collect information on who is participating and the
impact of their participation.
4. Consideration should be given to other complementary delivery models, including
opportunities for participants to be referred to Bikes for All through social prescribing.
5. As an alternative to public transport and a move towards de-carbonisation,
investment in bike hire schemes and other individual sustainable forms of travel
should be prioritised.
6. Investment should contuinue for safe permanent cycling infrastructure, with
consideration given to how roads and spaces can be reallocated for walking and
cycling where appropriate.
22References
1
Yates G, Whyte B. Bikes for All: Widening access to cycling through social inclusion. Glasgow:
GCPH; 2019. Available at:
https://www.gcph.co.uk/publications/911_bikes_for_all_widening_access_to_cycling_through_social_i
nclusion (accessed June 2020)
2
Burns T, Oram MM, Claris S. Cycling for Everyone: A guide for inclusive cycling in cities and towns.
Bristol: Sustrans & Arup, 2020. https://www.sustrans.org.uk/our-blog/research/all-themes/all/inclusive-
cycling-in-cities-and-towns/ (accessed: August 2020).
3
Cycling Scotland. New lockdown cycling survey. https://www.cycling.scot/news-article/new-
lockdown-cycling-survey (accessed June 2020).
4
Nextbike UK. Covid-19 information. https://www.nextbike.co.uk/en/glasgow/covid-19-information/
(accessed June 2020).
5
Scottish Government. Scotland’s route map through and out of the crisis. Edinburgh: Scottish
Government: 2020.
6
Sustrans. Life after lockdown: Briefing paper 1. Transport in the UK will never be the same, it must
be better. Bristol: Sustrans; 2020.
7
CoMoUK. Free Bike share in Scottish cities as lockdown eases. https://como.org.uk/free-bike-share/
(accessed July 2020)
8
Transform Scotland. Just Recovery. Reversing the lockdown inequalities. Edinburgh: Transform
Scotland; 2020.
9
National Centre for Atmospheric Science. Air pollution falling across UK cities, latest data shows.
https://www.ncas.ac.uk/en/18-news/3057-air-pollution-falling-across-uk-cities-latest-data-shows
(accessed June 2020).
23Appendix 1. Questions included in baseline and follow-up (2019-2020 and 2018-2020).
Baseline Baseline Follow-up Follow-up
Survey
(n=243) (n=432) (n=49) (n=130)
Time period 2019-2020 2018-2020 2019-2020 2018-2020
Barriers to cycling
Safety 20% 26% 44% 47%
Lack of awareness about routes 14% 18% 30% 30%
No access to a bike 58% 48% 28% 27%
Lack of space at home or work 14% 19% 26% 27%
Lack of fitness 7% 10% 6% 10%
Lack of confidence 14% 16% 32% 28%
No barriers 15% 15% 32% 26%
Feelings and behaviour
Rate general health as good or 81% 78% 76% 80%
very good
Undertaken more than 60 mins 72% 65% 70% 66%
of physical activity in last week
Journeys (once per week or more)
Cycle 19% 21% 66% 59%
Drive 16% 22% 36% 42%
Walk 92% 90% 90% 89%
Private transport 5% 7% 10% 12%
Public transport 62% 62% 60% 63%
Journeys (never use this mode of transport)
Cycle 71% 63% 18% 18%
Drive 78% 66% 48% 47%
Walk 5% 6% 4% 5%
Private transport 77% 67% 54% 51%
Public transport 24% 19% 14% 9%
24Appendix 2. Follow-up survey results (year one, year two and total).
Follow-up survey Year one (n=81) Year two (n=49) Total (n=130)
Impact of participation (positive or very positive)
Mental wellbeing 95% 78% 88%
Physical health and fitness 95% 82% 90%
Cycling confidence 90% 86% 88%
Social life 83% 70% 78%
Knowledge of where to cycle 85% 76% 81%
Financial circumstances 69% 56% 64%
Use of nextbike
Leisure activities 58% 52% 56%
Visit family and friends 47% 32% 42%
Access shops 44% 46% 45%
Access social welfare/health 33% 28% 32%
Access work/ training/ study 33% 38% 36%
Access public transport 25% 25% 25%
For pleasure - 23% 23%
Perceived barriers to the use of nextbike Glasgow
Convenience of pick-up/ 38% 26% 33%
drop-off locations
Hire process (unlocking/ 26% 22% 24%
returning)
Understanding the system 17% 14% 16%
Payment process 14% 12% 13%
Fear of fine for damage/ theft 10% 14% 11%
Cost of each hire 7% 14% 10%
Language 5% 4% 5%
No barriers 35% 44% 38%
25Usefulness of different aspects of Bikes for All (‘very useful’) excluding ‘did not
use’ responses*
Women-only rides 50% 63% 57%
Cash payment 64% 35% 53%
Events 69% 71% 70%
Advice on route navigation 71% 71% 71%
Advice and support on road 74% 68% 72%
skills
Wavering of theft/damage 80% 67% 76%
deposit
£3 hire 88% 88% 88%
Support staff at sign-up 93% 80% 88%
*The number (n) of responses to this question is lower than other questions due to the exclusion of
‘did not use’ responses.
26You can also read