Bird talk 2021 Yearstarter: Solving the Pandemic Crisis - IBON - IBON Foundation
←
→
Page content transcription
If your browser does not render page correctly, please read the page content below
bird                                                                   IBON

talk
Economic and Political Briefing

2021 Yearstarter:
Solving the Pandemic Crisis

                                  IBON Economic and Political Briefing l 09 February 2021   1
09 February 2021
114 Timog Avenue
Quezon City 1103
Philippines
Tel. nos: +632 8927-7060 to 61
Fax: +632 8929-2496
www.ibon.org
2 IBON Economic and Political Briefing l 09 February 2021T he year 2021 got off to an ominous start. The post-holiday number of daily COVID-19 cases
more than doubled and the country’s biggest ever economic contraction was confirmed
– while the administration adopted a self-congratulatory posture of being on the path
of recovery. Relentless attacks on critics continued with extrajudicial killings of activists and
incursions in schools and universities.
An honest reading of the situation easily points to what needs to be done as well as where the
government response has been and remains most lacking.
IBON Economic and Political Briefing l 09 February 2021 3Ill-prepared, poor response
The Duterte administration is responsible for the biggest recorded economic collapse in the country’s
history in 2020.1(See Chart 1) This was due to the government’s excessive lockdowns and community
quarantines which, apart from failing to contain the pandemic, were aggravated by the lack of any real
economic stimulus.
The COVID-19 pandemic hit all countries equally last year.
PH gov’t response Governments however responded unequally and the Philippine
response is among the most feeble.2 The country has the weakest
among the weakest in COVID-19 response among the major economies of Southeast Asia.
Southeast Asia (See Annex 1) Many other countries that had lower credit ratings
than the Philippines were not so hesitant and spent relatively more to
boost their economies.
The result is the country having among the worst health and economic outcomes in the region. The
pandemic continues to spread and the Philippines is consistently in the top three countries with the
most active cases and, per million population, the most cases and deaths from COVID-19. (See Annex 2)
In terms of economic growth, the Philippines has the worst performing economy in ASEAN and is set to
have the worst performing to as far away as South Asia and the rest of East Asia. (See Annex 3)
The government meanwhile appears indifferent to the adverse economic impact weighing most heavily
on the poor and low-income households who make up the majority of the population. Respectable
emergency relief at the start of the lockdowns has dwindled to token levels even as corporations are
supported with income tax cuts, cheap credit, and infrastructure projects.
The administration’s original and continuing sin is its failure to contain the pandemic with more
rational and calibrated measures. It missed the boat of immediate border controls and early
rapid detection with judicious quarantines and speedy isolation. This made COVID-19 even more
unmanageable and set the stage for deep economic collapse.
Even when the government
Chart 1. Annual GDP growth, 1948-2020 (at constant 2018 prices; in %) started to act, its approach was
overly militarist and vaccine-
20
fixated. Testing, tracing,
quarantines and isolation were
15 insufficient to control the spread
of the coronavirus last year and
10 are still slow today. (See Annex 4)
Growth rate (%)
5 The protracted and anarchic roll-
out of the national vaccination
- program fuels distrust of national
1950 1960 1970 1980 1990 2000 2010 2020 government efforts as well as
(5)
stokes post-Dengvaxia controversy
doubts about vaccination
itself. Local government units
(10) (LGUs) that have taken to early
Source: Philippine Statistics Authority National Accounts of the Philippines independent initiatives risk
vaccine localism that, on a wide
1 Philippine gross domestic product (GDP) only started to be recorded after World War II.
2 In January 2021, the Lowy Institute ranked the Philippines’ COVID-19 response as the 79th worst of 98 countries worldwide.
Earlier, in September 2020, the Lancet COVID-19 Commission ranked the Philippines 65th out of 91 countries worldwide.
4 IBON Economic and Political Briefing l 09 February 2021enough scale, could subvert rational prioritization and sequencing of vaccine recipients. There is already
a clear bias emerging with LGU vaccine initiatives inversely related to LGU poverty levels – vaccine
programs are concentrated in richer LGUs while poorer LGUs have none. (See Annex 5)
A year into the pandemic and despite lessons from other East Asian countries, Filipinos are still
given the false choice of public health or the economy. The over-reliance on a long and harsh
lockdown and insistence on protracted community quarantines does not just choke economic activity
but also causes undue business closures and joblessness. Yet despite these strict measures, COVID-19
continues to spread and cause deaths.
The government boasts about slowing infections since the middle of last year. But infections are slowing
in virtually every other country in the region – including those that did not impose extensive community
quarantines as damaging and as long as the Philippines did, and including economies that have done
much better.
Spend less, suffer more
The lack of a real fiscal stimulus made the lockdown-heavy economic collapse even worse. By the
middle of last year, the main binding constraint to growth was the hugely depressed aggregate demand
from troubled enterprises, soaring joblessness, and falling household incomes.
The economic managers however insist on prioritizing credit ratings over an expansionary fiscal policy.
The counterproductive reluctance to spend hinders additional emergency cash subsidies, support to
small businesses, and expanding social services. Yet these would greatly improve household welfare as
well as boost aggregate demand and spur recovery.
The administration boasted a Php2.57 trillion response to COVID-19,
Lack of fiscal stimulus which was mostly smoke and mirrors. The grandiose “4-Pillar
worsened the Socioeconomic Strategy Against COVID-19” was bloated by including
not just direct fiscal measures but also various liquidity measures, over-
economy’s collapse estimated incremental loans to enterprises, and corporate income tax
cuts – altogether accounting for some Php1.83 trillion or some 71% of
the value of the so-called response.
The economic managers in a way misrepresent these as actual investments or economic activity. The
overwhelming bulk of these measures are more accurately represented as ‘pushing on a string’.
The logic of additional liquidity in the financial system is that this supposedly provides enterprises and
even consumers with cheap financing for their spending. Yet despite markedly falling interest rates, loan
growth continues to fall dramatically. (See Annex 6) In December, loans turned negative for the first
time in 16 years which indicates that lack of investible funds is not the main problem.
This actually continues a trend since 2018 which is another sign of economic weakness even before the
pandemic. As it is, non-performing loans have already doubled to 3.4% of total loans by the end of
2020 which is the hghest in a decade. (See Annex 7)
Repeated government announcements of hundreds of billions of pesos spent for COVID-19 response
gave the impression of a hefty fiscal stimulus.
Yet the overall increase in government spending last year was actually unexceptional just when the
economic collapse was at its worst. The Php3.69 trillion in national government disbursements in the
first 11 months of 2020 was an 11.6% increase from the same period the year before. This is however
actually less than the 13.6% average annual increase in the same January-November months over the
period 2017-2019. There was no stimulus in 2020.
IBON Economic and Political Briefing l 09 February 2021 5Moreover, if the eventual full Chart 2. National government spending, 2017-2022* (% growth)
year spending increase in 2020
from the year before is more or 25
23.6
less around the 11.6% reported
for the first 11 months, then
this will be even less than the 20
programmed 13.6% increase in
the 2020 General Appropriations
Growth rate (%)
Act (GAA) from the 2019 GAA. 15
13.6
(See Chart 2) This means that
11.5
government spending last year 9.9
did not even increase as much as 10
8.6
was originally budgeted. 6.5
The unexceptional spending last 5
year is not inconsistent with
the seemingly large Php505.2
billion in COVID-19-related -
releases. These releases were not 2017 2018 2019 2020 2021 2022
really additional spending but * - 2022 data is based on projections as per DBM and 178th DBCC Meeting
rather basically realigned from
Sources: Department of Budget and Management (DBM) Budget of Expenditures and
discontinued activities and special Sources of Financing, and Development Budget Coordination Committee (DBCC)
purpose funds, charged to regular
agency budgets, or used erstwhile unutilized appropriations. This was not new exceptional spending
on top of existing budgets which is what would count as a real stimulus effort.
The projected spending increase this year – still in the middle of the pandemic and economic crisis –
will be even less. Contrary to economic managers’ claims, the national budget for 2021 is not a stimulus
budget and there is no significant increase in spending.
The Php4.5 trillion 2021 national budget is only 9.9% bigger than the
The 2021 national 2020 GAA. This is smaller than the historical annual average increase of
11.1% for the past four decades and even smaller than other spending
budget is not a increases of the Duterte administration in 2017 (23.6%) and 2020
stimulus budget (13.6%). (See Chart 2) The projected increase in the 2022 budget is
likewise unexceptional. Again, the government clearly does not intend
to stimulate the economy.
The non-existent fiscal stimulus and refusal to spend more dampens economic activity, worsened the
contraction last year, and deprives Filipinos of basic goods and public services just when they are
needed the most. This prolongs suffering and recovery.
Instead of spending and doing more, the government repeatedly exaggerates its COVID-19 response by
tossing billion-peso figures in the air out of their historical context and without mention of the extent
of actual needs. The Philippines’ health and economic outcomes are among the poorest of the major
countries in Southeast Asia because our health and economic response is among the weakest.
Crash economics
The over-reliance on an extreme lockdown, continued poor detection and isolation, and tepid economic
response combined to crash the economy in 2020. This was made worse by the long-standing
structural over-reliance on overseas remittances and on foreign trade and investment which all
weakened last year.
6 IBON Economic and Political Briefing l 09 February 2021Chart 3. National Accounts of the Philippines by industry group, 2020
(% growth, at constant 2018 prices)
(50) (40) (30) (20) (10) - 10
Agriculture, Forestry and Fishing (0.2)
Mining & Quarrying (19.9)
Manufacturing (9.5)
Electricity, steam, water
(0.7)
and waste management
Construction (26.0)
Wholesale and retail trade; Repair
(5.7)
of motor vehicles and motorcycles
Transportation and storage (31.2)
Accommodation and food service activities (44.7)
Information and communication 5.1
Financial and insurance activities 5.8
Real estate and ownership of dwellings (17.0)
Professional and business services (9.3)
Public administration and defense;
4.4
Compulsory social activities
Education (11.9)
Human health and social work activities (4.3)
Other services (41.8)
Source: Philippine Statistics Authority National Accounts of the Philippines
Real gross domestic product (GDP) contracted by a historic 9.5% (i.e. -9.5% growth) in 2020. (See Annex
8) Two years of economic growth were wiped out aside from what should have been added if there had
been growth as originally projected. Measured at current prices, the economy lost Php1.54 trillion in
2020 from the year before, or an average of Php4.2 billion per day. Measured against what the economy
was projected to grow to in 2020 the loss is as much as Php3.71 trillion.
IBON estimates at least 5.8 million unemployed Filipinos, some 18
PH economy lost million vulnerable poor and low-income families, and at least 33
Php4.2 billion per day million going hungry. For ordinary Filipinos, the economic collapse
means record unemployment, spiking poverty and hunger, and
in 2020 widespread small business closures.
The sectors worst hit by the lockdowns and physical distancing were accommodation and food service
activities (-44.7% growth), transportation and storage (-31.2%), construction (-26%), mining and
quarrying (-19.9%), and real estate (-17%). The last three sectors are likely to rebound better than the
first two. Much of hotel, restaurant and transport activity involves non-essential tourism and recreation
or otherwise can be substituted by remote and online interactions. (See Chart 3)
The latest labor force data for October 2020 shows the biggest job losses in accommodation and food services
(667,000), transport and storage (657,000), manufacturing (618,000), public sector (312,000), construction
IBON Economic and Political Briefing l 09 February 2021 7Chart 4. Employment changes by sector, October 2020 (year-on-year; in '000)
(800) (600) (400) (200) - 200
Agriculture 70
eam,
and
air
condi2oning
supply
Mining and quarrying (5)
werage,
waste
management
and
remedia2on
ac2vi2es
Manufacturing (618)
Electricity, gas, steam,
(12)
and air conditioning supply
Water supply; sewerage, waste 13
management and remediation activities
Construction (205)
Wholesale and retail trade; Repair
(63)
of motor vehicles and motorcycles
Transportation and storage (657)
Accommodation and
(667)
food service activities
Information and communication 21
Financial and insurance activities (43)
Real estate activities (61)
2on
and
defense;
Compulsory
social
sProfessional,
ecurity scientific
(21)
and technical activities
Administrative and 43
support service activities
Public administration and defense; (312)
Compulsory social activities
Education 72
Human health and social work activities 10
Arts, entertainment and recreation (132)
Other service activities (134)
Activities of extraterritorial
0
organizations and bodies
Source: Philippine Statistics Authority Labor Force Survey
(205,000), and arts, entertainment and recreation (132,000). Continued quarantines and physical distancing
will, again, bear down most heavily on the non-essential and substitutable activities. (See Chart 4)
By expenditure, the biggest contraction in GDP was in gross capital formation (-35.8% growth) then
in imports (-21.9%) and exports of goods and services (-16.7%). (See Chart 5) The most direct impact
on Filipino families however comes from the 7.9% contraction in household consumption. Even
if distributed evenly across income classes, the poorest will still feel this the worst for having low
levels of consumption to begin with. The relatively small contraction in household consumption is
disproportionately felt because it has accounted for an average of 73.5% of GDP in the past decade.
8 IBON Economic and Political Briefing l 09 February 2021No work, no pay Chart 5. National Accounts of the Philippines by expenditure share, 2020
(% growth, at constant 2018 prices)
Unemployment
is at a record high (40) (30) (20) (10) - 10 20
and much worse Household final
than reported or consumption expenditure
(7.9)
acknowledged. The
adverse impact on Government final
10.4
consumption expenditure
jobs and livelihoods is
unprecedented. Gross capital formation (35.8)
At the height of the
Exports of goods and services (16.7)
lockdowns, in April
2020, the number of Less:
employed suddenly (21.9)
Imports of goods and services
fell to 33.8 million
which was as low as a GROSS DOMESTIC PRODUCT (9.5)
dozen years before in
2008 – not yet even Source: Philippine Statistics Authority National Accounts of the Philippines
considering falling
earnings among even those still considered employed. (See Chart 6) Even after the easing of lockdowns,
the level of employment remained as low as in 2016 – which means that the pandemic economic shock
wiped out four years of jobs in the country.
In absolute terms, the 39.8 million people working in October 2020 is 2.7 million less than the year
before in October 2019 – for the largest contraction in employment in the country’s history.3 (See
Annex 9) Job losses were overwhelmingly among those in full-time work (worked 40 hours or over) with
apparently very few finding alternatives in part-time work (less than 40 hours).
Chart 6. Employed persons and employment rate, 1985-2020 (in millions, in %)
50 100
40 90
33.5 33.8
Employment rate (%)
Employed (millions)
30 80
20 70
10 60
- 50
1985 1990 1995
1995 2000
2000 2005 2010 2015 2020
Employed (in millions) Employment rate (%)
Source: Philippine Statistics Authority Labor Force Survey
3 Labor force figures are normally interpreted on an annual basis to take account of seasonal trends between the four labor force
survey (LFS) rounds in January, April, July and October. Drastically changing pandemic-related economic conditions between
LFS rounds last year however makes analysis on a quarterly basis more appropriate.
IBON Economic and Political Briefing l 09 February 2021 9By IBON’s estimates, there were at least 5.8 million unemployed Filipinos with a 12.7% unemployment
rate. This is if those apparently discouraged from looking for work because of the pandemic but not
counted as unemployed by the official methodology are also taken into consideration.4
The officially reported 3.8 million unemployed and 8.7% unemployment rate in October 2020 grossly
underestimate the true extent of joblessness. (See Annex 10)
The spike in unemployment in April 2020 is unparalleled. (See Annex 11) Even by underestimated official
figures, the number of unemployed more than tripled from the same period the year before. Despite the
easing of the lockdown and return to some economic activity, unemployment by the end of 2020 was
likely still more than double from the year before.
Even before the pandemic, more attention was needed on steadily falling labor force participation rates
(LFPR). (See Annex 12) The government is dismissive and attributed this mainly to the implementation
of K-to-12, where youth stay in school and thus take longer to enter the labor force, and occasionally
even to how supposed economic progress means less family members seeking work. As it is, the
pandemic shock has driven the LFPR to record lows.
Unemployment is It is also alarming that employment actually dropped between July
2020 and October 2020 or even after the end of the long lockdown.
at a record high 5.8 (See Annex 10) Employment dropping between July and October is
million and 12.7% very rare – the last time was during the 2008 and 2009 crisis – and
indicates economic activity sputtering after a momentary post-
unemployment rate lockdown rebound.
The October 2020 labor force survey data is consistent with a picture of hugely increasing numbers of
Filipinos struggling to make a living. The number of wage and salary workers fell by 2.6 million from the
year before and of unpaid family workers by 441,000. (See Annex 13) This is from retrenchments and
closures especially of smaller businesses.
At least some of these displaced workers may have shifted to informal sector work of being self-
employed or employers in family farms or businesses; combined employment here increased by 368,000.
(See Annex 13) The overwhelming majority however appear to have fallen into outright unemployment
(including those invisibly unemployed and not officially counted).
It is worth stressing that the reported 39.8 million people employed in October 2020 also includes huge
numbers of Filipinos struggling to eke out any sort of living from marginal pseudo-jobs rather than stay
completely unemployed. For instance, the combined share of self-employed, employers in family farms
or businesses, and unpaid family workers – among the proxies for informal sector work – increased to
37.5% in October 2020 from 35.3% the year before. (See Annex 13)
4 The discrepancy because of the peculiarity of official methodologies is immediately obvious. While the number of employed fell
by 2.7 million between October 2019 and October 2020, the official count of unemployed increased by just 1.8 million. This is
because the official methodology does not count those who stopped looking for work (in the last six months) or who said that
they are not immediately available for work as unemployed, instead counting them as ‘not in the labor force’.
Pandemic conditions are however most likely behind the conspicuous drop in the labor force participation rate (LFPR) from
61.4% in October 2019 to just 58.7% in October 2020. A rough estimate of those involuntarily unemployed by the pandemic and
invisibly unemployed by the official methodology can be made by applying the October 2019 LFPR to October 2020. This results
in 1.98 million added to the labor force in October 2020 who, not being employed, can be added to the officially reported 3.8
million unemployed – for a total 5.8 million unemployed and 12.7% unemployment rate in October 2020.
These numbers would actually increase even more with further adjustments to correct for the changed definition in unemployed
since April 2005. There is unfortunately not enough disaggregated LFS data available to make these computations at
the moment. IBON’s last recomputation for 2019 added 2.4 million to the number of officially reported unemployed. If
underestimation in 2020 is by the same magnitude then the real number of unemployed could reach as much as 8.2 million.
10 IBON Economic and Political Briefing l 09 February 2021The implosion in the labor market very likely means enormous downward pressure on wages, salaries
and earnings especially in the country’s vast informal sector. The government does not yet collect high
frequency data on pay and incomes so the immediate impact on households is still unclear.
Still, it appears that millions of households saw their savings wiped out and three-fourths of
households do not have any savings. There is alarming data from the Bangko Sentral ng Pilipinas (BSP)
that the percentage of households with savings drastically fell from 37.8% in the first quarter of 2020 to
just 25% in the fourth quarter.5 Assuming around 24.8 million Filipino families last year, this implies that
as much as 3.2 million households saw their savings wiped out resulting in three out of four (75%) not
having any savings at all at the start of 2021.6
The poorest 75% of families without savings constitute a
huge majority of the country that are not just vulnerable to
18.6 million poor and socioeconomic distress but already in difficulty since last year. They
number approximately 18.6 million families with 81.8 million people
low-income Filipino (at the current average family size of 4.4 members). They include the
families are distressed poorest half (50%) of 12.4 million Filipino families that IBON estimates
likely had monthly incomes of just around Php22,000 or less entering
the pandemic, and also the poorest some one-tenth (12%) with
monthly incomes of Php11,000 or less.7(See Annex 14)
Trends in the National Capital Region (NCR) minimum wage are another possible indirect indicator of
insufficient earnings. (See Annex 15) The Duterte administration is the stingiest wage-hiker among
post-Marcos administrations so real wages that were falling even before the pandemic have just fallen
even more. (See Annex 16) Unfortunately, the recent economic shocks provide a convenient pretext for
continuing to refuse wage hikes.
No money, no aid
Emergency cash assistance has fallen to token levels disproportionate to the extreme social crisis
at hand. Despite unprecedented economic distress for millions of Filipinos there is only token cash
assistance from the government. The first wave of social amelioration programs (SAP) under Bayanihan 1
was initially encouraging in promising Php5,000-8,000 monthly to 18 million families for two months.
In the end, only 14.1 million families received two SAP tranches from the social welfare department and
even then only an average of some Php5,803 a month; this was equivalent to just Php12 per person per
day for the 106 days of the first long lockdown.8(See Annex 17) Another 3.5 million families only received
one tranche of SAP equivalent to Php6 per person per day over the lockdown.
Aside from SAP, Bayanihan 1 also gave cash assistance to some 5.1 million individuals under various
other windows: the social welfare department’s SAP for public utility vehicle drivers; the labor
department’s COVID-19 Adjustment Measures Program (CAMP for workers), Tulong Panghanapbuhay
sa Ating Displaced/Disadvantaged Workers Program (TUPAD for informal workers) and Abot-Kamay ang
Pagtulong Program (AKAP) for overseas Filipino workers (OFWs) and the Small Business Wage Subsidy
Program (SBWS) of the Social Security System (SSS); and the agriculture department’s Financial Subsidy
for Rice Farmers Program (FSRF). (See Annex 17) Average assistance given here ranged from Php3,749 to
Php14,716.
5 Household savings data from the BSP Consumer Expectations Survey (CES).
6 IBON computations on household savings data from the BSP CES for the fourth quarter of 2020.
7 These are very roughly estimated for early 2020 by extrapolating from income groups for 2018 as estimated by Albert, et al in
their PIDS Discussion Paper Series No. 2020-22 (August 2020).
8 IBON computations on data from the DSWD SAP Dashboard and assuming an average family size of five (5) members per
family.
IBON Economic and Political Briefing l 09 February 2021 11The Php239.3 billion in cash assistance disbursed under Bayanihan 1 dwindled to just Php13 billion
under Bayanihan 2 as of December 2020. (See Annex 17) These only helped 251,776 families (under
SAP) and 1.9 million individuals (under CAMP, TUPAD, AKAP and the agriculture department’s Registry
System for Basic Sectors in Agriculture)
Cash assistance has dwindled to almost nothing compared to the
magnitude of needs. The Php239.3 billion disbursed under Bayanihan
Cash assistance has 1 fell to just a Php22.8 billion budget under Bayanihan 2 (this Php22.8
billion was inexplicably not even fully used by the end of the year).
dwindled to almost This falls further to just around Php18.4 billion in the 2021 national
nothing government budget – corresponding to the incremental increases
in the labor department’s TUPAD and Overseas Workers Welfare
Administration (OWWA) social protection for OFWs budget items
from the year before.9
There does not seem to be any other allocation for COVID-related cash assistance anywhere in the Php4.5
trillion budget.10 Nor is there any mention of additional cash assistance in the 340 pages of the supposedly
post-pandemic updated Philippine Development Plan 2017-2022 released in early February 2021.
No business, no support
Distress among micro, small and medium enterprises (MSMEs) is widespread but only a few are being
helped. Various reports confirm serious disruptions in business activity particularly among the country’s
reported 998,342 MSMEs. Various surveys reported some 80-90% of businesses seeing sales decline, 40-
50% closing at least temporarily, and 10-15% expecting to close permanently in the April-July period.11
Labor department reports are more specific although limited in only covering the few formal sector
establishments notifying it. Between January 2020 and January 2021, 101,472 establishments reportedly
closed temporarily and another 2,878 permanently (aside from 64,474 with flexible work arrangements
and 24,603 retrenching).12 (See Annex 18)
Yet support to distressed MSMEs has been very sparing. For instance, only 7,560 MSME loans were
reported released under Bayanihan 1 as late as September 2020. Meanwhile, 19,449 MSME loans were
reported released with another 5,324 in the pipeline under Bayanihan 2 as of the end of December (it is
not clear if these include loans processed and approved during the earlier Bayanihan 1 period).
Uncertain recovery
The rebound this year is not the start of recovery. There will be a spontaneous post-lockdown rebound
in 2021 and the administration will misrepresent positive GDP growth starting the second quarter as
an accomplishment. This will however be nothing more than bouncing back from the extremely low
base last year especially in the second quarter (due to the lockdowns since March 2020) and the record
economic collapse from extreme government inaction.
Growth rates will immediately start to moderate from the third quarter onwards and most likely return
to levels of 6% or less only by 2022 at the earliest.
9 The GAA 2020 budgeted Php6.8 billion for TUPAD and Php885 million for OWWA social protection for OFWs. In the GAA 2021
this increased to Php19 billion and Php7 billion, respectively.
10 The pre-COVID Pantawid Pamilyang Pilipino Program (4Ps) is the only other major cash assistance program in the 2021 budget.
11 These results summarize findings of surveys by the International Trade Centre (covering April-May), United Nations
Development Programme (June), and World Bank (July).
12 The labor department reports just 42,566 workers displaced by permanent closure and 386,135 retrenched for a total of
428,701 which is very small compared to the 2.4 million drop in the number of wage and salary workers in October 2020 from
the year before according to the latest labor force survey.
12 IBON Economic and Political Briefing l 09 February 2021The unnecessarily severe economic scarring from closures,
The economy will not interrupted livelihoods, unemployment, falling incomes and depleted
recover to its 2019 level savings will continue to have an impact for years to come. The
before 2022 or even 2023 economy will not recover to its 2019 level before 2022 or even 2023.
The lack of real stimulus last year worsened the economic scarring
which now greatly weighs on any rapid and real recovery, especially combined with the weakening
growth momentum coming into the pandemic. Unfortunately, with a government fiscal response even
weaker this year, the rebound-driven growth spurt in 2021 will be shallow and short-lived. This means
prolonged economic distress especially amid an uncertain global economy.
The lack of real stimulus combines with shaky overseas remittances and tepid foreign trade and
investment to hinder a return to the relatively high growth rates before the pandemic. The economy
lacks a strong foundation in domestically-driven growth based on jobs, incomes and productivity from
developed agriculture and robust Filipino industry.
This results in a disproportionate reliance on overseas work and remittances and on foreign trade and
investment. Unfortunately, there are strong reasons to expect these to remain weak in 2021 if not for
many years to come.
Beating early anxious forecasts, overseas Filipino (OF) cash remittances contracted by a relatively small
0.8% in the first 11 months of last year – falling by just US$218 million to US$27 billion in January-
November 2020 from the same period the year before. (See Annex 19) Still, this is the first contraction in
remittances in two decades since 2001.
The small contraction is particularly welcome because record
OFW deployments fell numbers of OFWs were displaced by the pandemic. Initial projections
estimated the pandemic displacing 600,000 to nearly a million OFWs.
by 60-75% in 2020 As of mid-December 2020, the labor department estimated over
550,000 OFWs losing their jobs, including some 82,000 who opted to
stay where they are instead of returning home for lack of work in the Philippines. As of end-November,
683,369 OFWs had applied for emergency assistance with 338,900 helped.
The relatively moderate drop in remittances may however just be due to United States (US)-based
migrant OFs stepping up emergency support to their families and extended families in the Philippines.
Remittances from most countries contracted last year but there was a notable US$551 million or 5.4%
increase reported from the US which has the single largest concentration of OFs in the world.13
The prospects for overseas remittances are uncertain this year and may yet contract even more than
last year. If the boost in 2020 was for instance because of exceptional emergency support from US-
based migrants, then the extent to which this will be maintained this year remains to be seen.
There is however already downward pressure on remittances from the significant drop in OFW
deployments last year aside from the effects of the crisis in foreign host economies. Only 682,000
OFWs left in the first nine months of 2020 consisting of 440,000 land-based migrants and 241,000 sea-
based migrants. This is a considerable 60% less than the 1.72 million deployed in the same period the
year before. There are also government reports that OFW deployments fell by as much as 75% in 2020
from tighter labor markets abroad.
On top of this, foreign trade and investment will be weak in 2021. The United Nations Department of
Economic and Social Affairs (UNDESA) already sees subdued trade in 2021. Global trade in goods and
services is estimated to have contracted by 7.6% in 2020 with projected growth of only 6.9% in 2021 – a
rebound falling short of recovering trade to 2019 levels – and a slowdown to 3.7% in 2022.
13 The US hosted 3.5 million OFs (including 3.1 million permanent migrants) out of the total 10.2 million OFs worldwide, as of the
latest official data for 2013.
IBON Economic and Political Briefing l 09 February 2021 13Chart 7. National government cash operations, 1986-2022* (as % of GDP; value in Php billion)
30 3,000
20 2,000
Value (Php billion)
10 1,000
% of GDP
- -
(10) (1,000)
(20) (2,000)
1986 1990 2000 2010 2020
NG deficit NG deficit Revenues Expenditures
(Php billion) as % of GDP as % of GDP as % of GDP
GDP - gross domestic product NG - national government
* - 2020-2022 data are based on projections as per 178th DBCC Meeting
Sources: Bureau of the Treasury, Philippine Statistics Authority National Accounts of the Philippines , and Development Budget Coordination
Committee (DBCC)
Chart 8. National government outstanding debt, 1990-2021* (as % of GDP; value in Php trillion)
150 15
9.8
% of GDP
100 10
Value (Php trillion)
7.7
50 5
- -
1990 2000 2010 2020
in Php trillion as % of GDP
GDP - gross domestic product
* - 2021 data are based on projections as per DBM and 178th DBCC Meeting
Sources: Bureau of the Treasury, Philippine Statistics Authority National Accounts of the Philippines, Department of Budget and Management
(DBM) Budget of Expenditures and Sources of Financing , and Development Budget Coordination Committee (DBCC)
14 IBON Economic and Political Briefing l 09 February 2021The World Bank in turn sees subdued investment in emerging markets and developing economies.
Investment growth is estimated to remain at or below average rates in the 2010s and insufficient to
reverse investment losses during 2020. A 5.7% rebound is seen in 2021 softening to 4.3% in 2022 but,
still, investment (excluding China) is projected to remain below pre-pandemic levels through to 2022.
The United Nations Economic and Social Commission for Asia and the Pacific (UNESCAP) concurs and
sees foreign direct investment (FDI) remaining low and below pre-crisis levels throughout 2021.
Beyond these, the record global levels of deficits and debt worldwide exacerbate the risks of debt
distress. There is also the massive financial bubble inflating because of excessive liquidity and low
inflation since last year. These combine to seriously threaten financial stability and the global financial
system is increasingly fragile.
As it is, foreign trade drastically contracted last year. The trade deficit shrank not because the economy
was producing more of its needs but only because imports fell faster than exports.14 In 2020, FDI of
US$5.8 billion in the first eleven months of 2020 was also already 11% smaller than the US$6.5 billion in
the same period the year before. This continues a trend of falling FDI that started two years before the
pandemic.15
The Philippines has no choice but to navigate these adverse global
trends. Aggressive fiscal policy can help strengthen the domestic
Aggresive fiscal policy economy to withstand global turbulence. However, the government’s
can help compensate for narrow-minded fiscal conservatism instead adds to these
contractionary forces.
subdued foreign trade
and investment until The continuing failure to spur aggregate demand and economic
activity will keep joblessness, poverty and hunger high. The tens
2022 of millions of informal sector earners and their families are in the
greatest distress. Workers in formal and informal enterprises are also
seeing their real wages collapse.
Surging deficits
The Duterte administration’s negligence in letting the economy collapse has resulted in the most rapid
deterioration in the national government deficit and the biggest increase in debt in the country’s
history. The deficit is doubling in magnitude and as a share of GDP, from the equivalent of 3.4% of GDP
in 2019 to 7.6% in 2020. (See Chart 7) Meanwhile, the Php2.1 trillion increase in national outstanding
debt in 2020 from the year before is even more than the combined increases over the previous seven
years. (See Chart 8)
Economic contraction badly hit revenues in 2020, which fell by an unprecedented Php696.2 billion to just
Php2.85 trillion. This is 19.4% short of the original projection of Php3.54 trillion.
The steep drop in revenues is the real reason for the increase in the national government deficit and not
any increased pandemic-related spending. To recall, the actual increase in government spending last year
was even less than what was originally budgeted.
14 The big drop in goods imports is not because domestic substitutes are being produced but because: i) export-oriented TNCs in
enclaves are importing less inputs due to the collapse of global value chains and demand worldwide; and ii) depressed domestic
consumption demand for imports. The drop in services imports is also not from any domestic substitution but simply from less foreign
travel and transport.
Similarly, the increase in foreign exchange (FOREX) reserves and strengthening of the peso are not signs of an improving
economy. Forex reserves are rising because less imports means less demand for dollars which stay as forex reserves. The peso
is ‘strengthening’ mainly for the same reason – less imports means less demand for dollars which drives its price (e.g. the foreign
exchange rate) down.
15 FDI steadily increased from US$1.07 billion in 2010 to US$10.26 billion in 2017. However, this fell to US$9.95 billion in 2018 and
further to US$7.69 billion in 2019.
IBON Economic and Political Briefing l 09 February 2021 15Chart 9. National government gross borrowings, 1986-2021* (as % of GDP; value in Php billion)
20 4,000
3,000
Value (Php billion)
% of GDP
10 2,000
1,000
- -
1990 2000 2010 2020
in Php billion as % of GDP
GDP - gross domestic product
* - 2020-2021 data are based on projections as per DBM and 178th DBCC Meeting
Sources: Bureau of the Treasury, Philippine Statistics Authority National Accounts of the Philippines, Department of Budget and Management
(DBM) Budget of Expenditures and Sources of Financing , and Development Budget Coordination Committee (DBCC)
The national government deficit is projected to reach the equivalent of 7.6% of GDP in 2020, 8.9% in 2021,
and 7.3% in 2022 (more than double the original targets of 3.2% in each year from 2020 to 2022). The 2020
deficit increases from an originally projected Php677.6 billion to around Php1.38 trillion.
The Corporate Recovery and Tax Incentives for Enterprises (CREATE) law which reduces the corporate
income tax (CIT) paid especially by large corporations is a major contributor to the large budget
deficits in 2021 and 2022 (and indeed all budget deficits hereafter).16 CREATE reportedly results in
foregone revenues of Php133.2 billion in 2021 and Php117.6 billion in 2022. These are record budget
deficit figures. However, given the exceptional pandemic circumstances and the urgency of meaningful
government intervention, a large deficit is not necessarily the problem per se.
For instance, the case can be made for even higher deficits if this is because of additional spending on
emergency assistance for the people, strengthening the public health system, and real support to agricultural
development and national industrialization. Such additional spending and budget deficits now will mean more
rapid recovery, more economic activity much earlier, and correspondingly more revenue generation.
The main problem is rather that the Duterte government is not spending for these. Instead, its spending
program remains as it was even before the pandemic and is still biased for infrastructure, militarism,
and debt service. These will not spur real and rapid economic recovery.
Making things worse is how, on the revenue side, taxes are being generated from an increasingly
regressive tax system that reduces direct taxes on the income of the rich and large corporations,
increases consumption taxes, and avoids a wealth tax.
Soaring debt
A similar argument can be made for national government debt. Given the exceptional pandemic
circumstances and the urgency of meaningful government intervention, additional debt to support
increased spending on emergency assistance for the people, strengthening the public health system, and
16 CREATE lowers the currently 30% CIT to 25% for large firms and 20% for MSMEs in 2021; large and small firms will both have
CIT of just 20% by 2027.
16 IBON Economic and Political Briefing l 09 February 2021real support to agricultural development and national industrialization can be desirable. More so if these
are from creditors willing to give very concessional terms.
The main problem rather is that the Duterte government is: i) borrowing on conventional market/official
development assistance (ODA) terms and is not negotiating for better terms; ii) blindly repaying all debt
to public/private creditors despite urgent COVID-19 response needs (instead of negotiating debt relief,
restructuring or even cancelling on urgent development grounds); and iii) borrowing to mainly finance
its infrastructure indulgence, militarism, and debt repayments. These are of course on top of the basic
problem that debt is being paid for through an increasingly regressive tax system that disproportionately
burdens poor and low-income taxpayers while lessening taxes paid by the rich.
The obsession with creditworthiness is misplaced even from a mainstream perspective. Global interest
rates have fallen to record lows and are even negative in real terms. With such low interest rates,
‘creditworthiness’ matters far less now than if interest rates were high.
As it is, public debt has soared to all-time highs. The national government outstanding debt reached
Php9.8 trillion as of end-2020 – a record Php2.1 trillion or 26.7% increase from the end-2019 level. (See
Chart 8) Domestic debt accounted for Php6.69 trillion and external debt for Php3.1 trillion. The debt-to-
GDP ratio spiked from 39.6% in 2019 to 54.5% in 2020. This is the highest in 14 years since 2006 while
still well below the 71.6% peak in 2004.
Apparently aware that economic activity and correspondingly revenue-generation will remain weak –
especially with CREATE cutting tax revenues by Php250.8 billion in 2021 and 2022 – the government is
planning to borrow Php3 trillion in 2021. Gross borrowings are unmatched and at magnitudes many
times over what they had ever been. (See Chart 9)
The government is also set to pay Php1.79 trillion in debt service in 2021 – consisting of Php1.39 trillion
in interest payments and principal amortization to domestic creditors, and Php402 billion to foreign
creditors. (See Chart 10) These are marked increases from Php740.9 billion paid for domestic debt
service and Php264.4 billion for foreign debt service last year.
Chart 10. National government debt service, 1986-2021* (as % of GDP; value in Php billion)
20 2,000
15 1,500
Value (Php billion)
As % of GDP
10 1,000
5 500
- -
1986 1990 2000 2010 2020
Interest payments Principal payments As % of GDP
GDP - gross domestic product
* - 2020-2021 data are based projections as per DBM and 178th DBCC Meeting
Sources: Bureau of the Treasury, Philippine Statistics Authority National Accounts of the Philippines, Department of Budget and Management
Budget of Expenditures and Sources of Financing , and Development Budget Coordination Committee
IBON Economic and Political Briefing l 09 February 2021 17Only the Php531.6
Chart 11. Infrastructure spending, 2016-2020* (as % of GDP; value in Php billion)
billion in interest
15 1,500 payments are
reflected in the 2021
GAA. The Php1.26
trillion in principal
amortization is,
10 1,000 by accounting
Value (Php billion)
convention, not
% of GDP
considered part
of the national
5 500
government budget.
The government’s
‘fiscal prudence’
ironically makes
- - soaring public
2016 2017 2018 2019 2020 debt even more
unmanageable.
in Php billion as % of GDP GDP growth
A strong stimulus
GDP - gross domestic product package last year
* - 2020 data on infrastructure spending as projected by the DBM could have mitigated
Sources: Department of Budget and Management (DBM), and Philippine Statistics Authority National the economic
Accounts of the Philippines collapse and set
the stage for early
recovery starting this year. The government has to spend what’s needed to generate economic activity
which will help pay for this spending. Increasing economic activity generates more revenues to help the
economy more quickly grow out of debt.
Unproductive infrastructure
Hyped as the main stimulus that the economy needs for recovery, the Build, Build, Build (BBB)
program is however not the answer. The administration’s vaunted infrastructure offensive was not
enough to overcome these before the pandemic and will continue to fail to do so. (See Chart 11)
The main cause of economic suffering and biggest fetter to aggregate demand today is the extreme
collapse in household incomes especially due to soaring unemployment. The impact of infrastructure
spending on this is however limited because of the capital- and import-intensiveness especially of big-
ticket projects.
Despite greatly increasing infrastructure spending since 2016, employment generation does not seem
to be commensurate to the hundreds of billions spent. (See Table 1) The infrastructure program’s direct
job generation is presumably most reflected in construction employment. However, even including
private sector projects, the average annual increase in construction employment over the 2017-2019
BBB period of 258,400 is even less than the average annual increase of 334,800 in the 2014-2016 period
immediately before this.
This is likely because a large part of the hundreds of billions in BBB projects is spent on imported
materials, equipment, machinery, contractors and perhaps even labor rather then spent domestically or
on Filipino workers. This is also in addition to concerns about the absorptive capacity of implementing
agencies with, for instance, apparently consistent underspending by the public works and transport
departments of their infrastructure budgets.
18 IBON Economic and Political Briefing l 09 February 2021Table 1. Public infrastructure spending and construction employment, 2013-2019
Indicator 2013 2014 2015 2016 2017 2018 2019
Construction employment ('000) 2,373 2,578 2,697 3,378 3,537 3,865 4,153
Change from year before ('000) 141 205 119 681 160 328 287
Infrastructure spending
Php billion 307 346 576 590 691 886 1,050
% of GDP 2.7 2.7 4.3 3.9 4.2 4.9 5.4
GDP - gross domestic product
Sources: Philippine Statistics Authority National Accounts of the Philippines and Labor Force Survey, and Department of Budget and
Management
In contrast, the same amount given as emergency cash assistance to poor and low-income households
will most likely be spent wholly and mainly in communities and the local economy. The increased
consumption will immediately improve household welfare as well as support domestically-oriented small
businesses, and by extension also boost aggregate demand and growth.
The profile of BBB projects proposed is also perplexingly oblivious to the weaknesses of the public health
system that the pandemic exposed. The health department budget for human resources increases in
2021 and will hopefully be maintained in the years to come. (See Annex 20)
However, the budget for the health facilities enhancement program – covering the building and
equipping of hospitals – is even cut. The infrastructure outlay for hospitals and health centers increases
to Php14.7 billion but this is still smaller than the Php19.8 billion budget in 2018. (See Annex 20) It also
pales in comparison to the Php760.8 billion infrastructure budget of the public works, transport and
defense departments combined. (See Annex 21)
The economy was weak coming into the pandemic. The economic managers insist that the economy
was strong before COVID-19 hit. However, growth was conspicuously slowing for three consecutive years
in 2017-2019 from flagging consumption, investments and exports. (See Annex 22)
IBON Economic and Political Briefing l 09 February 2021 19Job generation was also waning with the average annual increase in employment in 2016-2019 the lowest
among five-year periods in two decades. (See Annex 23) Even before the pandemic it was the second
weakest performance in the post-Marcos era – and upon the pandemic will certainly become the worst.
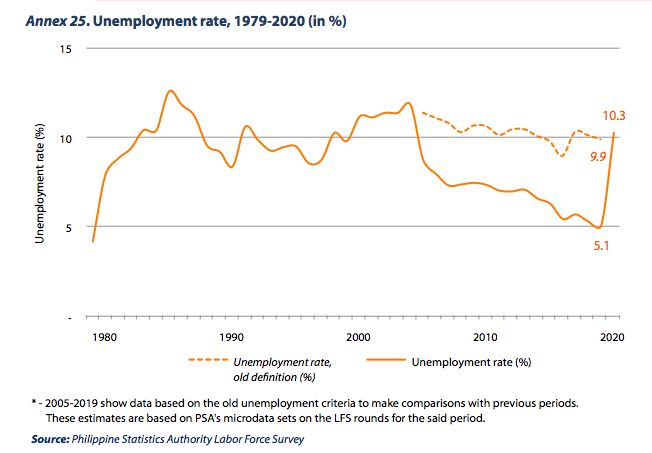
Real unemployment was already at a record high 4.7 million in 2019. This is higher than the officially
reported 2.3 million in adjusting for the change in methodology in the 2000s for better comparability
through time. (See Annex 24 & Annex 25) There is not enough available data yet to compute for 2020
but, with the economic collapse, this will certainly see a record high many times over.
The fading of relatively high growth was masked by infrastructure hype, over-emphasis on narrow
financial metrics, and often just sheer economic bluster. Big business was prospering but the rest of the
economy of smaller enterprises, informal livelihoods, and low-income households was not as fortunate.
Hyped poverty reduction in 2018 is somewhat superficial. This is partly because of the unrealistic
national average Php71 per person per day poverty threshold. Another major reason is that the reported
drop in poverty incidence is not because the poor got steady jobs and incomes but mainly because
of hugely expanded cash transfers. (See Annex 26) Cash transfers to the poorest households almost
doubled between 2015 (Php11,578) and 2018 (Php21,871) and this is likely what ‘lifted’ around 1.1
million families above the low poverty line.17
If the government was struggling to get the economy to pick up then, the severity of the disruption last
year just makes it even harder today.
The economy will remain weak without major structural reforms. The unprecedented pandemic shock is
hastening the economy’s inevitable return to its accustomed and lower trend economic growth. The most
important sources of sustainable long-term growth and development are domestic agriculture and Filipino
industry. Unfortunately, these have been eroded by four decades of neoliberal globalization. (See Chart 12)
Persistently low levels of production and incomes are the forces of economic gravity that prevent
sustained domestically-driven growth. Growth has been relatively rapid in recent years not from
increasing productivity, jobs and incomes but mainly from remittances, shallow real estate and
infrastructure, and debt. Domestic and global conditions are however becoming adverse and it is unlikely
that these will be able to keep boosting the economy as they did before.
The Duterte regime’s Post-pandemic, the failure to implement more substantial structural
reforms will mean an economy still weighed down by its fundamental
business-as-usual stance backwardness. Whether in terms of relief and recovery or for long-
is untenable and needs term reforms, the most important thing in dire need of fixing is the
Duterte administration’s insistence on business-as-usual and stale
to be fixed failed strategies. This is untenable.
17 The social welfare department reports an average of Php11,578 given to each of the 4.4 million poorest households in the
country under the 4Ps program in 2015 – consisting of 4.16 million households covered by the regular CCT program and another
237,859 under the Modified CCT (MCCT).
In 2018, cash transfers increased to an average of Php21,871 to each of the 4.18 million poorest households. The 4Ps program
disbursed an average of Php19,471 – now including an additional rice subsidy – to 3.96 million households covered by the CCT
program and another 227,990 under the MCCT. Added to this is the Php2,400 unconditional cash transfer that the TRAIN law
temporarily gave the country’s poorest ten million families.
Some 2.8 million families were around or just below the official poverty line in 2015, according to the FIES. At such low income
levels, the combined cash transfers families received in 2018 amounted to between 16-20% of their family income. It is highly
likely that the huge increase in cash transfers between 2015 and 2018 were behind the reported 1.1 million families being ‘lifted’
from poverty for being pushed above the poverty threshold (i.e. not because of any improvements in the economy and their
livelihoods).
20 IBON Economic and Political Briefing l 09 February 2021Self-serving authoritarian politics
Vaccines are being rolled out around the world in 2021 which promises the beginning of the end of the
pandemic. The trajectory of authoritarian rule by law in the country is, on the other hand, getting worse
with the Duterte clique of the ruling class seeking to extend its hold on power beyond the scheduled
May 2022 national elections. It is motivated not just by the spoils of power but also to protect itself
from accountability for its accumulating abuses – whether by staying in power or at the very least
determining the next administration.
Every administration seeks to retain political power for as long as
Every administration possible. However, beyond any administration in the post-Marcos
seeks to retain political era, the Duterte administration has gone furthest in establishing
authoritarian governance to achieve this. Pres. Rodrigo Duterte
power for as long as is a populist demagogue wielding the country’s nominally liberal
possible democratic system for his own purposes – unconstrained by laws
and regulations and at times even opportunistically rewriting these.
Administration allies opened the year with a renewed Charter change offensive. This comes after
the League of Municipalities and interior and local government department put this back into public
discourse last year even while the pandemic was at its worst.
The pretext of foreign investment liberalization is being used as a cover for political revisions in the 1987
Constitution including term extensions. There cannot be any doubt that the overriding motive of the
Duterte administration in pushing Charter change now is to remain in power notwithstanding how it is
mobilizing disparate groups with their own interests such as foreign capital and a section of big business.
The economic arguments for removing so-called restrictive provisions – to spur recovery from the
pandemic and to ensure long-term development – are however extremely weak. The public has
moreover repeatedly shown that it will resist self-serving attempts by any administration to stay in
power beyond its allotted term.
At the same time, the pandemic and the government’s poor response precipitated the biggest and
most rapid increase in joblessness, poverty, and inequality in the country’s history. Public demands for
meaningful relief and reforms will only increase as the crisis deepens. As demands increase, they will
be a powerful challenge to the administration and especially if they join up in a concerted movement or
collective action.
The wholesale deterioration in social and economic conditions potentially weakens public support
for the administration. Adding to this is how corruption is perceived to be widespread in the Duterte
administration reaching up to the inner circle of the president himself, including in its response to the
pandemic. The Philippines’ ranking has already slipped in a global corruption index released at the start
of the year with the country placing 115th out of 180 countries. Corruption-related controversies are a
proven trigger-point against Philippine presidencies.
The Duterte administration’s political heavy-handedness to push its narrow agenda will worsen. It will
use this to force Charter change to retain political power if it can. Failing this, it will wield the resources
and influence of government to position its favored candidates to dominate the 2022 elections from
the presidency down to local levels.
Among his innermost circle, long-time aide Sen. Bong Go and daughter Mayor Sara Duterte are floated
for the presidency, at one point even in tandem with Pres. Duterte for the vice presidency. These may
be trial balloons or diversionary. The Duterte clique will need to rein in individual political ambitions
within its own ranks as well as prevent unification among the political opposition.
IBON Economic and Political Briefing l 09 February 2021 21You can also read