Bird trends from long-term observation data at sites in the Hudson Bay Lowlands
←
→
Page content transcription
If your browser does not render page correctly, please read the page content below
VOLUME 16, ISSUE 1, ARTICLE 10
Brook, R. W., L. A. Pollock, K. F. Abraham, and G. S. Brown. 2021. Bird trends from long-term observation data at sites in the Hudson Bay
Lowlands. Avian Conservation and Ecology 16(1):10. https://doi.org/10.5751/ACE-01821-160110
Copyright © 2021 by the author(s). Published here under license by the Resilience Alliance.

Research Paper

Bird trends from long-term observation data at sites in the Hudson Bay
Lowlands
Rodney W. Brook 1, Lisa A. Pollock 1, Kenneth F. Abraham 1 and Glen S. Brown 1
1
  Ontario Ministry of Natural Resources and Forestry

ABSTRACT. Monitoring population trends for bird species in the Arctic and sub-Arctic can be difficult and cost prohibitive. Breeding
populations of birds in these remote locations may be changing and have garnered much attention regarding their conservation. We
analyzed data from bird lists (daily species observations) collected while conducting other targeted research to estimate trends in the
probability of observing species at two sub-Arctic study sites. For Akimiski Island, Nunavut (52 species) we estimated positive trends
with high confidence (95% credible limits do not include 0) for 14 species and negative trends with high confidence for 18. For Burntpoint
Creek, Ontario (46 species) we estimated that 12 species had positive trends with high confidence and 12 had negative trends with high
confidence. More than 60% of species at each site matched population trends for at least one of three larger geographic scales that we
compared estimates with; regional, provincial and national. We hypothesized that trends may be due to climate change effects or because
of effects related to intensive herbivory from nesting geese. Trends for most of the species where we made specific predictions from
these hypotheses agreed with those predicted; however, well-designed experiments are needed to conclusively determine the driving
mechanisms of these trends. Collecting bird list data while simultaneously conducting other research is not nearly as time consuming
or expensive as targeted breeding bird surveys (e.g., point counts, call counts, nest searching, etc.). This analysis method may be of
utility for other remote field study sites where gaps in trend data exist.

Tendances des oiseaux à partir d'observations faites depuis longtemps sur des sites dans les basses-
terres de la baie d'Hudson
RÉSUMÉ. Le suivi de la tendance des populations d'oiseaux dans l'Arctique et le subarctique peut être difficile et son coût prohibitif.
Les populations d'oiseaux nicheurs dans ces endroits éloignés sont peut-être en train de changer et leur conservation a suscité beaucoup
d'attention. Nous avons analysé les données de listes d'oiseaux (observations quotidiennes d'espèces) recueillies lors d'autres recherches
ciblées afin d'estimer la tendance de la probabilité d'observer des espèces à deux sites d'étude subarctiques. Pour l'île Akimiski, au
Nunavut (52 espèces), nous avons calculé des tendances positives avec un niveau de confiance élevé (les limites crédibles à 95 % ne
comprennent pas les 0) pour 14 espèces et des tendances négatives avec un niveau de confiance élevé pour 18 autres. Pour le ruisseau
Burntpoint, en Ontario (46 espèces), nous avons déterminé que 12 espèces présentaient des tendances positives avec un niveau de
confiance élevé et 12 des tendances négatives avec un niveau de confiance élevé. La tendance de plus de 60 % des espèces à chaque site
correspondait aux tendances de populations d'au moins une des trois grandes échelles géographiques avec lesquelles nous avons comparé
les résultats : régionale, provinciale et nationale. Nous avons émis l'hypothèse selon laquelle les tendances pouvaient être imputables
aux effets du changement climatique ou aux effets liés au broutement intensif des oies nicheuses. Les tendances pour la plupart des
espèces pour lesquelles nous avons fait des prédictions spécifiques à partir de ces hypothèses corroboraient celles prédites; toutefois,
des protocoles expérimentaux bien conçus sont nécessaires pour déterminer de manière concluante les mécanismes moteurs de ces
tendances. La collecte d'observations au moyen de listes d'oiseaux, tout en menant simultanément d'autres recherches, est loin d'être
aussi longue et coûteuse que les suivis ciblés d'oiseaux nicheurs (p. ex. dénombrement par points d'écoute, relevé de chants, recherche
de nids, etc.). Cette méthode d'analyse peut être utile pour d'autres sites d'étude éloignés où les tendances sont inconnues.
Key Words: Bayesian logistic model; climate change; overgrazing; habitat change; list length; population trends

INTRODUCTION                                                               showing large declines (NABCI Canada 2019, Rosenberg et al.
Monitoring of population trends for bird species occurs through            2019, Smith et al. 2020).
several government and non-government sponsored programs                   Population indices from the breeding range are preferred for
and at multiple spatial scales in North America (e.g., ECCC 2019,          informing management and conservation as observations during
Sauer et al. 2004). Available evidence indicates that populations          migration (Ross et al. 2012) or on wintering ranges (Newbold et
of most waterfowl species have increased and those of most                 al. 2012) may reflect a mixture of animals from reproductively
shorebird species have declined (Rosenberg et al. 2019, Smith et           isolated populations. Indices from winter range counts may also
al. 2020). Populations of most landbird species have been mostly           be subject to overdispersion issues (Richards 2007) due to
stable but some have declined in recent decades, with some

Address of Correspondent: Rodney W Brook, 2140 East Bank Drive, Peterborough, ON , Canada, K9L 1Z8, rod.brook@ontario.ca
Avian Conservation and Ecology 16(1): 10
                                                                                                    http://www.ace-eco.org/vol16/iss1/art10/

clumping and bias from uneven distribution and survey coverage.        assessments may be due to more localized drivers at each study
Species whose breeding ranges are not easily accessed are              site; drivers that are not widespread or acting at the larger
generally not well monitored, particularly in more northerly           geographic scales. We hypothesized that habitat damage due to
regions (ECCC 2018, Roy et al. 2019). Exceptions may include           localized herbivory at the more southerly study site (Kotanen and
species that are the target of research or game species whose          Abraham 2013) could potentially compound the broader scale
numbers are monitored for harvest management purposes, (e.g.,          environmental impacts on habitat that could be driving some of
Canada Geese (Branta canadensis): Leafloor et al. 1996 and Snow        the trends we observed. Further, we predicted that the presence
Geese (Anser caerulescens): Kerbes et al. 2014). Other programs        of herbivores (Canada and Lesser Snow Geese) attracts both
provide long-term datasets but may not have enough geographic          avian (American Crow (Corvus brachyrhynchos), Common Raven
coverage to adequately survey all species breeding ranges (e.g.,       (Corvus corax)) and mammalian predators that may increase
Sauer et al. 2013). Citizen science-based programs and incidental      predation of eggs for other species, especially breeding ducks
observations have proven to contribute valuable knowledge for          (Mallard (Anas platyrhynchos), American Black Duck (A.
tracking status and trends in populations, especially where            rubripes), Northern Pintail (A. acuta), and Green-winged Teal (A.
standardized surveys or management-driven monitoring                   crecca)) and breeding shorebirds (Semipalmated plover
programs are lacking (Crewe et al. 2008, Bonter and Cooper 2012,       (Charadrius semipalmatus), Short-billed Dowitcher (Limnodromus
Callaghan and Gawlik 2015, Walker and Taylor 2017). However,           griseus), and Least Sandpiper (Calidrus minutilla) thus causing
these programs rarely target those breeding populations that are       negative trends for those species. We also predicted that, through
in difficult to access areas such as the Arctic and sub-Arctic where   encroachment of shrubs in open graminoid areas at the more
status of breeding birds has received increasing management and        northerly site (predominantly low-tundra habitat), species that
conservation attention.                                                would benefit from increasing shrub habitat would likely increase,
                                                                       including American Tree Sparrow (Spizella arborea), Lincoln’s
For species in decline, population change may be driven by factors
                                                                       Sparrow (Melospiza lincolnii), Song Sparrow (M. melodia), and
on the breeding range, during migration, and in wintering areas.
                                                                       White-throated Sparrow (Zonotrichia albicollis).
The drivers of change may manifest through negative impacts on
juvenile and adult survival or through impacting reproductive
success and recruitment. In Arctic and sub-Arctic regions, bird        METHODS
population change may be occurring through the direct or indirect      Daily observations of all bird species were performed at Akimiski
effects of climate change (Butler 2000, Ims et al. 2019). Similarly,   Island, Nunavut (N53.013, W81.321) from 1993 to 2015 (N = 23
herbivory by overabundant geese (Abraham and Jefferies 1997,           yr) and at Burntpoint Creek, Ontario (N55.241, W84.318) from
Flemming et al. 2016, Buij et al. 2017, Flemming et al. 2019) may      2001 to 2005 and 2007 to 2018 (N = 17 yr). Although data were
also be causing bird population change due to the change these         collected for variable periods annually, observations used in
herbivores induce on their habitat. These two phenomena may            analysis were restricted to those between 21 May and 4 August at
independently cause change in bird populations in this region or       both locations.
they may interact resulting in little habitat change (Post 2013,       Observations were done by researchers (from 4 to 20 per day) with
Biuw et al. 2014) or in compounded change. Climate change              varying bird identification experience (from minimal to advanced)
effects are predicted to be most pronounced at higher latitudes        while performing fieldwork on long-term Canada Goose, Lesser
(ACIA 2005) and are expected to impact the sub-Arctic and Arctic       Snow Goose (Leafloor et al. 2000), and shorebird research
regions first (IPCC 2018). Habitat change in these regions has         projects (Nguyen et al. 2003, Pollock et al. 2012, Weiser et al.
been observed including the encroachment of shrubs in tundra           2020). While in the field, observers recorded all bird species
habitats (Post et al. 2019), drying of wetland habitats (Roach et      encountered by sight and sound, according to their abilities. At
al. 2011), or mismatch for some species between the timing of          the end of each day, a composite list of bird observations was
hatch and the availability of their primary food sources for young     compiled from all observers.
(McKinnon et al. 2012, Brook et al. 2015). Further, most Arctic
and sub-Arctic breeding birds occupy intermediate trophic levels       We restricted data to include those species known to be within
and may be more vulnerable to climate change effects than species      their breeding range based on available literature and documented
at other trophic levels because they may be subjected to both top-     evidence or where we had confirmation of breeding evidence at
down and bottom-up ecological change (Weiser et al. 2018a).            our local sites (Cadman et al. 2007, MNRF unpublished data).
There is evidence that Arctic breeding shorebirds are exhibiting       We excluded locally non-breeding and transient species that often
declines worldwide (Studds et al. 2017, Weiser et al. 2020) and        occurred at our sites (e.g., Black-bellied Plover (Pluvialis
opportunities to enhance monitoring and trend assessments are          squatarola)) but whose presence and abundance in any year may
needed to inform conservation.                                         be affected more by weather than true population change. To
                                                                       reduce the potential effect of bias on trends, we also removed
Here we used list analyses methods (Roberts et al. 2017, Szabo et      species observed in less than 20% of years and on less than 3% of
al. 2010) to estimate change in long-term (17 to 23 years) bird list   observation days because of known issues with trend analysis.
datasets for species at two sub-Arctic study sites. We only included   Szabo et al. (2010) found that rare species were reported at a rate
species where we deemed observation effort was consistent              unaccounted for by list length. Thus, we assumed that
through time to ensure that survey methods did not result in the       observations of these rare species as we defined them were likely
detection of false trends. We hypothesized that any species-           more by chance than associated with effort and change over time.
specific trends we detected would be consistent with trends            Some species that were the focus of intense research were also
reported from larger geographic scale assessments for those            excluded due to the potential for a false trend because of increased
species. Trends that did not match those from larger scale             observation effort for a limited number of years during the time
Avian Conservation and Ecology 16(1): 10
                                                                                                         http://www.ace-eco.org/vol16/iss1/art10/

series; however, we did model one such species, Smith’s Longspur           that was explained by the fitted model using Deviance
(Calcarius pictus) at Burntpoint Creek, but excluded a single year         Information Criterion (DIC: Spiegelhalter et al. 2002). Models
(2007) when a Smith’s Longspur project had occurred. We also               with ∆DIC < 2 have similar strong support and we used the rules
removed extremely abundant species (observed >85% of                       of parsimony to select models from which to make an inference.
observation days in each year) as any survey (day) without an              We present the results for the year effect regardless of whether the
observation was likely an anomaly due to lack of field work in a           95% credible limits included zero (a low confidence trend) and
portion of the study area on that day (e.g., Lesser Snow Goose,            categorized trends where 95% credible limits did not include zero
where the colony was not visited daily). This would not necessarily        as a high confidence trend.
result in a bias; however, we would still not likely be able to reliably
                                                                           We compared our trend estimates (probability of observing each
detect a trend for these very abundant species. Species that bred in
                                                                           species) for each study site with trends from larger geographic
habitats not consistently surveyed (e.g., inland sedge meadows on
                                                                           scales. We directly compared our estimates of trend with those
Akimiski Island) were also excluded because of the same potential
                                                                           for the Hudson Bay Lowlands (which encompasses both study
for false trends resulting from inconsistent surveying. The result
                                                                           sites) reported in the second breeding bird atlas of Ontario
of our exclusions and restrictions is a subset of species for which
                                                                           (Cadman et al. 2007). In the second Ontario breeding bird atlas,
we have highest confidence in consistency of status (e.g., breeding)
                                                                           probability of observation was compared between the first
and observation effort (e.g., unbiased by numerical abundance or
                                                                           (1981-1985) and second (2001-2005) atlases and statistical
from increased detection by targeted research).
                                                                           significance (P < 0.1) of change was reported (Cadman et al.
The geographic area covered at each site (proportion of typical            2007). At the Ontario provincial scale, we compared our results
study area) varied daily but was similar between years. We used a          with abundance trends estimated from an analysis of the Breeding
list length analysis to compensate for effort differences, which           Bird Survey of North America (Smith and Edwards 2020). We
assumes the number of species (list length) observed in each survey        used custom trends calculated from the annual Canadian Wildlife
(in our case, a day) increases with increasing effort (see Szabo et        Service analyses of the Breeding Bird Survey (Smith et al. 2020)
al. 2010). This also compensated for observer skill as we equated          for time intervals matching those for our trends from each study
longer lists with observers with greater bird identification               area. At the national scale, we used abundance trends from the
experience. Logistic regression was used to model the probability          Breeding Bird Survey of North America (Smith et al. 2020) also
of a species presence as a function of the total number of species         estimated for the same time periods as for each study area. In all
(the list length) and year surveyed (Link et al. 2006, Szabo et al.        cases, if the credible limit included zero for the year effect, we had
2010). We assessed three additive trend models (all included a year        little confidence in the estimated trend (a low confidence trend).
effect): 1) a prevalence model (intercept + year), 2) an effort model      To assess the consistency of trends between study sites and among
(intercept + year + log(list length)), and 3) a date/effort model          scales, we estimated the correlation using a Pearson correlation
(intercept + year + log(list length) + day of year). Species detection     including 95% confidence limits (significance was determined at
probability may be density dependent which is a known potential            alpha < 0.05).
complication for this method (Szabo et al. 2010); however, the mix
of skills and number of observers contributing to daily lists              RESULTS
mediates potential bias due to detection rate change. We included          In total, 811 and 342 surveys (survey-days) were used for analysis
a model with day of year to account for any seasonal differences           for Akimiski Island and Burntpoint Creek, respectively. After
there might be for species detection probability (Walker and Taylor        screening species due to rarity, inconsistent surveying, outside of
2017). For each species, we estimated parameter coefficients for           breeding range, and super abundance, we found the trend model
the three models in a Bayesian logistic model regression                   (estimating list length and year effects) or the day model
framework.                                                                 (estimating list length, day of year and year effects) to be the most
We fitted models using Markov Chain Monte Carlo (MCMC)                     parsimonious for most species. We compared trend (year effect
simulation using uninformed priors (mean of 0 and standard                 covariate) results for 52 species observed at Akimiski Island (Fig.
deviation of 10000) with 80000 iterations and 20000 burn-in                1, Table 1) and 46 at the Burntpoint Creek study area (Fig. 2,
iterations and a thinning rate of five. As in Szabo et al. (2010),         Table 2). For Akimiski Island, we found 32 species with trends
input variables were centered with a mean of 0 but were not rescaled       that did not include 0 within the 95% credible limits; 14 positive
to units of standard deviation to help with interpretation. We             and 18 negative. For Burntpoint Creek, we found 24 species with
implemented JAGS 4.3.0 (Gelfand and Smith 1990, Plummer                    trends that did not include 0 within the 95% credible limits; 12
2013) from program R (R Development Core Team 2018) using                  positive and 12 negative. We identified trends for 33 (63.5%) and
the package jagsUI (Kellner 2018). To determine whether each               31 (67.4%) species for Akimiski Island and Burntpoint Creek,
species models converged, we calculated Geweke z-scores (Geweke            respectively, that matched the direction of trends for at least one
1992) for each coefficient using R package ggmcmc (Fernández-i-            of the three larger geographic scales. Conversely, 19 (36.5%)
Marín 2020) and also inspected plots of their traces. Any parameter        species observed at Akimiski Island and 15 (32.6%) for the
coefficient with a Geweke z-score greater than 2.0 or less than -2.0       Burntpoint Creek study area (three in common) did not match
for any of three chains was deemed to have poor convergence and            the direction of trends for at least one of three larger geographic
models were run again until there was acceptable convergence. We           scales. There was a positive but insignificant correlation (0.20,
made further convergence assessment using the Gelman-Rubin                 95% CL = -0.182 to 0.526, P = 0.31) between trends for species
diagnostic R (Gelman et al. 2004). Convergence was achieved for            common to both study areas (N = 29, Figure 3); however, where
parameters (all R < 1.1) using three chains. For each species, we          there were high confident trends for species in common at both
evaluated model fit by measuring the deviance from the null model          sites (N = 10), five species had the same trend direction (American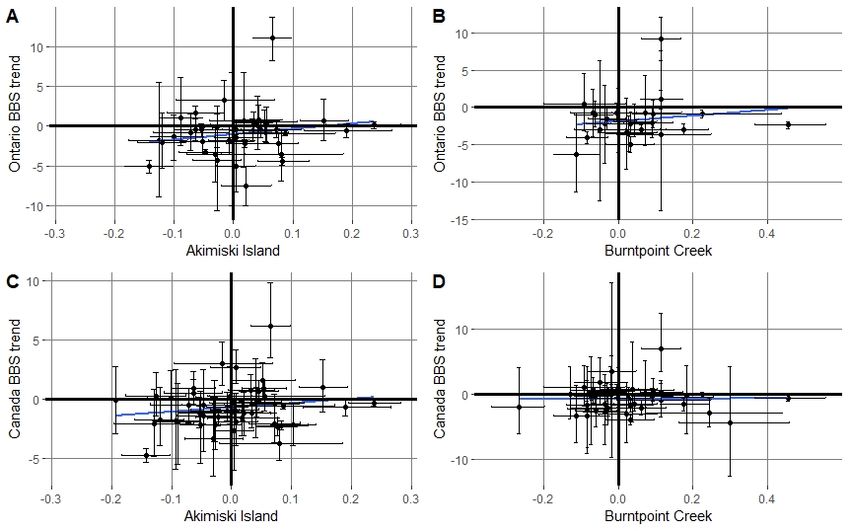
Avian Conservation and Ecology 16(1): 10
                                                                                                                            http://www.ace-eco.org/vol16/iss1/art10/

Table 1. Mean trends of the probability of observation (and 95% credible limits) estimated from daily bird count data for species
surveyed annually at the Akimiski Island study site in the sub-Arctic, 1993 to 2015. Trend comparisons are with those at the 1) regional
scale; the Hudson Bay Lowlands (HBL) Breeding Bird Atlas trend from estimating the probability of observation between the first
(1981 to 1985) and second (2001 to 2005) Atlases in Ontario, the 2) provincial scale using trends in abundance from the North American
Breeding Bird Survey (1993 to 2015) and with the 3) Breeding Bird Survey at the national scale (1993 to 2015).

                                                                                                                                                      ‡               §
ORDER and common name                  Scientific name                                      Akimiski Island                  HBL          Ontario BBS     Canada BBS
                                                                                                                                  †
                                                                                                                             Atlas
ANSERIFORMES
Mallard                                Anas platyrhynchos                                0.072 (0.031 ̶ 0.113)*             No trend         -0.414         -0.365
American Black Duck                    Anas rubripes                                     0.004 (-0.029 ̶ 0.037)             No trend        -4.994*         -2.634
Northern Shoveler                      Spatula clypeata                                  0.007 (-0.035 ̶ 0.049)             No trend
Northern Pintail                       Anas acuta                                        -0.028 (-0.068 ̶ 0.013)            No trend         -4.298         -0.953
Green-winged Teal                      Anas crecca                                      -0.101 (-0.141 ̶ -0.061)*           No trend         -1.374          0.12
American Wigeon                        Mareca americana                                 -0.126 (-0.177 ̶ -0.077)*           No trend         -1.766         0.298
Common Merganser                       Mergus merganser                                  -0.027 (-0.069 ̶ 0.016)            No trend          -0.05         -2.126
Red-breasted Merganser                 Mergus serrator                                    -0.03 (-0.079 ̶ 0.019)            No trend        -3.555*         -3.343
Hooded Merganser                       Lophodytes cucullatus                             -0.015 (-0.097 ̶ 0.069)            No trend        3.255*          2.994*
GAVIIFORMES
Pacific Loon                           Gavia pacifica                                    -0.194 (-0.282 ̶ -0.11)*           No trend
Common Loon                            Gavia immer                                        0.045 (0.013 ̶ 0.078)*            No trend         -0.408          0.694
PELECANIFORMES
American Bittern                       Botaurus lentiginosus                             0.032 (-0.006 ̶ 0.071)             No trend         -0.546          0.746
ACCIPITRIFORMES
Northern Harrier                       Circus hudsonius                                   0.076 (0.041 ̶ 0.11)*             Increase        -2.187*         -2.326*
STRIGIFORMES
Short-eared Owl                        Asio flammeus                                     0.072 (0.029 ̶ 0.115)*             Increase
GRUIFORMES
Sandhill Crane                         Antigone canadensis                               0.065 (0.032 ̶ 0.098)*             Increase        11.044*         6.182*
CHARADRIIFORMES
Killdeer                               Charadrius vociferous                             0.083 (0.041 ̶ 0.127)*             Increase        -4.433*         -2.202*
Semipalmated Plover                    Charadrius semipalmatus                          -0.093 (-0.133 ̶ -0.053)*           No trend
Greater Yellowlegs                     Tringa melanoleuca                                0.152 (0.112 ̶ 0.194)*             Increase         0.645           0.997
Lesser Yellowlegs                      Tringa flavipes                                   0.008 (-0.027 ̶ 0.043)             No trend
Hudsonian Godwit                       Limosa haemastica                                -0.067 (-0.102 ̶ -0.032)*           No trend
Marbled Godwit                         Limosa fedoa                                      -0.022 (-0.061 ̶ 0.015)            No trend
Least Sandpiper                        Calidris minutilla                               -0.047 (-0.083 ̶ -0.012)*           No trend
Short-billed Dowitcher                 Limnodromus griseus                              -0.045 (-0.087 ̶ -0.002)*           No trend
Wilson's Snipe                         Gallinago delicata                               -0.064 (-0.101 ̶ -0.027)*           Increase         -0.494         0.938
Bonaparte's Gull                       Chroicocephalus philadelphia                     -0.089 (-0.126 ̶ -0.052)*           No trend         0.995          -1.874
Arctic Tern                            Sterna paradisaea                                -0.052 (-0.086 ̶ -0.018)*           No trend
Caspian Tern                           Hydroprogne caspia                                0.041 (-0.037 ̶ 0.121)             No trend         0.052          -0.325
PICIFORMES
Northern Flicker                       Colaptes auratus                                 -0.054 (-0.089 ̶ -0.019)*           Increase         -0.43          -1.033*
PASSERIFORMES
Alder Flycatcher                       Empidonax alnorum                                   0.19 (0.119 ̶ 0.267)*            Increase         -0.556           -0.69
Canada Jay                             Perisoreus canadensis                              0.042 (0.002 ̶ 0.083)*            Increase         0.753           -0.257
Common Raven                           Corvus corax                                       0.054 (0.017 ̶ 0.092)*            Increase         -0.854         0.892*
American Crow                          Corvus brachyrhynchos                              0.238 (0.195 ̶ 0.283)*            Increase         0.161          -0.311*
Horned Lark                            Eremophila alpestris                             -0.143 (-0.184 ̶ -0.103)*           No trend        -5.093*         -4.731*
Boreal Chickadee                       Poecile hudsonicus                               -0.072 (-0.136 ̶ -0.007)*           No trend         -0.789          -0.454
Ruby-crowned Kinglet                   Regulus calendula                                  0.052 (-0.002 ̶ 0.107)            Increase         0.572          1.582*
Hermit Thrush                          Catharus guttatus                                  0.034 (0.002 ̶ 0.066)*            Increase         0.446           -1.184
American Robin                         Turdus migratorius                                  0.004 (-0.032 ̶ 0.04)            Increase        -1.417*         -0.456*
Tennessee Warbler                      Leiothlypis peregrina                              0.021 (-0.022 ̶ 0.064)            No trend        -7.476*          -1.136
Orange-crowned Warbler                 Leiothlypis celata                                  0.018 (-0.04 ̶ 0.077)            Increase         0.692          -1.593*
Yellow Warbler                         Setophaga petechia                                 0.019 (-0.013 ̶ 0.052)            Increase        -2.189*         -1.047*
Yellow-rumped Warbler                  Setophaga coronata                                 0.005 (-0.035 ̶ 0.045)            Increase         -0.386          -0.868
Wilson's Warbler                       Cardellina pusilla                                  0.055 (-0.04 ̶ 0.155)            Increase         0.135           0.281
American Tree Sparrow                  Spizelloides arborea                             -0.129 (-0.196 ̶ -0.063)*           No trend
LeConte's Sparrow                      Ammospiza leconteii                                 0.08 (-0.021 ̶ 0.186)            Increase        -3.497*         -3.749*
Savannah Sparrow                       Passerculus sandwichensis                        -0.047 (-0.092 ̶ -0.002)*           Increase        -3.253*         -1.412*
Fox Sparrow                            Passerella iliaca                                  -0.002 (-0.038 ̶ 0.033)           Increase         -1.973          0.254
Lincoln's Sparrow                      Melospiza lincolnii                               -0.053 (-0.09 ̶ -0.017)*           Increase        -1.935*          -1.176
Swamp Sparrow                          Melospiza georgiana                              -0.064 (-0.113 ̶ -0.016)*           Increase        1.725*           0.538
Song Sparrow                           Melospiza melodia                                  0.087 (0.004 ̶ 0.172)*            Increase        -0.892*         -0.534*
White-crowned Sparrow                  Zonotrichia leucophrys                             0.103 (0.066 ̶ 0.142)*            Increase
Dark-eyed Junco                        Junco hyemalis                                     -0.008 (-0.042 ̶ 0.027)           Increase         -1.769         -0.667
Common Redpoll                         Acanthis flammea                                   -0.12 (-0.162 ̶ -0.08)*           No trend         -2.029         -1.743
†
 Regional scale Hudson Bay Lowlands trends from the Ontario Breeding Bird Atlas (Cadman et al. 2007)
‡
 Ontario provincial scale trends from the North American Breeding Bird Survey for the time period 1993 to 2015 (Smith and Edwards 2020)
§
Canada national scale trends from the North American Breeding Bird Survey for the time period 1993 to 2015 (Smith and Edwards 2020)
*Indicates a species had a trend where zero was not within the 95% credible limits
Avian Conservation and Ecology 16(1): 10
http://www.ace-eco.org/vol16/iss1/art10/
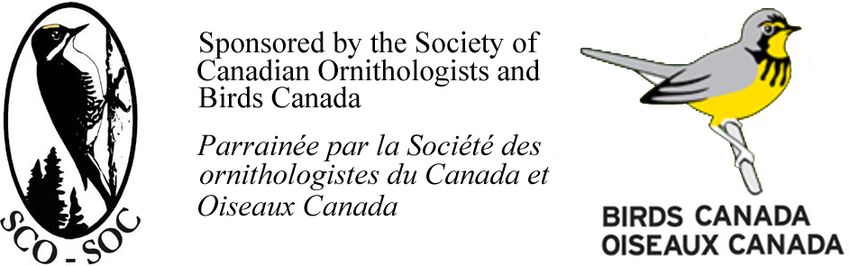
Fig. 1. Mean coefficients for the effect of year (trend) on the Fig. 2. Mean coefficients for the effect of year (trend) on the
probability of observation for bird species at the Akimiski probability of observation for bird species trends at the
Island, Nunavut study site based on daily bird count data from Burntpoint Creek, Ontario study site based on daily bird count
1993 to 2015. Values are logit-transformed probability of data from 2001 to 2018 (excluding 2006). Values are logit-
observation and bars are 95% credible limits. transformed probability of observation and bars are 95%
credible limits.
Tree Sparrow, Pacific Loon (Gavia pacifica), Sandhill Crane Fig. 3. A scatter plot of mean probability of observation
(Antigone canadensis), Semipalmated Plover, and Song Sparrow) (trends) and 95% credible limits bars for comparing species
and five had opposite trend directions (Killdeer (C. vociferous), observed at the Akimiski Island (1993 to 2015) and Burntpoint
Least Sandpiper, Mallard, Short Eared Owl (Asio flammeus) and Creek (2001 to 2018, excluding 2006) study areas based on daily
Swamp Sparrow (M. georgiana)). There were also positive but bird counts. The trend line represents the Pearson correlation
insignificant correlations between Akimiski Island and the (slope) between the sites.
provincial Breeding Bird Survey trends (0.19, 95%CL = -0.128 to
0.474, P = 0.24) and the national Breeding Bird Survey trends
(0.17, 95% CL = -0.114 to 0.428, P = 0.24) (Figure 4). Similarly,
there were positive but insignificant correlations between
Burntpoint Creek and the provincial Breeding Bird Survey trends
(0.16, 95% CL = -0.249 to 0.524 P = 0.44) and the national
Breeding Bird Survey trends (0.004, 95% CL = -0.308 to 0.314, P
= 0.98).
DISCUSSION
The trend that we observed for most species matched that reported
for at least one of the larger geographic scales (i.e., region,
provincial or national) suggesting that the processes causing most
trends that we detected at a study site scale might be part of trends
occurring at the larger scales or the cause may occur outside the
breeding seasons (i.e., during migration or on wintering areas forAvian Conservation and Ecology 16(1): 10
http://www.ace-eco.org/vol16/iss1/art10/
Table 2. Mean trends of the probability of observation (and 95% credible limits) estimated from daily bird count data for species
surveyed annually at the Burntpoint Creek study site in the sub-Arctic, 2001 to 2018 (excluding 2006). Trend comparisons are with
those at the 1) regional scale; the Hudson Bay Lowlands (HBL) Breeding Bird Atlas trend from estimating the probability of observation
between the first (1981 to 1985) and second (2001 to 2005) Atlases in Ontario, the 2) provincial scale using trends in abundance from
the North American Breeding Bird Survey (2001 to 2018) and with the 3) Breeding Bird Survey at the national scale (2001 to 2018).
‡ §
ORDER and common name Scientific name Burntpoint Creek HBL Ontario BBS Canada BBS
†
Atlas
ANSERIFORMES
Tundra Swan Cygnus columbianus 0.038 (-0.025 ̶ 0.103) Increase 0.695
Mallard Anas platyrhynchos -0.063 (-0.117 ̶ -0.011)* No trend -0.94 -0.273
American Black Duck Anas rubripes -0.111 (-0.172 ̶ -0.052)* No trend -6.352* -3.312
Northern Shoveler Spatula clypeata -0.018 (-0.084 ̶ 0.049) No trend 3.522*
Northern Pintail Anas acuta -0.048 (-0.118 ̶ 0.02) No trend -3.002 1.721
Green-winged Teal Anas crecca 0.002 (-0.049 ̶ 0.055) No trend -1.625 0.717
Black Scoter Melanitta americana 0.206 (0.038 ̶ 0.402)* No trend
Long-tailed Duck Clangula hyemalis -0.073 (-0.127 ̶ -0.019)* No trend -0.596
Red-breasted Merganser Mergus serrator 0.023 (-0.055 ̶ 0.104) No trend -3.411 -3.149
GAVIIFORMES
Red-throated Loon Gavia stellate -0.02 (-0.084 ̶ 0.043) 0.345
Pacific Loon Gavia pacifica -0.129 (-0.189 ̶ -0.072)* No trend -0.07
Common Loon Gavia immer -0.03 (-0.08 ̶ 0.02) No trend -1.556* 0.201
ACCIPITRIFORMES
Northern Harrier Circus hudsonius 0.044 (-0.013 ̶ 0.103) Increase -1.873 -1.549*
STRIGIFORMES
Short-eared Owl Asio flammeus -0.06 (-0.115 ̶ -0.004)* Increase -2.632*
FALCONIFORMES
Merlin Falco columbarius -0.068 (-0.129 ̶ -0.008)* Increase -0.704 0.527
GRUIFORMES
Sandhill Crane Antigone canadensis 0.114 (0.063 ̶ 0.166)* Increase 9.22* 6.96*
CHARADRIIFORMES
Killdeer Charadrius vociferous -0.083 (-0.138 ̶ -0.028)* Increase -4.028* -1.639*
Semipalmated Plover Charadrius semipalmatus -0.082 (-0.136 ̶ -0.03)* No trend -2.292
American Golden-Plover Pluvialis dominica -0.078 (-0.134 ̶ -0.022)* No trend
Greater Yellowlegs Tringa melanoleuca -0.09 (-0.198 ̶ 0.02) Increase 0.469 1.048
Lesser Yellowlegs Tringa flavipes -0.029 (-0.129 ̶ 0.075) No trend -2.114
Red-necked Phalarope Phalaropus lobatus 0.298 (0.162 ̶ 0.456)* No trend -4.456
Least Sandpiper Calidris minutilla 0.183 (0.117 ̶ 0.253)* No trend -0.483
Dunlin Calidris alpina -0.022 (-0.086 ̶ 0.04) No trend
Short-billed Dowitcher Limnodromus griseus 0.053 (-0.015 ̶ 0.124) No trend
Wilson's Snipe Gallinago delicata 0.093 (0.037 ̶ 0.149)* Increase -0.848 0.567
Parasitic Jaeger Stercorarius parasiticus 0.131 (0.08 ̶ 0.184)* Decrease
Arctic Tern Sterna paradisaea -0.036 (-0.094 ̶ 0.02) No trend -2.733
PASSERIFORMES
Rusty Blackbird Euphagus carolinus 0.073 (-0.017 ̶ 0.171) Increase -0.692 0.082
Common Raven Corvus corax -0.005 (-0.059 ̶ 0.049) Increase -0.672 0.526
Horned Lark Eremophila alpestris 0.032 (-0.033 ̶ 0.096) No trend -4.978* -3.988*
American Robin Turdus migratorius 0.455 (0.364 ̶ 0.555)* Increase -2.355* -0.605*
American Pipit Anthus rubescens -0.083 (-0.144 ̶ -0.023)* No trend -3.44
Yellow Warbler Setophaga petechia 0.175 (0.113 ̶ 0.24)* Increase -2.963* -1.6*
Yellow-rumped Warbler Setophaga coronata 0.034 (-0.021 ̶ 0.091) Increase -2.146* -1.751*
American Tree Sparrow Spizelloides arborea -0.264 (-0.338 ̶ -0.196)* No trend -1.987
Nelson's Sparrow Ammospiza nelsoni 0.243 (0.076 ̶ 0.439)* No trend -2.963*
Fox Sparrow Passerella iliaca 0.114 (-0.003 ̶ 0.248) Increase -3.587 -0.914
Lincoln's Sparrow Melospiza lincolnii 0.09 (0.035 ̶ 0.147)* Increase -2.091* -0.359
Swamp Sparrow Melospiza georgiana 0.115 (0.06 ̶ 0.173)* Increase 1.055 0.244
Song Sparrow Melospiza melodia 0.224 (0.039 ̶ 0.437)* Increase -0.844* -0.085
White-throated Sparrow Zonotrichia albicollis 0.061 (-0.002 ̶ 0.128) No trend -3.005* -2.165*
Dark-eyed Junco Junco hyemalis 0.028 (-0.035 ̶ 0.093) Increase -3.555* -0.628
Lapland Longspur Calcarius lapponicus -0.017 (-0.092 ̶ 0.057) No trend 0.6
-0.108 (-0.169 ̶ -0.051)*
|
Smith's Longspur Calcarius pictus
Common Redpoll Acanthis flammea -0.036 (-0.086 ̶ 0.015) No trend -2.187 -1.62
†
Regional scale Hudson Bay Lowlands trends from the Ontario Breeding Bird Atlas (Cadman et al. 2007)
‡
Ontario provincial scale trends from the North American Breeding Bird Survey for the time period 2001 to 2018 (Smith et al. 2020)
§
Canada scale trends from the North American Breeding Bird Survey for the time period 2001 to 2018 (Smith et al. 2020)
*Indicates a species had a trend where zero was not within the 95% credible limits
|
Data for 2007 was not included for Smith’s Longspur because of a species-specific project in that year that may cause a bias in trend estimates
migratory species). The only geographic coverage overlap in data (Smith et al. 2020) do not overlap geographically with our study
collection with our study sites was that for the regional scale; the area though we still made the trend comparisons because of
Hudson Bay Lowlands (Cadman et al. 2007). Data collection at species range overlap. Reasons for differences in trend direction
the provincial and national scales of the Breeding Bird Survey that we observed may also include environmental or ecologicalAvian Conservation and Ecology 16(1): 10
http://www.ace-eco.org/vol16/iss1/art10/
breeding vegetation structure used for nesting cover or feeding by
Fig. 4. Scatter plots of the mean probability of observation other species (Rockwell et al. 2003, Peterson et al. 2013, Flemming
(trend) and 95% credible limits bars comparing species et al. 2019). If sufficiently abundant, herbivores may also attract
observed at the Akimiski Island study site (1993 to 2015) with and maintain predator populations that could also target
trends in abundance from the A) Ontario Breeding Bird Survey alternate prey or their eggs (Iles et al. 2013). This is a mechanism
and the C) national (Canada) Breeding Bird Survey. Similar of concern where herbivores have become over-abundant
comparisons were made for the mean probability of (Lamarre et al. 2017) but it is not known what minimal densities
observation (trend) and 95% credible limits bars comparing herbivores must attain for other species to be affected. There is
species observed at the Burntpoint Creek study site (2001 to clear evidence that Canada Geese and Lesser Snow Geese at the
2018, excluding2006) with B) the Ontario Breeding Bird Survey Akimiski Island study site have had a detrimental impact on the
trends and D) the Canada Breeding Survey trends for the same plant community in coastal habitats mainly through the removal
time period (2001 to 2018). Trend lines are Pearson correlation of biomass and creation of de-vegetated areas (Kotanen and
(slope). Abraham 2013). The presence of geese and their eggs at these
study sites also attract and maintain populations of predators (e.
g., Arctic fox (Vulpes lagopus), Common Raven, American Crow,
and Herring Gull (Larus argentatus)) that also prey on other bird
species and their young (KFA personal communication).
Continued or increasing effects of herbivory at these study sites
may have an influence on the trends observed for some species.
For example, we observed positive trends for American Crow and
Common Raven abundance on Akimiski Island, which could be
a result of their benefiting from availability of eggs and goslings
of nesting geese. These two species in turn may cause a decline in
some species whose eggs they also prey upon including those we
predicted might have negative trends as a result. Of the duck
species nesting at Akimiski Island, where we predicted negative
trends, only the Northern Pintail trend was negative (low
confidence). Trends for Mallard (high confidence) and American
Black Duck (low confidence) were positive. In addition, other
duck species where we could estimate trends including Green-
factors unique to sites near large waterfowl colonies (see below) winged Teal and American Wigeon, had high confidence negative
which may cause local trends that might be undetectable at larger trends (Table 1). The duck species with negative trends were also
scales. Differences in trend direction observed between our study in agreement with the low confidence negative trends observed at
sites for five species found in common may be due to the negative the provincial scale. We found a negative trend for all the shorebird
ecological influence of the disproportionally larger densities of species nesting on Akimiski Island where we made trend
Lesser Snow and Canada Geese at the Akimiski Island site predictions (Semipalmated Plover, Least Sandpiper, and Short-
compared with lower densities of Canada Geese at the Burntpoint billed Dowitcher), However, none were covered well enough by
Creek site. Further, there may be an interaction with climate the Breeding Bird Surveys to allow comparison of trend estimates
change processes that may be acting at different rates at the two at provincial and national scales and the trends estimated at the
sites. The Burntpoint Creek site is in low tundra habitat with regional scale (atlas, HBL) were all low confidence. We did find
continuous permafrost while the Akimiski Island site is in the that many of the open or grassland ground-nesting shorebird and
boreal forest and is not influenced by permafrost. waterfowl species showed negative trends at both study sites
We cannot offer definitive ecological explanations for trends (Tables 1 and 2). Further study is needed to advance hypotheses
observed because we have no observational or experimental regarding the direct and indirect influence of abundant
evidence for causes as it was not the purpose of this research. herbivores.
However, we do offer two hypotheses (not necessarily competing) Population trends of birds observed in Arctic and sub-Arctic
to help explain potential drivers and their mechanisms of regions could also be influenced by a changing climate through
influence on population change for the region encompassing our either climate-mediated change to habitat (e.g., Tape et al. 2006),
study areas: 1) relatively high densities of herbivores at our study development of a mismatch between nesting phenology and
sites (especially Akimiski Island) affects the habitat increasingly resource availability (e.g., Brook et al. 2015) or from changes in
negatively and can indirectly affect predation rates of other bird growing season length or other environmental conditions
species and their eggs/young (e.g., Abraham and Jefferies 1997, (Overpeck et al. 1997, Serreze et al 2000). These are not mutually
Flemming et al. 2016), and 2) climate change impacts both habitat exclusive hypotheses. The result may be a species breeding range
and environmental conditions that could influence the breeding expansion or contraction (La Sorte and Thompson 2007) that
success of populations of birds in the sub-Arctic region at both may appear as a significant trend at the local scale. With a
sites (Wauchope 2017, Weiser et al. 2018b). poleward shift in species breeding distribution a possibility
Herbivores may affect the abundance of bird populations in (Brommer 2004, Virkkala and Lehikoinen 2014), trends we
several ways. Herbivores may have enough impact on the observed for some species could be a consequence of climate
vegetation that they consume that it could change important change (e.g., longer suitable temperatures or growing seasons).Avian Conservation and Ecology 16(1): 10
http://www.ace-eco.org/vol16/iss1/art10/
Shrub expansion (Wheeler et al. 2018) in the Arctic and sub-Arctic Responses to this article can be read online at:
regions is one consequence of a changing climate (Tape et al. 2006); https://www.ace-eco.org/issues/responses.php/1821
increases in shrub cover, density, and height (Myers-Smith et al.
2011, Sturm et al. 2001) are some of the changes expected from a
warming climate (Forbes et al. 2010) in this region. These changes
are altering the proportions of vegetative cover and may favor the Acknowledgments:
expansion of some bird species but be detrimental to others We thank the staff at the Ontario Ministry of Natural Resources
(Nguyen et al. 2003, Ballantyne and Nol 2011). Shrub and Forestry and the many people who helped collect the data over
encroachment is occurring at both study sites either through the many years. Thanks to Kim Bennett and Sarah Hagey for creating
spread of woody vegetation along tributaries toward Hudson Bay and maintaining the database. We thank the editor and two
(at Burntpoint Creek) or from a contraction of the open graminoid anonymous reviewers for comments that improved an earlier version
habitats in the supratidal zone due to increasing woody vegetation of the manuscript. We are grateful to A. C. Smith for calculating
as observed in the James Bay region including Akimiski Island period and region specific North American Breeding Bird Survey
(RWB, KFA unpublished data). The sparrow species for which we trends. Funding was provided by the Mississippi and Atlantic Flyway
estimated an increasing trend could have benefitted from shrub councils, Arctic Goose Joint Venture, Ontario Ministry of Natural
expansion at both sites. At Burntpoint Creek, only Lincoln’s and Resources and Forestry, the Canadian Wildlife Service, Northern
Song Sparrows showed an increasing trend which was consistent Scientific Training Program and Trent University.
with the regional scale but was opposite the high confidence trend
at the provincial scale. American Tree Sparrow indicated a negative
trend which was consistent with that found at Akimiski Island but
there were not any other high confidence trends estimated for other
LITERATURE CITED
Abraham, K. F., and R. L. Jefferies. 1997. High goose
geographic scales. The White-throated Sparrow had a low
populations: causes, impacts, and implications. Pages 7-72 in B.
confidence positive trend for Burntpoint Creek which was opposite
D. J. Batt, editor. Arctic ecosystems in peril: report of the arctic
the negative trends estimated at the provincial and national scales.
goose habitat working group. Arctic goose joint venture special
For Akimiski Island, only the Song Sparrow indicated an
publication. United States Fish and Wildlife Service, Washington
increasing trend while we estimated declining trends for the
D. C. and Canadian Wildlife Service, Ottawa, Ontario, Canada.
Lincoln’s and American Tree Sparrows. There was also a high
confidence negative trend estimated for the Lincoln’s Sparrow at ACIA. 2005. Arctic climate impact assessment. Cambridge:
the provincial scale. The evidence is not straight forward but our Cambridge University Press.
trend comparisons suggest that perhaps the local estimated positive
Ballantyne, K., and E. Nol. 2011. Nesting habitat selection and
trends for the Lincoln’s, Song, and possibly also the White-throated
hatching success of Whimbrels near Churchill, Manitoba,
Sparrows support the shrub encroachment hypothesis. These
Canada. Waterbirds 34:151-159. https://doi.org/10.1675/063.034.0203
species also had trends opposite those estimated for at least one of
the provincial or national scales. Targeted research is needed to
Biuw M., J. U. Jepsen, J. Cohen, S. H. Ahonen, M. Tejesvi, S.
more robustly explore potential drivers of the trends for these
Aikio, P. R. Wäli, O. P. L. Vindstad, A. Markkola, P. Niemelä,
species at our study sites.
and R. A. Ims. 2014. Long-term impacts of contrasting
Using alternate sources of information on bird population trends management of large ungulates in the Arctic tundra-forest
may be even more important for species at risk or species of special ecotone: ecosystem structure and climate feedback. Ecosystems
concern, particularly where there is little information. Recovery 17:890-905. https://doi.org/10.1007/s10021-014-9767-3
strategies and legislated requirements emphasize the need for trend
Bonter, D. N., and C. B. Cooper. 2012. Data validation in citizen
information for listed species to measure the success of recovery
science: a case study from Project FeederWatch. Frontiers in
strategies. We reported a low confidence trend (positive but 95%
Ecology and the Environment 10:305-307. http://dx.doi.
credible limits overlapping 0) for the Rusty Blackbird (Euphagus
org/10.1890/110273
carolinus) at Burntpoint Creek which is listed as a species of special
concern, mainly due to population declines from the loss of Brommer, J. E. 2004. The range margins of northern birds shifts
wintering habitat (COSSARO 2017, COSEWIC 2017). The Rusty polewards. Annales Zoologici Fennici 41:391-397.
Blackbird population was considered stable between 2004 and
Brook, R. W., J. O. Leafloor, K. F. Abraham, and D. C. Douglas
2014 in Canada (COSEWIC 2017) which overlapped the period
2015. Density dependence and phenological mismatch:
that they were monitored at Burntpoint Creek (2001 to 2018).
consequences for growth and survival of sub-arctic nesting
There was a positive highly confident trend at the regional scale
Canada Geese. Avian Conservation and Ecology 10(1):1. http://dx.
but trends at the provincial and national scale were of low
doi.org/10.5751/ACE-00708-100101
confidence.
Buij, R., T. Melman, M. Loonen, and A. D. Fox. 2017. Balancing
The collection of bird list data can be done with minimal effort
ecosystem function, services and disservices resulting from
while collecting data for other projects. In comparison with other
expanding goose populations. Ambio 46: 301-318. https://doi.
breeding bird surveys, it is not nearly as time consuming or as
org/10.1007/s13280-017-0902-1
expensive. For regions where there is little or no other monitoring
conducted for breeding birds, bird list analysis of time-series data Butler, R. W. 2000. Stormy seas for some North American
can be a valuable method to estimate trends. These types of songbirds: are declines related to severe storms during migration?
analyses may help fill a knowledge gap over a wide geographic area Auk 117:518-522. https://doi.org/10.1093/auk/117.2.518
where accessibility is poor and there is scant other information.Avian Conservation and Ecology 16(1): 10
http://www.ace-eco.org/vol16/iss1/art10/
Cadman, M. D., D. A. Sutherland, G. G. Beck, D. Lepage, and Statistics 4 (ed J. M. Bernado, J. O. Berger, A. P. Dawid and A. F.
A. R. Couturier (eds.). 2007. Atlas of the breeding birds of Ontario, M. Smith). Clarendon Press, Oxford, UK.
2001 - 2005. Bird Studies Canada, Environment Canada, Ontario
Iles, D. T., R. F. Rockwell, P. Matulonis, G. J. Robertson, K. F.
Field Ornithologists, Ontario Ministry of Natural Resources and
Abraham, C. Davies, and D. N. Koons. 2013. Predators,
Ontario Nature, Toronto, xxii + 706 pp.
alternative prey, and climate influence annual breeding success of
Callaghan, C. T., and D. E. Gawlik. 2015. Efficacy of eBird data a long-lived sea duck. Journal of Animal Ecology 82:683-693.
as an aid in conservation planning and monitoring. Journal of https://doi.org/10.1111/1365-2656.12038
Field Ornithology 86:298-304. http://dx.doi.org/10.1111/jofo.12121
Ims, R. A., J-A. Henden, M. A. Strømeng, A. V. Thingnes, M.J.
Garmo, and J. U. Jepsen. Arctic greeming and bird nest predation
COSSARO. 2017. Ontario species at risk evaluation report for
risk across tundra ecotones. Nature Climate Change 9:607-610.
Rusty Blackbird (Euphagus carolinus). Committee on the Status
https://doi.org/10.1038/s41558-019-0514-9
of Species at Risk in Ontario. [online] URL: http://cossaroagency.
ca/wp-content/uploads/2018/06/Accessible_COSSARO_Evaluation_Rusty- IPCC. 2018. Global warming of 1.5°C: An IPCC special report
Blackbird_FINAL_06FEB2018.pdf on the impacts of global warming of 1.5°C above pre-industrial
levels and related global greenhouse gas emission pathways, in the
COSEWIC. 2017. COSEWIC assessment and status report on the
context of strengthening the global response to the threat of climate
Rusty Blackbird Euphagus carolinus in Canada. Committee on the
change, sustainable development, and efforts to eradicate poverty,
Status of Endangered Wildlife in Canada. Ottawa. xi + 64 pp.
ed. V. Masson-Delmotte, P. Zhai, H. O. Pörtner, D. Roberts, J.
[online] URL: http://www.registrelep-sararegistry.gc.ca/default.
Skea, P.R. Shukla, A. Pirani, W. Moufouma-Okia, C. Péan, R.
asp?lang=en&n=24F7211B-1.
Pidcock, S. Connors, J.B.R. Matthews, Y. Chen, X. Zhou, M.I.
Crewe, T. L., J. D. McCracken, P. D. Taylor, D. Lepage, and A. Gomis, E. Lonnoy, T. Maycock, M. Tignor, and T. Waterfield. In
E. Heagy. 2008. The Canadian migration monitoring network - Press.
réseau canadien de surveillance des migrations: ten-year report on
Kellner, K. 2018. jagsUI: a Wrapper Around ’rjags’ to Streamline
monitoring landbird population change. CMMN-RCSM Scientific
’JAGS’ Analyses, R package version 1.5.0. [online] URL: https://
Technical Report #1. Produced by Bird Studies Canada, Port
cran.r-project.org/web/packages/jagsUI/index.html.
Rowan, Ontario, Canada.
Kerbes, R. H., K. M. Meeres, and R. T. Alisauskas. 2014. Surveys
Environment and Climate Change Canada. 2019. The Status of
of nesting lesser snow geese and Ross’s geese in Arctic Canada,
Birds in Canada Website, Data-version 2019. Environment and
2002-2009. Arctic goose joint venture special publication. U.S.
Climate Change Canada, Gatineau, Quebec, K1A 0H3) [online]
Fish and Wildlife Service, Washington, D.C. and Canadian
URL: https://wildlife-species.canada.ca/bird-status/index-eng.
Wildlife Service, Ottawa, Ontario.
aspx?sY=2019&sL=e
Kotanen, P. M., and K. F. Abraham. 2013. Decadal changes in
Environment and Climate Change Canada. 2018. Evaluation of
vegetation of a subarctic salt marsh used by lesser snow and
the migratory birds program. Environment Canada, Gatineau,
Canada geese. Plant Ecology 214:409-422. https://doi.
Quebec, K1A 0H3 [online] URL: http://publications.gc.ca/
org/10.1007/s11258-013-0178-x
collections/collection_2018/eccc/En4-337-2018-eng.pdf
Lamarre, J.-F., P. Legagneux, G. Gauthier, E. T. Reed, and J. Bêty.
Fernández-i-Marín, X. 2020. Using the ggmcmc package version
2017. Predator-mediated negative effects of overabundant snow
1.5.0. [online] URL: https://cran.r-project.org/web/packages/
geese on arctic-nesting shorebirds. Ecosphere 8: e01788. 10.1002/
ggmcmc/vignettes/using_ggmcmc.html.
ecs2.1788 https://doi.org/10.1002/ecs2.1788
Flemming, S. A., A. Calvert, E. Nol, and P. A. Smith. 2016. Do
La Sorte, F. A., and F. R. Thompson. 2007. Poleward shifts in
hyperabundant Arctic-nesting geese pose a problem for sympatric
winter ranges of North American birds. Ecology 88:1803-1812.
species. Environmental Reviews 24:1-10. https://doi.org/10.1139/
https://doi.org/10.1890/06-1072.1
er-2016-0007
Leafloor, J. O., K. F. Abraham, D. H. Rusch, R. K. Ross, and M.
Flemming, S. A., E. Nol, L. Kennedy, and P. A. Smith. 2019.
R. J. Hill. 1996. Status of the Southern James Bay population of
Hyperabundant herbivores limit habitat availability and influence
Canada Geese. Pages 103-108 in J. T. Ratti, editor. Proceedings of
nest-site selection of Arctic-breeding birds. Journal of Applied
the 7th international waterfowl symposium. Memphis, Tennessee,
Ecology 56: 976-987. doi: 10.1111/1365-2664.13336.
USA.
Forbes, B. C., M. M. Fauria, and P. Zetterberg. 2010. Russian
Leafloor, J. O., M. R. J. Hill, D. H. Rusch, K. F. Abraham, and
Arctic warming and ‘greening’ are closely tracked by tundra shrub
R. K. Ross. 2000. Nesting ecology and gosling survival of Canada
willows. Global Change Biology, 16, 1542-1554 https://doi.
geese on Akimiski Island, Nunavut. Towards conservation of the
org/10.1111/j.1365-2486.2009.02047.x
diversity of Canada Geese (Branta canadensis) (ed K. M. Dickson).
Gelfand, A. E., and A. F. Smith. 1990. Sampling-based pp 109-116. Canadian Wildlife Service Occasional Paper No. 103.
approaches to calculating marginal densities. Journal of the Ottawa, Ontario.
American Statistical Association 85:398-409. https://doi.
Link, W. A., J. R. Sauer, and D. K. Niven. 2006. A hierarchical
org/10.1080/01621459.1990.10476213
model for regional analysis of population change. Condor
Geweke, J. 1992. Evaluating the accuracy of sampling-based 108:13-24. https://doi.org/10.1093/condor/108.1.13
approaches to calculating posterior moments. In BayesianAvian Conservation and Ecology 16(1): 10
http://www.ace-eco.org/vol16/iss1/art10/
McKinnon, L., M. Picotin, E. Bolduc, C. Juillet, and J. Bêty. 2012. Arctic associated with recent climate change. Science 325:
Timing of breeding, peak food availability, and effects of 1355-1358. https://doi.org/10.1126/science.1173113
mismatch on chick growth in birds nesting in the High Arctic.
R Development Core Team. 2018. R: a language and environment
Canadian Journal of Zoology 90: 961-971. https://doi.org/10.1139/
for statistical computing. R Foundation for Statistical Computing,
z2012-064
Vienna, Austria.
Myers-Smith, I. H., B. C. Forbes, M. Wilmking, M. Hallinger, T.
Richards, S. A. 2007. Dealing with overdispersed count data in
Lantz, D. Blok, K. D. Tape, M. Macias-Fauria, U. Sass-Klaassen,
applied ecology. Journal of Applied Ecology 45:218-227. https://
E. Lévesque, S. Boudreau, P. Ropars, L. Hermanutz, A. Trant, L.
doi.org/10.1111/j.1365-2664.2007.01377.x
S. Collier, S. Weijers, J. Rozema, S. A. Rayback, N. M. Schmidt,
G. Schaepman-Strub, S. Wipf, C. Rixen, C. B. Ménard, S. Venn, Roach, J. K., B. Griffith, D. Verbyla, and J. Jones. 2011.
S. Goetz, L. Andreu-Hayles, S. Elmendorf, V. Ravolainen, J. Mechanisms influencing changes in lake area in Alaskan boreal
Welker, P. Grogan, H. E. Epstein, and D. S. Hik. 2011. Shrub forest. Global Change Biology 17: 2567-2583. https://doi.
expansion in tundra ecosystems: Dynamics, impacts and research org/10.1111/j.1365-2486.2011.02446.x
priorities. Environmental Research Letters 6, 045509
Roberts, R. L., P. F. Donald, and R. E. Green. 2007. Using simple
doi:10.1088/1748-9326/6/4/045509
species lists to monitor trends in animal populations: new
Newbold, T., S. H. M. Butchart, Ç. H. Şekercioğlu, D. W. Purves, methods and a comparison with independent data. Animal
and J. P. W. Scharlemann. 2012. Mapping Functional Traits: Conservation 10:332-339. https://doi.org/10.1111/j.1469-1795.2007.00117.
Comparing Abundance and Presence-Absence Estimates at x
Large Spatial Scales. PLoS ONE 7: e44019. doi:10.1371/journal.
Rockwell, R. F., C. R. Witte, R. L. Jefferies, and P. J. Weatherhead.
pone.0044019
2003. Response of nesting savannah sparrows to 25 years of
Nguyen, L. P., E. Nol, and K. F. Abraham. 2003. Nest success habitat change in a snow goose colony. Ecoscience 10:33-37.
and habitat selection of the semipalmated plover on Akimiski https://doi.org/10.1080/11956860.2003.11682747
Island, Nunavut. Wilson Bulletin 115:285-291. https://doi.
Rosenberg, K. V., A. M. Dokter, P. J. Blancher, J. R. Sauer, A. D.
org/10.1676/03-044
Smith, P. A. Smith, J. C. Stanton, A. Panjabi, L. Helft, M. Parr,
North American Bird Conservation Initiative Canada. 2019. The and P. P. Marra. 2019. Decline of the North American Avifauna.
State of Canada’s Birds, 2019. Environment and Climate Change Science 10.1126/science.aaw1313. https://doi.org/10.1126/science.
Canada, Ottawa, Canada. 12 pages. www.stateofcanadasbirds. aaw1313
org.
Ross, K. R., P. A. Smith, B. Campbell, C. A. Friis, and R. I. G.
Overpeck, J., K. Hughen, D. Hardy, R. Bradley, R. Case, M. Morrison. 2012. Population trends of shorebirds in southern
Douglas, B. Finney, K. Gajewski, G. Jacoby, A. Jennings, S. Ontario, 1974-2009. Waterbirds 35: 15-24. https://doi.
Lamoureux, A. Lasca, G. MacDonald, J. Moore, M. Retelle, S. org/10.1675/063.035.0102
Smith, A. Wolfe, and G. Zielinski. 1997. Arctic environmental
Roy, C., N. L. Michel, C. M. Handel, S. L. Van Wilgenburg, J. C.
change of the last four centuries. Science 278: 1251-1256. https://
Burkhalter, K. E. B. Gurney, D. J. Messmer, K. Princé, C. S.
doi.org/10.1126/science.278.5341.1251
Rushing, J. F. Saracco, R. Schuster, A. C. Smith, P. A. Smith, P.
Peterson, S. L., R. F. Rockwell, C. R. Witte, and D. N. Koons. Sólymos, L. A. Venier, and B. Zuckerberg. 2019. Monitoring
2013. The legacy of destructive snow goose foraging on supratidal boreal avian populations: how can we estimate trends and
marsh habitat in the Hudson Bay Lowlands. Arctic, Antarctic, and trajectories from noisy data? Avian Conservation and Ecology 14
Alpine Research 45:575-583. https://doi.org/10.1657/1938-4246.45.4.575 (2):8. https://doi.org/10.5751/ace-01397-140208
Sauer, J. S., D. K. Niven, and W. A. Link. 2004. Statistical analyses
Plummer, M. 2013. JAGS: Just Another Gibbs Sampler. [online]
make the Christmas Bird Count relevant for conservation. The
URL: http://mcmc-jags.sourceforge.net/.
104th Christmas Bird Count. American Birds 58:21-25.
Pollock, L. A., K. F. Abraham, and E. Nol. 2012. Migrant
Sauer, J. R., W. A. Link, J. E. Fallon, K. L. Pardieck, and D. J.
shorebird use of Akimiski Island, Nunavut: a sub-arctic staging
Ziolkowski Jr. 2013. The North American breeding bird survey
site. Polar Biology 35:1691-1701. https://doi.org/10.1007/
1966-2011: summary analysis and species accounts. North
s00300-012-1211-6
American Fauna 79:1-32. https://doi.org/10.3996/nafa.79.0001
Post, E. 2013. Erosion of community diversity and stability by
Serreze, M. C., J. E. Walsh. F. S. Chapin III, T. Osterkamp, M.
herbivore removal under warming. Proceedings of the Royal
Dyurgerov, V. Romanovsky, W. C. Oechel, J. Morison, T. Zhang,
Society B: Biological Sciences 280 (1757) https://doi.org/10.1098/
and R. G. Barry. 2000. Observational evidence of recent change
rspb.2012.2722
in the northern high-latitude environment. Climate Change
Post, E., M. C. Forchhammer, M. S. Bret-Harte, T. V. Callaghan, 46:159-207. https://doi.org/10.1023/A:1005504031923
T. R. Christensen, B. Elderling, A. D. Fox, O. Gilg, D. S. Hik, T.
Smith, A. C., and B. P. M. Edwards. 2020. North American
T. Høye, R. A. Ims, E. Jeppesen, D. R. Klein, J. Madsen, A. D.
breeding bird survey status and trend estimates to inform a wide
McGuire, S. Rysgaard, D. E. Schindler, I. Stirling, M. P. Tamstorf,
range of conservation needs, using a flexible Bayesian hierarchical
N. J. C. Tyler, R. van der Wal, J. Welker, P. A. Wookey, N. M.
generalized additive model. Ornithological Applications 123:1-16.
Schmidt, and P. Aastrup. 2019. Ecological dynamics across the
https://doi.org/10.1101/2020.03.26.010215You can also read