BLACK BEAR POPULATION MANAGEMENT PLAN - DAU B-11
←
→
Page content transcription
If your browser does not render page correctly, please read the page content below
BLACK BEAR
POPULATION MANAGEMENT PLAN
                      DAU B-11
            Roaring Fork and Eagle Valleys

               GAME MANAGEMENT UNITS
         35, 36, 43, 44, 45, 47, 361, 444, and 471
                         NW Region

                              Prepared by:
  Julie Mao (Terrestrial Wildlife Biologist, Area 8, Glenwood Springs)
    Matt Yamashita (Area Wildlife Manager, Area 8, Glenwood Springs)
 Jeromy Huntington (Area Wildlife Manager, Area 9, Hot Sulphur Springs)

                            Draft v.10.5
                            12/20/2021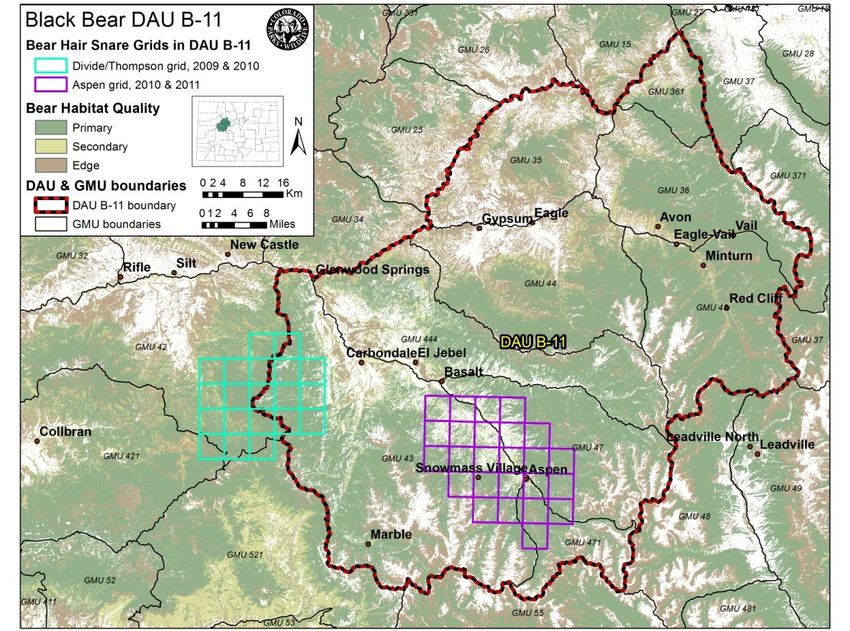
BLACK BEAR POPULATION MANAGEMENT PLAN
                       FOR DATA ANALYSIS UNIT B-11

EXECUTIVE SUMMARY
 GMUs: 35, 36, 43, 44, 45, 47, 361, 444, and 471 (Pitkin, Eagle, Garfield, Gunnison, and Grand counties)
 Land Ownership: 63% USFS, 22% Private, 14% BLM, 1% State,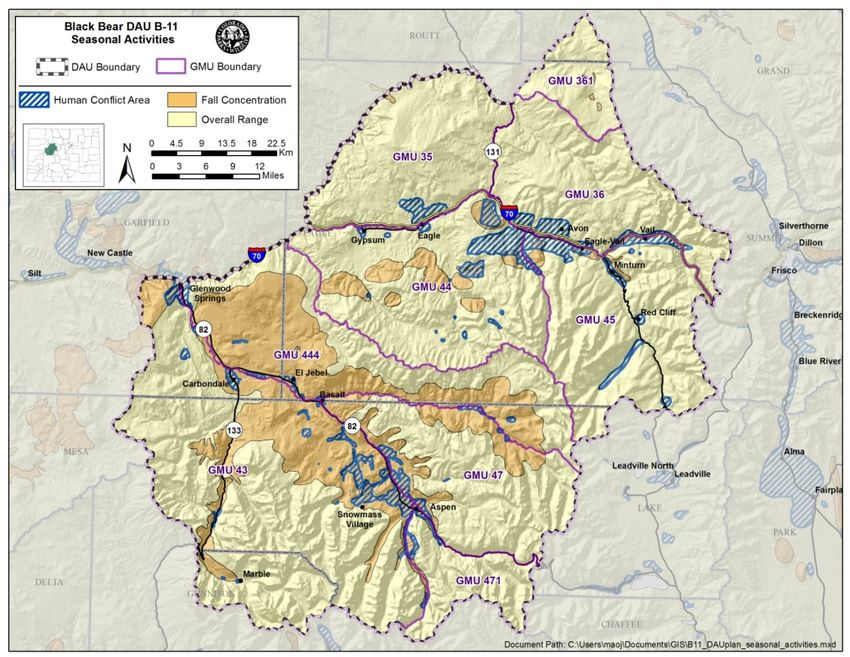
purposes of establishing management guidelines and objectives, we averaged the 4 models, yielding an
estimate of 1,040 adult and subadult bears as the current presumed population size.

SIGNIFICANT ISSUES
          The most significant issue regarding bear management in B-11 is managing conflicts between bears and
people. These conflicts generally involve bears feeding on trash, entering and damaging houses and vehicles, or
killing livestock. On rare occasions, direct contact between bears and humans has resulted in human injuries.
Conflicts are common in most towns within the DAU, especially during poor natural food years. Trash
ordinances have been adopted by many towns and counties in B-11 and have had varied success at reducing
available anthropogenic foods. In reality, however, trash continues to be a problem in many communities due
to poor compliance with trash ordinances. In 8 of the last 15 years, B-11 has had unprecedentedly high human-
bear conflicts, which have exceeded CPW field staff’s time and resources to reasonably handle.
          The cost of bear-related game damage claims in B-11 between 2002-2017 averaged $26,633 per year.
Domestic sheep kills were the overwhelming majority of claims. Landowner-caused bear mortalities account for
15-20% of total non-harvest bear mortalities, but there is no clear correlation between fall forage quality and
the number of landowner-caused mortalities.
          These bear management issues and the approaches needed to address them are complex and
multifaceted. The structure of a Bear Population Management Plan focuses primarily on one specific tool,
hunting, out of a suite of tools, including education, enforcement, and habitat modification, that can also be
used to manage conflicts. This plan provides harvest-related monitoring structures along with strategic goal
alternatives to manage the bear population size and human-bear conflicts in B-11. However, the types of
conflicts that occur between people and bears often require more than simple changes in licensing or hunting
structure in order to completely resolve the problem. Preventing human-bear conflicts by removing attractants
for bears is critical to addressing the source of the conflicts, rather than only dealing with the later
consequences through lethal removal of bears. Active and consistent involvement by residents and businesses
in the communities, trash companies, HOAs, local governments, and federal land management agencies to
substantially reduce and ideally eliminate the availability of human food sources for bears is needed to truly
and effectively resolve these bear management issues.

PREFERRED MANAGEMENT STRATEGY
        The top management priority in DAU B-11 is to reduce conflicts between humans and bears. In
addition, the quality of bear hunting experience and the persistence of a sustainable bear population are
additional priorities after human-bear conflict management. Importantly, without significantly reducing trash
and other human-associated attractants, human-bear conflicts will likely continue. CPW’s management
authority (and therefore this bear management plan) only directly covers management of wildlife, so it is
incumbent upon municipalities, residents and other stakeholders to collaboratively address the human
behaviors and activities which in turn affect bears’ foraging patterns.

        We considered two alternatives for future strategic goals for B-11’s bear population: Alternative 1
would manage for a stable bear population and no increase in human-bear conflicts, and Alternative 2 would
prescribe a reduction in the bear population through increased harvest until a 50% decrease in human-bear
conflicts is achieved. The preferred management strategy that CPW staff is recommending blends the two
alternatives, starting with the approaches outlined in Alternative 1 to maintain the current bear population
size and to avoid an increase in conflicts. If human-bear conflicts increase, however, the management strategy
would shift to Alternative 2.

Alternative 1: Stable population trend with social metric threshold
        Under Alternative 1, B-11 would be managed for a stable bear population trajectory and for no
increase in human-bear conflicts. A decrease in human-bear conflicts is desired and CPW will continue to work
with communities to educate residents and visitors on Bear Aware practices, and encourage municipal and
county authorities to strictly enforce trash ordinances. To allow a few years for communities to work on
                                                      ii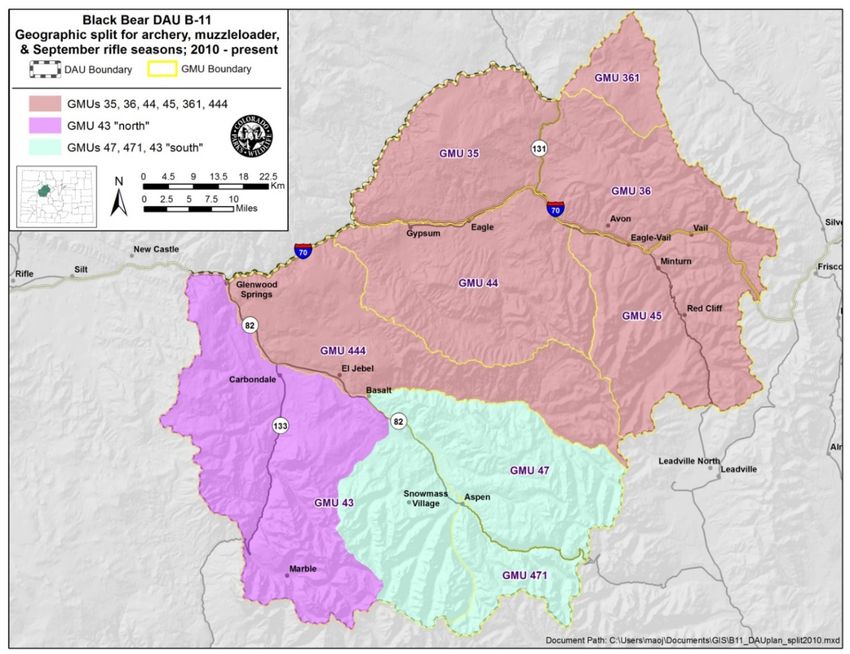
education and enforcement strategies, starting in the 5th year of implementation of this management plan, we
will examine whether these strategies are effective based on the number of human-bear conflicts. If human-
bear conflicts have increased beyond a 3-year average of 450 conflicts per year, then the management strategy
for B-11 would be changed to a bear population reduction strategy by increasing harvest, as described in
Alternative 2.
         The trend in 3-year averages of age/sex composition of the harvest should be consistent with that of a
stable population:
         (a) proportion of adult males in the harvest within 25-35%,
         (b) total females at 30-40% of total harvest,
         (c) adult females at 45-55% of the female harvest.
         The total mortality rate as a proportion of the population should fall in the 10-15% range. Based on the
current population estimate in B-11 of 1,040 bears, total mortality needed to maintain a stable population is
104-156 total bear mortalities per year. Deducting the current 3-year average non-harvest human-caused
mortality of 34 mortalities from the total mortality objective, the harvest objective should be 70-122 harvested
bears per year.
         CPW will continue to work with local municipalities, communities, and trash companies to emphasize
both Bear Aware information and education, as well as enforcement of trash ordinances and other regulations
aimed at reducing or prohibiting artificial food sources available to bears. Funding for efforts to reduce human-
bear conflicts will be instrumental. Internal CPW funds have been allocated to address human-bear conflicts in
B-11, but additional matching funds from local governments and organizations will also be necessary to affect
change on a scale significant enough to positively influence outcomes.
         In the 5th year of this plan, if the number of human-bear incidents (based on incidents logged in CPW’s
Wildlife Incidents App that are classified as conflicts) exceeds a 3-year average of 450 conflicts/year, then the
management strategy would shift to a bear population reduction objective through increased harvest (as
described in Alternative 2).
         Under Alternative 1, opportunities to obtain a bear license would remain under a limited license
structure and license quotas would remain similar to those of recent years. Unless communities are successful
at securing trash and other human food sources, human-bear conflicts would likely continue to be high in years
of poor natural foods. Vehicle collisions with bears and game damage would also remain similar to current
levels, assuming a stable bear population.

Alternative 2: Decreasing population trend with social metric thresholds
        B-11 would be managed for a decreasing population trend until social metrics show a reduction in
human-bear conflicts of at least 50% over a running 3-year average, or until harvest composition indices
indicate 3 consecutive years of declining population, at which time CPW would conduct a survey of B-11 bear
hunters to assess hunter satisfaction. (See main text for further details.)

        CPW’s primary tool to manage the overall bear population size is through regulating the amount of
harvest, but the agency does not have authority over enforcing people to secure their garbage. As observed in
other communities in the U.S. and Canada dealing with human-bear conflicts, a meaningful reduction in
conflicts only occurs when human-source foods are made unavailable to bears. CPW strongly encourages
people to follow bear-proofing guidelines and supports strict enforcement by local law enforcement
authorities of ordinances to secure garbage and other attractants.

                                                       iii
BEAR DATA ANALYSIS UNIT (DAU) B-11
                                           GAME MANAGEMENT UNITS
                                    35, 36, 43, 44, 45, 47, 361, 444, and 471
Table of Contents
EXECUTIVE SUMMARY ................................................................................................ i
Table of Contents ................................................................................................... iv
INTRODUCTION ....................................................................................................... 1
BEAR MANAGEMENT PLANS and WILDLIFE MANAGEMENT BY OBJECTIVES .................................... 1
DATA ANALYSIS UNIT DESCRIPTION ................................................................................ 2
        Location ...................................................................................................... 2
        Land Use and Land Status.................................................................................. 4
        Topography & Climate ..................................................................................... 4
        Vegetation ................................................................................................... 4
MANAGEMENT HISTORY ............................................................................................. 5
        Administrative ............................................................................................... 5
        Hunting Seasons ............................................................................................. 6
        License allocation history .................................................................................. 6
        Mortality - Harvest and Non-Harvest ..................................................................... 9
                 Mortality by method of take .................................................................... 10
                 Mortality by age and gender .................................................................... 12
        Urban Human-Bear Conflict Management ............................................................. 13
                 Human-Bear Incident Reports .................................................................. 15
                 Injuries to Humans ............................................................................... 15
                 Human-Bear Conflicts in Campgrounds and Dispersed Campsites ......................... 15
                 Control kills and translocations ................................................................ 16
                 Aspen Black Bear Research Study, 2005-2010 ................................................ 17
        Game Damage ............................................................................................. 19
        Current harvest and total mortality objectives ...................................................... 19
POPULATION MANAGEMENT CONSIDERATIONS ................................................................. 20
        Population Estimates ..................................................................................... 20
        Bear Fall Forage Quality: Mast Production Surveys .................................................. 21
        Total Mortality Rate ...................................................................................... 21
        Harvest Composition and Management Criteria ...................................................... 22
        Social Factors .............................................................................................. 24

                                                           iv
Predator-prey dynamics .................................................................................. 25
STRATEGIC GOALS AND MANAGEMENT OBJECTIVES ........................................................... 25
Process for Developing Strategic Goals and Management Objectives ............................. 25
B-11 Strategic Goal Alternatives ............................................................... 26
Public Process .................................................................................... 31
Data Monitored to Inform Management ................................................................ 34
Preferred Strategic Goal ................................................................................. 35
Mortality Objectives ............................................................................. 36
Age & Gender Harvest Composition Objective ............................................... 36
Social Objective .................................................................................. 36
LITERATURE CITED ................................................................................................. 37
APPENDICES ......................................................................................................... 41
Appendix A. Human population by county,1970-2019. .............................................. 41
Appendix B. Bear injuries to humans in B-11 ......................................................... 42
Appendix C. Bear population model versions ......................................................... 46
Habitat-based Population Models .............................................................. 46
Deterministic Population Models ............................................................... 49
Appendix D. Key study findings of Aspen bear research and implications for city policy ...... 51
Appendix E. Recommendations to Reduce Human-Bear Conflicts ................................. 52
Appendix F. General Public Survey Results and Comments ......................................... 53
Appendix G. Comments from other agencies and organizations ................................... 54
List of Figures
Figure 1. Management by objectives process used by the CPW to manage big game populations on a
DAU basis. ................................................................................................ 2
Figure 2. Location and land management type in B-11. ....................................................... 3
Figure 3. Black bear seasonal activities in B-11. ................................................................ 4
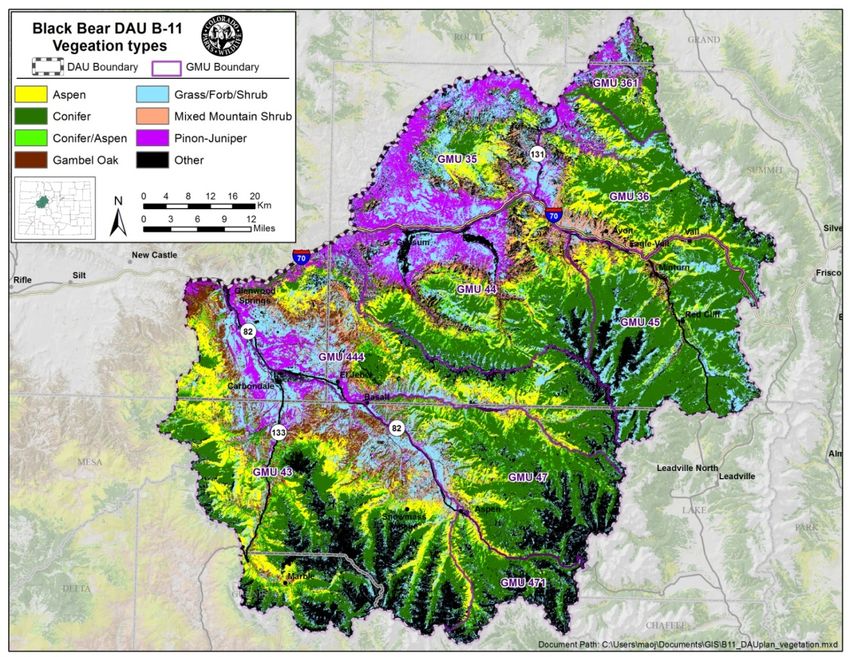
Figure 4. Vegetation classes in B-11. ............................................................................. 5
Figure 5. License quota history in B-11 by season, 1999-2020. ............................................... 7
Figure 6. Percentage of license quota sold in B-11, 1999-2020. .............................................. 8
Figure 7. Geographic split established in 2010 for archery, muzzleloader, and September rifle
licenses in B-11. ......................................................................................... 8
Figure 8. Harvest, control, other, and total annual black bear mortality in B-11, 1979-2020. ........ 10
Figure 9. Percent contribution of each season toward total harvest in B-11, 3-year average of 2018-
2020. .................................................................................................... 11
Figure 10. Number of bears harvested in B-11 by season, 1999-2020. ..................................... 11
Figure 11. License success rates in B-11 by season, 1999-2020. ............................................ 12
v
Figure   12. Age distribution of harvested bears in B-11, 2017-2019 (n=278)............................... 13
Figure   13. Age distribution of bears from non-harvest mortality sources in B-11, 2017-2019 (n=72). 13
Figure   14. Age and sex composition of harvested bears in B-11, 2017-2019 (n=279 bears). ............ 13
Figure   15. Non-harvest human-caused mortalities, including control mortalities, in B-11 are inversely
            correlated with the quality of fall mast (berries and acorns). .................................. 17
Figure   16. Game damage payments attributed to bears in DAU B-11, 2002-2019. ....................... 19
Figure   17. Annual harvest and mortality in B-11 in relation to DAU objectives. ......................... 20
Figure   18. Alternatives under consideration for B-11 managment strategies. ............................ 28
Figure   19. General public’s preferences for bear population management alternatives based on
            responses to the 2021 online survey, among (a) overall respondents, (b) respndents who are
            B-11 residents vs. others, (c) respondents who are bear hunters vs. non-bear-hunters, and
            (d) respondents who are bear hunters in B-11 vs. elsewhere in Colorado. ................... 33
Figure   20. Bear hair snare survey sites used for genetic capture-recapture surveys in
            Divide/Thompson creeks (2009-2010) and the Roaring Fork Valley (2010-2011). ............ 48

List of Tables
Table 1. Average annual number of bear mortalitites in B-11 by decade. ................................ 10
Table 2. Number of conflict and non-conflict reports in B-11 documented in the Wildlife Incidents
         database, 2019-2021. .................................................................................. 15
Table 3. Number of bears killed or translocated due to human-related conflicts in B-11, 2006-2020. 16
Table 4. Status of bears translocated from B-11 within 1st year after translocation, 2000-2013. .... 17
Table 5. Population estimates for B-11 from four population models. .................................... 20
Table 6. Summary of various population trajectory indices for B-11 based on 3-year averages of 2017-
         2019 harvest data. ...................................................................................... 21
Table 7. Black bear fall forage quality scores in B-11, 2008-2020. ......................................... 21
Table 8. Black bear age and gender in harvest composition as indicators of population trend. ....... 23
Table 9. B-11 harvest composition, averages by 3-year intervals. ......................................... 23
Table 10. Summary of current 3-year average harvest and mortality data for B-11. .................... 27
Table 11. Indices of bear population trajectory based on age and sex composition of harvest and total
         mortality rate. .......................................................................................... 34
Table 12. B-11 bear population estimated based on vegetation and density extrapolation. ........... 46
Table 13. Bear densities (per 100 km2) estimated using genetic capture-recapture methods. ........ 48
Table 14. B-11 bear population estimated based on use/occupancy density extrapolation. ........... 49

                                                          vi
B-11 Bear Management Plan, draft v10.5

INTRODUCTION
       Colorado Parks and Wildlife (CPW) manages wildlife for the use, benefit, and enjoyment of
the people of the state in accordance with the CPW’s Strategic Plan and mandates from the Colorado
Parks and Wildlife Commission and the Colorado Legislature. Colorado’s wildlife resources require
careful and increasingly intensive management to accommodate the many and varied public demands
and growing impacts from people. CPW is responsible for the maintenance of Colorado’s big game at
population levels that are established through a public review process and approved by the Colorado
Parks and Wildlife Commission.

BEAR MANAGEMENT PLANS and WILDLIFE MANAGEMENT BY OBJECTIVES
    To manage the state’s big game populations, CPW uses a “management by objective” approach
(Figure 1). Big game populations are managed to achieve objectives established for Data Analysis
Units (DAUs). DAUs are geographic areas that typically contain an individual big game population. For
large mobile carnivores like black bears, DAUs are primarily administrative constructs with generally
similar habitats and/or human social considerations. DAUs are composed of smaller areas designated
as game management units (GMUs), which provide a more practical framework where the
management goals can be refined and applied on a smaller scale, typically through hunting
regulations.

       The bear management planning process is designed to balance public demands, habitat, and
big game populations into a management scheme for the individual DAU. The public, hunters, federal
and local land use agencies, landowners, and agricultural interests are involved in determining the
plan objectives through input given during public meetings, the opportunity to comment on draft
plans and when final review is undertaken by the Colorado Parks and Wildlife Commission.

        The strategic goals and specific mortality objectives defined in the plan guide a long-term
cycle of annual information collection, information analysis, and decision-making. The end product
of this process is a recommendation for numbers of hunting licenses for the DAU (Figure 1). The plan
also specifically outlines the management techniques that will be used to reach desired objectives.
CPW intends to update these plans as new information and data become available, at least once
every ten years.

                                                  1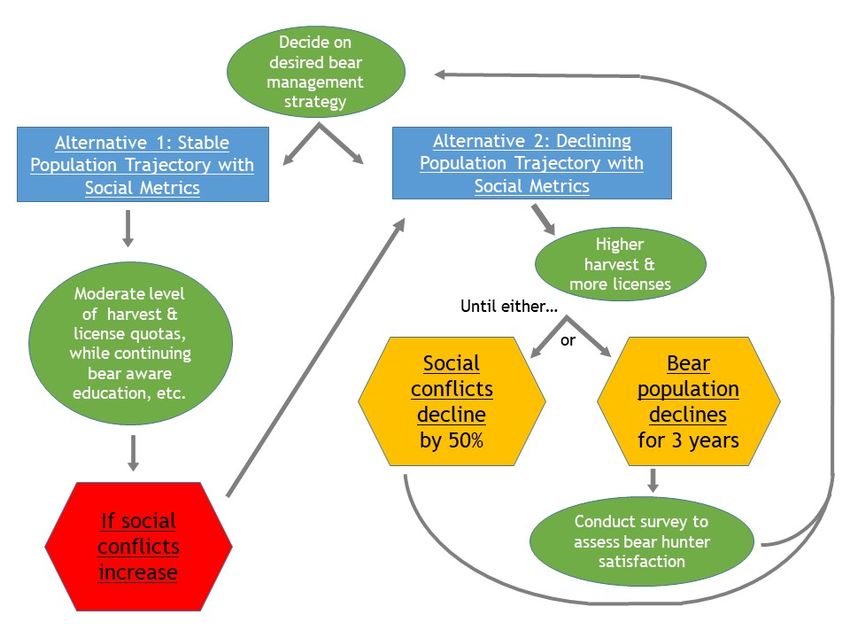
B-11 Bear Management Plan, draft v10.5

Figure 1. Management by objectives process used by the CPW to manage big game populations on a DAU basis.

       Black bear management issues and what tools should be used to address them are particularly
complex and multifaceted. Strategies in communities within B-11 and in other North American states
and provinces involving attempts at bear behavioral change, community education, enforcement of
ordinances requiring bear-proof garbage containers, the human dimensions component of human-
bear conflicts, etc. have been reviewed elsewhere (e.g., Peine 2001; Gore 2004; Tavss 2005; Kiel
2007; Baruch-Mordo et al. 2009, 2011, 2013; Johnson et al. 2018). The structure of a bear
management plan focuses on one specific tool, primarily hunting, out of a suite of tools, including
education, enforcement, and habitat modification, which also can be used to manage conflicts. This
plan provides harvest-related monitoring structures along with strategic goal alternatives that will
attempt to influence the bear population size in B-11. However, the types of conflicts that occur
between people and bears often require more than simple changes in licensing or hunting structure
in order to completely resolve the problem. Active involvement by residents and businesses in the
communities, trash companies, HOAs, and local governments to reduce and ideally eliminate human
food sources for bears are also critical to resolving bear management issues.

DATA ANALYSIS UNIT DESCRIPTION
Location
       Black bear DAU B-11 is located in the Roaring Fork and Eagle River valleys, including the
Frying Pan River, Crystal River, Homestake, Gore, Brush, and Gypsum Creeks, and also includes part
of the Colorado River watershed. The DAU includes Pitkin County, most of Eagle County, and portions
of Garfield, Gunnison, and Grand Counties. The Game Management Units (GMUs) in B-11 are 35, 36,
43, 44, 45, 47, 361, 444, and 471. Major towns in the DAU include Aspen, Snowmass Village, Basalt,
Carbondale, Glenwood Springs, Gypsum, Eagle, Edwards, Avon, and Vail.

        B-11 covers approximately 7,400 square kilometers (1.83 million acres) of land, managed by
various government agencies and private landowners (Figure 2). Nearly four-fifths of the DAU are
public lands. The US Forest Service (USFS) manages 63% of the land in the DAU. The Bureau of Land
Management (BLM) is the land manager for 14% of the DAU. The state of Colorado manages 1% of the
DAU which is mostly held as State Wildlife Areas and Colorado School Board lands. Less than 1 % of

                                                    2
B-11 Bear Management Plan, draft v10.5

the DAU is local city, county, and land trust/non-governmental organization properties. The
remaining 22% of lands within the DAU are in private ownership.

Figure 2. Location and land management type in B-11.

        The entire DAU is considered overall black bear range, although bear densities vary by habitat
type. Approximately 20% (1,500 km2) of the DAU’s land area is considered fall concentration habitat
for black bears (Figure 3). About 4% (320 km2) of the DAU is considered human conflict areas,
particularly in the towns of Aspen, Snowmass Village, Glenwood Springs, Eagle, Edwards, Avon, and
Vail. Bears concentrate in the fall during hyperphagia in areas with high mast crop production and/or
accessible human food sources.

                                                       3
B-11 Bear Management Plan, draft v10.5
Figure 3. Black bear seasonal activities in B-11.
Land Use and Land Status
Human development along the I-70 corridor and in the Roaring Fork Valley (State Highway 82)
and the associated human-bear conflicts in these developed areas are the dominant issues regarding
bear management in B-11. In the last 2-3 decades, all of the counties in B-11 have experienced
consistent and sometimes rapid human population growth (Appendix A), as well as commensurate
increases in roads, property subdivision, and development in bear habitat. Domestic sheep and cattle
graze some of the lands in GMUs 35, 36, 43, 44, 45, and 444, and livestock depredation by bears can
be a problem. See “Game Damage” section for additional information.
Topography & Climate
Elevations in the DAU range from over 14,000 feet in the Holy Cross and Maroon Bells-
Snowmass Wilderness areas to less than 5,700 feet along the Colorado River. Low elevations have
moderate winters and warm summers, and high elevations have long, cold winters and short, mild
summers. Precipitation varies from 17 inches annually at 6,000 feet elevation to 30-40 inches at
14,000 feet elevation. Prevailing winds are out of the west and southwest. Temperature generally
ranges from a low of –20 degrees F to a high of 95 degrees F.
Vegetation
Vegetation types in this unit are largely determined by elevation and aspect (Figure 4). The
mountain peaks above approximately 11,600 feet contain mostly bare rock or alpine communities.
Spruce-fir grows mostly between the elevations of 8,000 and 11,600 ft. Aspen and aspen-conifer mixes
4B-11 Bear Management Plan, draft v10.5
dominate the slopes from 7,000 to 8,500 feet. Mountain shrubs show up on lower slopes near 7,000
feet. Pinyon-juniper covers the lower foothills, and sagebrush parks appear on the more level sites as
elevation drops. Riparian vegetation grows along the creeks and rivers.
Aspen and riparian habitats provide bears with forage in the spring through mid-summer, and
coniferous forest provides shade and cover for resting habitat. In late summer into fall, lower elevation
mountain shrub and oakbrush become important habitats for bears as fall mast ripens. With the
abundance of aspen, serviceberry, chokecherry, and oakbrush, natural bear habitat is excellent in B-
11 (although forage quantity varies by year based on weather conditions). In addition to natural food
sources, bears living near human communities have another significant source of high-quality nutrition
in the form of anthropogenic food (all sources associated with human activities including trash, pet
food, barbeque grills, landscaping fruit trees, and bird feeders).
Figure 4. Vegetation classes in B-11.
MANAGEMENT HISTORY
Administrative
Bear DAU B-11 consists of GMUs 35, 36, 44, 45, 47, 361, 444, and 471 (Figure 2). GMU 361 was
established in 2010 by splitting the former GMU 36 into the current GMUs 36 and 361. The DAU is
bounded on the north by the Colorado River; on the east by the Gore Range divide, the Eagle River-
Tenmile Creek divide, and the Continental Divide; on the south by the Roaring Fork River-Taylor
River divide, the Roaring Fork River-East River divide, the Crystal River-East River divide, and the
Crystal River-Anthracite Creek divide; on the south and west by the Crystal River-Muddy Creek
5B-11 Bear Management Plan, draft v10.5
divide; and on the west by the divide between the Crystal River and Divide/Baldy/Garfield Creeks,
and by South Canyon Creek.
Hunting Seasons
Prior to 1935, black bears were not considered a game animal, which afforded them no
protection from being shot on sight if they were encountered. In 1935, they were awarded some
protection by being classified by the state legislature as a game animal. This regulation established
limits on the annual harvest and on the number of licenses that an individual could possess. From
1935 to 1963, bears were hunted in the fall usually concurrently with the annual deer and elk
seasons. In 1964, a spring hunting season was established with unlimited licenses available. This
continued until 1986, when licenses for the spring season were limited. The fall hunting seasons
occurred concurrently with the established deer and elk seasons, and licenses were unlimited until
the limited September rifle seasons were established in 1989 (Gill and Beck 1990). Hunters wishing to
hunt bears during the established deer and elk rifle seasons had access to unlimited licenses until
2005 when license caps were established for these seasons. In 1992, a state ballot amendment was
passed which changed bear hunting statutes within the state by prohibiting bear hunting prior to
September 2nd and banning the use of bait and dogs. In 2015, all B-11 licenses became List B
licenses, meaning a hunter can hold up to 2 bear licenses for B-11 huntcodes.
Under the current (2020-2024) big game season structure, archery and September rifle bear
seasons run from September 2-30. Muzzleloader season starts on the 2nd Saturday of September and
runs for 9 days, concurrent with deer and elk muzzleloader seasons. Starting in 2015, a single
concurrent bear rifle season replaced the individual 1st-4th rifle seasons. The concurrent rifle season
opens with 1st rifle elk season, ends with the close of 4th rifle deer/elk season, and is valid only
during open rifle deer or elk seasons. The September private-land-only (PLO) season and an extended
PLO season (October 1 to the end of 4th rifle season), which were originally instituted in B-11 in
2008, have become unlimited, over-the-counter (OTC) seasons under the 2020-2024 big game season
structure.
License allocation history
Before 1999, bear licenses were valid statewide. Starting in 1999, a quota for B-11 was
established for the September rifle season (Figure 5). Archery and muzzleloader licenses also became
DAU-specific, but were unlimited until 2005 when a quota was established for those seasons as well
(Figure 5). The concurrent (1st through 4th) rifle seasons were also unlimited until 2005 when those
licenses became over-the-counter (OTC) with caps. However, at the level the caps were set, they
had little functional impact on concurrent rifle season bear hunter opportunity because the license
caps were rarely reached (Figure 6). Under the current Big Game Season Structure (2020-2024),
these licenses became limited, rather than OTC with caps, but license quotas were left unchanged.
In 2010, archery, muzzleloader, and September rifle season quotas were raised significantly in
an effort to reduce the bear population in response to multiple years (2004, 2007, and 2009) of high
human-conflict issues in urbanized areas during years of natural food failures. The licenses for these
seasons also were geographically split into 3 portions of the DAU (Figure 7) to attempt to focus
harvest in the upper Roaring Fork valley where human-bear conflicts were especially severe. The
split within GMU 43 follows Capitol Creek and southward along the ridgeline of the Elk Mountains.
The southeastern part of GMU 43 is grouped with GMUs 47 and 471 under the 47 huntcode to
6B-11 Bear Management Plan, draft v10.5
encompass the upper Roaring Fork valley, and the remainder of GMU 43 has its own huntcode for
these seasons. GMUs 35, 36, 44, 45, 361, and 444 are grouped together under the 35 huntcode.
Quotas were raised again in 2012 and 2013 to attempt to continue to reduce the bear
population through harvest and to meet demand for licenses. The cumulative license quota increases
in 2012 and 2013 appear to have fulfilled hunter demand for licenses. Previously many huntcodes
sold out or came close to selling out, but as quotas were further raised, the percentage of the quota
sold dropped below 100% for most huntcodes in 2012 and well below by 2013 (Figure 6). However, in
2015, quotas were again raised significantly, mostly for the September rifle huntcodes (Figure 5).
With all B-11 licenses becoming List B licenses in 2015, the quota increase was meant to ensure that
enough licenses were available in case a large number of bear hunters wanted two B-11 bear
licenses. In reality, only 6% of B-11 license holders (n=94) in 2015 purchased a second B-11 license as
a List B tag.
Figure 5. License quota history in B-11 by season, 1999-2020.
7B-11 Bear Management Plan, draft v10.5
Figure 6. Percentage of license quota sold in B-11, 1999-2020.
Figure 7. Geographic split established in 2010 for archery, muzzleloader, and September rifle licenses in B-11.
8B-11 Bear Management Plan, draft v10.5
Mortality - Harvest and Non-Harvest
In general, overall annual bear mortality in B-11 has increased especially over the past 20
years (Figure 8). Since 1979, total bear mortality in B-11 has ranged from a low of 18 in 1993 to a
high of 161 in 2012. While the 10-year average of annual bear mortality is 118 bears, the 3-year
average is slightly higher at 135 bears, mostly due to higher harvest in recent years.
Mortality from hunter harvest has increased, particularly in the past several years since the
increase in license quotas. The 10-year average of hunting mortality is 80 bears per year, whereas
the 3-year average is 100 bears. Earlier, when bear license quotas were lower, from 1979-2009,
annual harvest averaged 28 bears. Through the 1980s and 1990s, harvest comprised almost all of
overall bear mortality (Figure 8 and Table 1). In the 2000s, control and other mortalities increased,
adding to total mortality as well as increasing in proportion. Since 2010, however, when the
significant license quota increases began, harvest now accounts for 2/3rds of overall mortality. The
vast majority of harvest occurs during the September seasons because this month coincides with the
peak of the bear hyperphagia period. Harvest and success rates decline in late October and
November as bears begin hibernating.
Control mortalities include bears killed for human conflict and damage control purposes by
CPW, landowners and their agents, or U.S. Department of Agriculture’s Animal and Plant Health
Inspection Service (APHIS)/Animal Damage Control (ADC). The 10-year average of control mortality is
23 bears, and the 3-year average is 17 bears. CPW-killed bears generally constitute 2/3rd of all
control kills, and bears killed by landowners/sheep-herders are about 1/3rd of all control mortalities.
“Other” mortalities are predominantly roadkilled bears but this category also includes other
accidental and miscellaneous mortalities. Both the 10-year and 3-year averages for “other”
mortalities are 15 bears/year. Roadkills generally make up over 80% of this category. Roadkill
mortalities are high during years of natural food failures when bears must range more widely in
search of food and therefore encounter roads and vehicles more frequently.
For the purposes of this B-11 management plan, we also define “non-harvest human-caused”
mortalities as the sum of the control mortalities and the roadkill subset from “other” mortalities.
Non-harvest human-caused mortality represents all non-hunting mortality that is directly human-
caused and excludes bears that died of accidents such as drowning or electrocution. These
accidental mortalities are opportunistically recorded and are negligible among the total “other”
mortalities.
The 3 most recent poor food years (defined as having a fall forage quality score of =5; years 2015, 2016, and 2018) had an average of
22 non-harvest human-caused mortalities/year (average of 15 control mortalities per year).
9B-11 Bear Management Plan, draft v10.5
Figure 8. Harvest, control, other, and total annual black bear mortality in B-11, 1979-2020.
Table 1. Average annual number of bear mortalitites in B-11 by decade.
Harvest Control Other
Time period Total
N/yr % of Total N/yr % of Total N/yr % of Total
1980s average 28 90% 2 6% 1 3% 31
1990s average 23 74% 4 13% 4 13% 31
2000s average 33 53% 16 26% 13 21% 62
2010s average 77 68% 22 19% 15 14% 107
Mortality by method of take
Among methods of take, the September rifle season contributes the most (76%) toward total
annual harvest, followed by September archery (10%) and the 1st-4th concurrent rifle seasons (9%)
(Figure 9).
With the license quota increases in 2010, 2012, 2013, and 2015, B-11 bear harvest has
increased dramatically, largely due to an increase in September rifle harvests (Figure 10). Harvest in
other seasons has fluctuated but generally remained the same as before the license quota increases.
Hunter success rates can vary annually depending on the quality of natural fall forage; in
poor food years, bears are more mobile while in search of forage, and therefore their encounter rate
with hunters is higher. In addition, bear density may be declining after multiple years of higher
harvest. More bear hunters in the field may crowd each other, and because more licenses are now
available to hunters, less experienced bear hunters may have lower success rates. The 3-year
average success rate for the September rifle season is 7%, slightly down from an earlier average of
10% about 10 years ago (Figure 9). Archery, muzzleloader, and concurrent rifle season hunters are
averaging a 2-5% success rate. The September PLO season has a success rate of 7% and the extended
PLO season averages a 5% success rate.
10B-11 Bear Management Plan, draft v10.5
Figure 9. Percent contribution of each season toward total harvest in B-11, 3-year average of 2018-2020.
Figure 10. Number of bears harvested in B-11 by season, 1999-2020.
11B-11 Bear Management Plan, draft v10.5
Figure 11. License success rates in B-11 by season, 1999-2020.
Mortality by age and gender
Beginning in 2006, a premolar tooth has been extracted from dead bears handled by CPW at
mandatory checks. These teeth are collected and submitted annually for aging via cementum annuli
sectioning at Matson’s Lab in Montana. The total sample size from 2006-2019 of B-11 bear mortalities
whose ages have been determined by this method is 877 bears out of 1,456 recorded mortalities.
The technique of counting annual rings in cementum of bear teeth is a reliable method for
determining ages of black bears (Harshyne et al. 1998, Costello et al. 2004). This is especially true
for bears less than five years of age. For bears five years of age or older, errors increased with the
age of the bear (McLaughlin et al. 1990, Harshyne et al. 1998, Costello et al. 2004). Since most
female black bears in Colorado do not reproduce until their 5th year, classification of females into
sub-adult (non-reproducing) and adult (reproducing) age classes using cementum annuli is quite
reliable. Therefore, all female black bears age five and over with evidence of having nursed young
are considered adults for the purposes of harvest data analyses.
Matson’s Lab also examines the cementum annuli to identify the years in which a sow
successfully raised a cub, enabling a reconstruction of a sow’s reproductive history. Based on teeth
collected from female bears in B-11 from 2006-2019, the average age of first reproduction was 4.7
(SE = 0.11; range = 3 to 7; n = 74). Similarly, sows captured for the Aspen research study had an
average age of first reproduction of 4.7 (SE = 0.30; range = 3 to 7; n = 12) and the statewide averages
have been 4.9, 4.6, and 4.7 years for 2017, 2018, and 2019 (M. Vieira, CPW, pers. comm., 9/14/21).
The ages of both harvested bears (Figure 12) and non-harvest mortalities (Figure 13) are
skewed towards the sub-adult (≤ 4 years old) age classes. Among known-age harvested bears in 2017-
2019, 38% were subadult males; 21% were subadult females; 20% were adult males; and 21% were
adult females (Figure 14). These data on the age and sex composition of harvested bears are used as
indicators of population trajectory based on the relative vulnerability of each age-sex class to being
harvested (see “Harvest Composition and Management Criteria” section below).
12B-11 Bear Management Plan, draft v10.5
Figure 12. Age distribution of harvested bears in B-11, 2017-2019 (n=278).
Figure 13. Age distribution of bears from non-harvest mortality sources in B-11, 2017-2019 (n=72).
Figure 14. Age and sex composition of harvested bears in B-11, 2017-2019 (n=279 bears).
Urban Human-Bear Conflict Management
Human conflicts with black bears in B-11 are common occurrences, particularly during poor natural
food years and in towns within bear habitat where human-related attractants remain high. Both bear
and human populations have increased over the past several decades, resulting in increased conflicts
between bears and humans. In the 1970s through 1990s, development of residential housing
encroached upon summer and fall habitats for bears, and over the past several decades, the human
population has grown, especially in Garfield and Eagle Counties (Appendix A), leading to both an
13B-11 Bear Management Plan, draft v10.5
increased overlap between bears and humans and an increased availability of human food sources.
The tourist-driven resort towns in B-11 have a large transient/seasonal human population, making it
challenging to achieve effective public education of Bear Aware principles, such as securing garbage
and keeping doors and windows closed and locked.
Human-bear conflict management is costly not only to the public and municipalities that must
pay for damaged property and (in rare cases of human injury) medical costs, but also to CPW staff,
USFS staff, and county and city law enforcement agencies. For example, during the poor natural food
year of 2009, CPW Area 8 (Glenwood Springs Service Center) personnel spent 5,651 hours handling
human-bear conflict issues, equating to $160,954 of personal service cost and $45,687 of fuel and
travel costs. These costs do not include lost opportunity costs such as law enforcement, fish
stocking, or other wildlife management work that was not done while Area personnel were focused
on black bear conflict management.
While the primary scope of CPW authority lies in the management of bears, it is important to
note that the reduction of human-bear conflicts also depends on change in human perception and
behaviors. CPW has a history of working closely with municipalities and county governments, federal
and county land management agencies and other stakeholders in an attempt to alter human
behavior. This collaboration has resulted in the implementation of trash storage ordinances in most
major towns and cities within B-11. Recently, stricter enforcement of these ordinances has also
started to generate increased compliance. To supplement municipal efforts, CPW has increased
routine nighttime hazing patrols to deter bears away from residential and urban settings before they
habituate to human-related attractants. In addition to traditional Bear Aware campaigns, CPW
worked with Pitkin County Open Space and Trails to organize the WildLives awareness campaign. The
campaign focused on providing wildlife messaging, including Bear Aware advisories, to non-
traditional audiences through digital media such as YouTube or Google and advertisement campaigns
on public transportation and electronic advertisement boards in the airport. Other efforts have
involved working closely with the municipalities of Aspen, Snowmass Village, and Basalt in the
Roaring Fork valley to routinely post banners, cardboard kiosks, and signs informing visitors of the
potential for human-bear conflict and how to avoid it. In 2019 CPW began to organize and coordinate
a county-wide Bear Summit in Pitkin County aimed at identifying key human bear conflict topics and
soliciting community buy-in and support. The goal of the summit was to identify meaningful goals
among towns, counties, land managers, and stakeholders that could be implemented to complement
one another and reduce attractants and minimize conflicts on a county-wide scale. This summit was
stalled in 2020 due to pandemic restrictions and budgetary constraints, but CPW staff has maintained
conversations with local governments and is working to re-engage in a collaborative summit.
As recognized by this plan, these efforts are not effective unless implemented and practiced
by all stakeholders. Community-wide participation should be a goal and focus for CPW and our
partners. Additionally, efforts must be ongoing. Bear activity in these areas remains high even in
good natural forage years, and the transient nature of residents and visitors requires continual
educational efforts to ensure everyone is being reached.
14B-11 Bear Management Plan, draft v10.5
Human-Bear Incident Reports
Starting in 2019 1, CPW began keeping track of human-bear encounters reported to CPW,
county sheriff offices, and municipal police/animal control departments through an electronically
recorded Wildlife Incidents database. These incidents range from a report of a bear sighting in a
residential or urban area to a physical interaction between a bear and a person. For the purposes of
defining a “conflict” in this B-11 management plan, we categorized incidents that involved a
complaint type 2 of Attack, Aggressive Behavior, Food Source Property Damage, or Non-Food Property
Damage to be a conflict, and we classified incidents with a complaint type of Sighting or
Unsubstantiated as non-conflict. With less than 3 full years of Wildlife Incidents App data so far
(Table 2), it is difficult to conclude any trends at this point. However, CPW staff in Area 8 anecdotally
estimate that over the past 12+ years, 600-900 conflict reports are common in poor natural food
years, compared to 300 or fewer conflict reports in good natural food years. Bears involved in
conflicts are handled according to CPW policy at the discretion of the field officer or supervisor.
Depending on the situation, the bears may be targeted for hazing or capture and then either
translocated or euthanized.
Table 2. Number of conflict and non-conflict reports in B-11 documented in the Wildlife Incidents database,
2019-2021.
Conflict Non-conflict
Food Source Non-Food Non-
Aggressive Property Property Conflict conflict
Year Attack Behavior Damage Damage Total Sighting Unsubstantiated Total
2019 (starting
4/1/2019) 3 23 542 33 601 528 25 553
2020 3 19 304 68 396 448 19 465
2021 (through
12/10/21) 0 10 375 73 458 516 7 523
3-year
average 2 17 407 58 485 497 17 514
Injuries to Humans
There have been 15 recorded incidents within B-11 of bears injuring humans, all occurring
during poor/marginal natural food years in 2004 (1), 2007 (2), 2009 (3), 2010 (1), 2011 (2), 2014 (1),
2017 (1), 2019 (3), and 2020 (3) (Appendix B). Nearly all of these incidents occurred in the town of
Aspen. Many involved a surprise encounter with a bear foraging in or near a house or dumpster, often
left unlocked and/or open. Typically, the bears had already habituated to feeding near people due
to the abundance of unsecured trash in towns.
Human-Bear Conflicts in Campgrounds and Dispersed Campsites
On National Forest lands within B-11, incidents involving bears in campgrounds or dispersed
campsites began to increase about a decade ago. In response, in 2014 the White River National
Forest (WRNF) instituted a bear-proof food storage requirement in many developed campgrounds and
some designated dispersed campsites, as well as anywhere in the backcountry in the Maroon Bells-
Snowmass Wilderness Area. In 2019, WRNF enacted food storage requirements at nearly all
1
Prior to 2019, incidents that CPW received were recorded on paper forms, but the paper records have not been
consistently digitized in a database and also lacked the incidents documented by other local law enforcement and animal
control offices. Therefore, the two datasets are not directly comparable.
2
For incidents in which multiple complaint types were selected, we classified the incident by its most severe complaint
type, using the following ranking from most severe to least severe complaint type: Attack, Aggressive Behavior, Food
Source Property Damage, Non-Food Property Damage, Sighting, Unsubstantiated.
15B-11 Bear Management Plan, draft v10.5
developed campgrounds and at additional designated dispersed campsites. Throughout this time,
human-bear conflicts at campgrounds and campsites continued; during some years, incidents have
been more frequent than others. When bear incidents have occurred or are imminent at a developed
campground, USFS has occasionally enacted emergency orders temporarily restricting camping to
hard-sided vehicles only or even closed portions of campgrounds. CPW officers will respond to bear
incidents in designated campsites, but generally not elsewhere on public lands unless an injury to a
human has occurred.
Control kills and translocations
Whereas in the past, control kills of bears for human-related conflict were uncommon, since
the mid-2000s control kills have increased both in number and as a proportion of total bear mortality
in B-11 (Figure 8 and Table 1). In B-11, bear conflict years are now the “new normal.” In the past 15
years, over half of the years (2007, 2009, 2011, 2012, 2014, 2016, 2017, 2019, 2020) had high human-
bear conflicts, resulting in an average of 53 bears per year either killed or translocated during those
years, compared to 21 bears killed or translocated in the other years (Table 3). Most of those high-
conflict years had either poor or marginal natural foods (Figure 15), resulting in bears foraging
heavily for anthropogenic food sources.
Table 3. Number of bears killed or translocated due to human-related conflicts in B-11, 2006-2020.
Control Killed Translocated Total bears
Age not Killed Age not Transloc. handled for
Year Cub Subadult Adult recorded total Cub Subadult Adult recorded Total conflict
2006 2 2 8 12 2 7 5 14 26
2007 5 9 27 2 43 7 18 16 41 84
2008 1 5 6 1 13 9 11 1 21 34
2009 2 11 18 3 34 15 25 15 55 89
2010 10 1 1 12 10 4 7 21 33
2011 1 8 11 1 21 10 9 5 24 45
2012 6 21 17 1 45 13 11 7 31 76
2013 7 3 10 1 1 11
2014 7 12 9 1 29 4 5 3 12 41
2015 1 6 3 10 1 1 2 12
2016 2 7 8 12 29 1 3 2 6 35
2017 1 18 5 9 33 5 1 2 8 41
2018 3 2 1 6 2 2 8
2019 2 8 10 3 23 2 1 3 26
2020 1 7 18 26 5 5 3 1 15 41
Total 31 134 146 35 346 81 105 68 1 256 602
16B-11 Bear Management Plan, draft v10.5
Figure 15. Non-harvest human-caused mortalities, including control mortalities, in B-11 are inversely correlated
with the quality of fall mast (berries and acorns).
Based on an earlier analysis of bears translocated from B-11 from 2000-2013, the fates of 55%
are unknown, 15% were known to be alive within their first year since translocation, and 30% were
confirmed dead within the first year (Table 4). The vast majority of translocated bears were not
radiocollared, so their known fates are based on opportunistic sightings, re-captures, and reported
mortalities. At least 11% of translocated bears returned to their original locations, and at least
another 10% returned to B-11 (but did not return to their presumed homeranges) within the first year
(Table 4).
Table 4. Status of bears translocated from B-11 within 1st year after translocation, 2000-2013.
"Returned" = bear returned to the original capture site (e.g., same town or locality); "Within B-11" = bear returned to B-11 but not to its
original capture site; "Not Returned" = bear did not return to B-11, "Unknown Loc" = bear's location was unknown. Some bears that are
listed as alive with unknown locations are bears that were confirmed alive in later years. Percentages of the overall total are shown in
parentheses.
Not Unknown
Status within 1st year Returned Within B-11 Returned Loc Total
Unknown 81 (55.1%) 81 (55.1%)
Alive 5 (3.4%) 2 (1.4%) 4 (2.7%) 11 (7.5%) 22 (15%)
Dead 12 (8.2%) 13 (8.8%) 17 (11.6%) 2 (1.4%) 44 (29.9%)
Human conflict 8 (5.4%) 7 (4.8%) 5 (3.4%) 1 (0.7%) 21 (14.3%)
Harvest 2 (1.4%) 2 (1.4%) 6 (4.1%) 1 (0.7%) 11 (7.5%)
Landowner/herder 2 (1.4%) 3 (2%) 5 (3.4%)
Roadkill 2 (1.4%) 2 (1.4%) 4 (2.7%)
Other 3 (2%) 3 (2%)
Grand Total 17 (11.6%) 15 (10.2%) 21 (14.3%) 94 (63.9%) 147 (100%)
Aspen Black Bear Research Study, 2005-2010
The high incidence of human-bear conflicts in B-11 prompted Colorado State University, the
National Wildlife Research Center (NWRC), and the former Colorado Division of Wildlife (now
Colorado Parks and Wildlife) to initiate an urban bear research study in Aspen that ran from 2005-
2010. Bears were captured in and near Aspen and were fitted with GPS collars to study their ecology
in an urban landscape.
17B-11 Bear Management Plan, draft v10.5
Aspen’s urban and peripheral areas have an abundance of both natural foods (aspen habitat
and berry and acorn mast) and human foods (garbage, fruit trees, pet food, birdseed, etc.) available
to bears. In some years, natural food sources fail due to spring frosts or drought conditions. Garbage
is the most readily available human food. Despite ongoing efforts to encourage people to secure
trash containers and dumpsters, over half of trash containers were found to be either non-bear-
resistant or not secured (Lewis 2013). When foraging in the urban landscape, bears were most likely
to select locations that had garbage present (both secured and unsecured trash containers) and that
were closer to riparian areas; in addition, bears also selected for sites with ripe anthropogenic fruit
(e.g., crabapples in downtown Aspen) during hyperphagia (Lewis 2013).
In years when natural foods failed, bears used high human-density urban areas to forage on
garbage and other human foods throughout the summer and into fall hyperphagia season (Baruch-
Mordo 2014, Lewis 2013). Many of the human-bear conflicts occur during those natural food failure
years when bears enter homes and vehicles either through open/unlocked doors and windows or
through forced entry by breaking through locked doors and windows. In good natural food years and
once fall mast became available, the same individual bears that foraged on human food sources in
poor years moved out of the urban areas to feed on natural foods in adjacent undeveloped areas,
suggesting in a cost-benefit framework that bears may perceive a risk of using urban areas despite
the benefits of foraging on garbage and fruit trees, and that bears’ use of urban areas and reliance
on human food resources can be reversible behaviors (Baruch-Mordo 2014). Conflicts generally
subsided in good natural food years, but for some bears that continued to forage within the urban
landscape, trash remained the most common food source, followed by natural mast (Lewis 2013),
which reinforces the management recommendation that securing trash attractants is important even
in good natural food years.
Litter sizes averaged 2.21 cubs and did not differ between good natural food years and food-
failure years (Baruch-Mordo 2014); however, survival of subadult and adult bears was significantly
lower in poor food years compared to good food years, mostly due to human conflict mortalities
(Baruch-Mordo 2014). Population models parameterized on vital rates from the Aspen bear study
suggest that during poor food years, the high mortality of adult females due to human conflict
outweighs the effect of undiminished litter sizes, which leads to a net declining population
trajectory (Lewis 2013; similar results were found in the Durango bear study, Johnson et al. 2020).
More frequent food-failure years may be becoming more common as the climate becomes warmer
and drier, and are predicted to cause a steeper decline in the bear population as a result of
increased adult female mortality in high conflict years (Lewis 2013).
To reduce human-bear conflicts, reducing the foraging benefits that bears obtain from human
foods would be more effective than increasing the behavioral costs (for example, by hazing) to bears
in urban areas (Baruch-Mordo et al. 2013). In a modeling simulation using data from the Aspen bear
study, if the availability of trash and other anthropogenic food sources were reduced by 55-70%, then
bears were predicted to avoid urban and urban-interface areas (Baruch-Mordo et al. 2013). To
minimize human food sources, garbage needs to be secured from bears; strict enforcement of trash
ordinances with issuance of warnings and tickets was found to be more effective at achieving secured
dumpsters and garbage containers than using bear-aware educational campaigns to educate residents
(Baruch-Mordo et al. 2011). Although educational campaigns are still important, trash and food
18You can also read