BofA 2022 Global Metals, Mining and Steel Conference - May 17-18, 2022
←
→
Page content transcription
If your browser does not render page correctly, please read the page content below

BofA 2022 Global Metals, Mining and Steel Conference
May 17-18, 2022

FORWARD LOOKING STATEMENTS
The information in this presentation has been prepared as at May 6, 2022. Certain statements contained in this presentation constitute "forward-looking statements" within the meaning of the United States Private Securities Litigation Reform Act of
1995 and "forward-looking information" under the provisions of Canadian provincial securities laws and are referred to herein as "forward-looking statements". All statements, other than statements of historical fact, that address circumstances,
events, activities or developments that could, or may or will occur are forward looking statements. When used in this presentation, the words "anticipate", "could", "estimate", "expect", "forecast", "future", "plan", "possible", "potential", "will" and similar
expressions are intended to identify forward-looking statements. Such statements include, without limitation: statements regarding the impact of the COVID-19 pandemic and measures taken to reduce the spread of COVID-19 on the Company's
future operations, including its employees and overall business; the Company's forward-looking guidance, including metal production, estimated ore grades, recovery rates, project timelines, drilling results, life of mine estimates, total cash costs per
ounce, AISC per ounce, minesite costs per tonne, other expenses and cash flows; statements relating to the expected outcomes of the Merger including synergies arising therefrom and their expected quantum and timing; the estimated timing and
conclusions of technical studies and evaluations; the methods by which ore will be extracted or processed; statements concerning the Company's expansion plans at Kittila, Meliadine Phase 2, the Amaruq underground project and the Odyssey
project, including the timing, funding, completion and commissioning thereof and production therefrom; statements about the Company's plans at the Hope Bay mine; statements concerning other expansion projects, recovery rates, mill throughput,
optimization and projected exploration, including costs and other estimates upon which such projections are based; statements regarding timing and amounts of capital expenditures, other expenditures and other cash needs, and expectations as to
the funding thereof; estimates of future mineral reserves, mineral resources, mineral production and sales; the projected development of certain ore deposits, including estimates of exploration, development and production and other capital costs and
estimates of the timing of such exploration, development and production or decisions with respect to such exploration, development and production; statements regarding anticipated cost inflation and its effect on the Company's costs; estimates of
mineral reserves and mineral resources and the effect of drill results on future mineral reserves and mineral resources; statements regarding the Company's ability to obtain the necessary permits and authorizations in connection with its proposed or
current exploration, development and mining operations and the anticipated timing thereof; statements regarding anticipated future exploration; the anticipated timing of events with respect to the Company's mine sites; statements regarding the
sufficiency of the Company's cash resources; statements regarding future activity with respect to the Company's unsecured revolving bank credit facility; statements regarding the NCIB, future dividend amounts and payment dates; and statements
regarding anticipated trends with respect to the Company's operations, exploration and the funding thereof. Such statements reflect the Company's views as at the date of this presentation and are subject to certain risks, uncertainties and
assumptions, and undue reliance should not be placed on such statements. Forward-looking statements are necessarily based upon a number of factors and assumptions that, while considered reasonable by Agnico Eagle as of the date of such
statements, are inherently subject to significant business, economic and competitive uncertainties and contingencies. The material factors and assumptions used in the preparation of the forward looking statements contained herein, which may prove
to be incorrect, include, but are not limited to, the assumptions set forth herein and in management's discussion and analysis ("MD&A") and the Company's Annual Information Form ("AIF") for the year ended December 31, 2021 filed with Canadian
securities regulators and that are included in its Annual Report on Form 40-F for the year ended December 31, 2021 ("Form 40-F") filed with the U.S. Securities and Exchange Commission (the "SEC") as well as: that governments, the Company or
others do not take additional measures in response to the COVID-19 pandemic or otherwise that, individually or in the aggregate, materially affect the Company's ability to operate its business; that cautionary measures taken in connection with the
COVID-19 pandemic do not affect productivity; that measures taken relating to, or other effects of, the COVID-19 pandemic do not affect the Company's ability to obtain necessary supplies and deliver them to its mine sites; that there are no significant
disruptions affecting operations; that production, permitting, development, expansion and the ramp up of operations at each of Agnico Eagle's properties proceeds on a basis consistent with current expectations and plans; that the relevant metal
prices, foreign exchange rates and prices for key mining and construction supplies will be consistent with Agnico Eagle's expectations; the ability to realize the anticipated benefits of the Merger or implementing the business plan for the combined
company, including as a result of difficulty in integrating the businesses of the companies involved; the ability to realize synergies and cost savings at the times, and to the extent, anticipated; the potential impact on exploration activities; the potential
impact of the consummation of the Merger on relationships, including with regulatory bodies, employees, suppliers, customers, competitors, First Nations and other key stakeholders; that Agnico Eagle's current estimates of mineral reserves, mineral
resources, mineral grades and metal recovery are accurate; that there are no material delays in the timing for completion of ongoing growth projects; that seismic activity at the Company's operations at LaRonde, Goldex and other properties is as
expected by the Company; that the Company's current plans to optimize production are successful; and that there are no material variations in the current tax and regulatory environment. Many factors, known and unknown, could cause the actual
results to be materially different from those expressed or implied by such forward looking statements. Such risks include, but are not limited to: the extent and manner to which COVID-19, and measures taken by governments, the Company or others
to attempt to reduce the spread of COVID-19, may affect the Company, whether directly or through effects on employee health, workforce productivity and availability (including the ability to transport personnel to fly-in/fly-out camps), travel
restrictions, contractor availability, supply availability, ability to sell or deliver gold dore bars or concentrate, availability of insurance and the cost thereof, the ability to procure inputs required for the Company's operations and projects or other aspects
of the Company's business; uncertainties with respect to the effect on the global economy associated with the COVID-19 pandemic and measures taken to reduce the spread of COVID-19, any of which could negatively affect financial markets,
including the trading price of the Company's shares and the price of gold, and could adversely affect the Company's ability to raise capital; the ability to realize the anticipated benefits of the Merger or implementing the business plan for new Agnico
Eagle, including as a result of a delay or difficulty in integrating the businesses of the companies involved; the volatility of prices of gold and other metals; uncertainty of mineral reserves, mineral resources, mineral grades and mineral recovery
estimates; uncertainty of future production, project development, capital expenditures and other costs; foreign exchange rate fluctuations; financing of additional capital requirements; cost of exploration and development programs; seismic activity at
the Company's operations, including the LaRonde Complex and Goldex mine; mining risks; community protests, including by First Nations groups; risks associated with foreign operations; governmental and environmental regulation; the volatility of
the Company's stock price; and risks associated with the Company's currency, fuel and by-product metal derivative strategies. For a more detailed discussion of such risks and other factors that may affect the Company's ability to achieve the
expectations set forth in the forward-looking statements contained in this presentation, see the AIF and MD&A filed on SEDAR at www.sedar.com and included in the Form 40-F filed on EDGAR at www.sec.gov, as well as the Company's other filings
with the Canadian securities regulators and the SEC. Other than as required by law, the Company does not intend, and does not assume any obligation, to update these forward-looking statements.
For a discussion of mineral reserves and mineral resources please see the notes to investors regarding the use of mineral resources in the appendix in this presentation. For a discussion of the use of certain non-gaap measures please see the notes
to investors in the appendix in this presentation.
Further Information – For further details on Agnico Eagle’s first quarter 2022 results, please see the Company's news release dated April 28, 2022.
Front Cover – Agnico Eagle’s LaRonde mine located in Quebec.

                                                                                                                                                                                                               BofA 2022 Global Metals, Mining and Steel Conference       2
THE NEW GOLD STANDARD
Simple, Consistent, Disciplined and Proven Approach to Value Creation

                                                                                                    Generating Superior Long-
              High-Quality Portfolio                        ESG Stewardship
                                                                                                   Term Returns to Shareholders

 •     Strategy of growing production per         •   Partner of choice within the mining      •    Strong Financial Position, with liquidity
       share by focusing on                           industry and the operating regions            of $2.3B* and net debt of $0.5B*
          •     Geological potential                    •   Focused on maintaining strong      •    Focus on growing per share metrics
                                                            community and indigenous
          •     Premier jurisdictions                       relationships                      •    Disciplined capital allocation
 •     Robust production profile from high-             •   Supporting local businesses to     •    Building on long history of consistent
       quality assets with low costs, strong                maximize regional procurement           capital returns
       margins and cashflows                      •   Recognized for leading industry                 •   A cash dividend has been declared
 •     Growth potential from existing                 practices in ESG by independent                     every year since 1983
       minesites and a pipeline of high-quality       research agencies                               •   Quarterly dividend of $0.40 per share
       exploration and development assets         •   Among the lowest GHG emission and               •   Normal course issuer bid to repurchase
                                                                                                          up to $500M in shares commenced in
 •     Opportunities to deliver on substantial        water consumption intensity within the
                                                                                                          May
       synergies and optimizations to add per         industry
       share value

 Note: * At March 31, 2022

                                                                                                                   BofA 2022 Global Metals, Mining and Steel Conference   3
HIGH-QUALITY, LOW-RISK SENIOR GOLD PRODUCER
Premier Global Mining Jurisdictions in North America, Europe and Australia

   Third Largest Global
      Gold Producer

    3.2 – 3.4 Moz (2022E)
  Cash Cost of 725 – 775 $/oz

  Largest Canadian Gold
        Producer

    2.4 – 2.5 Moz (2022E)

      Strong Mineral
      Reserve Base

       44.6 Moz (2021)

      Strong Mineral
      Resource Base

      M&I: 40 Moz (2021)
    Inferred: 31 Moz (2021)

                                                                             BofA 2022 Global Metals, Mining and Steel Conference   4
LOW RISK, MANAGEABLE PORTFOLIO
Located in 4 Countries and 5 Top Tier Mining Jurisdictions
                                                                                                      Increased Jurisdiction Mining-Relevant Risk
                                                                                                                                                                                                                                                  16
                                                                                                                                                                                               More Complex and Higher Risk

                                                                                                                                                                                                                                                  14
  Increased Business Complexity

                                                                                                                                                                                                                                                  12
                                                                                                                                                                                                Barrick
                                                                                                                                                       Newmont

                                                                                                                                                                                                                                                       Operating Countries
                                                                                                                                                                                                                                                  10

                                                                                                                                                                                                                                                  8

                                                                                                                                                          Kinross                                                                                 6
                                                                                                     Yamana                                                                                                  AngloGold

                                                                                                                                                                                                                                                  4

                                                                                                                                     Newcrest                                  Gold Fields
                                                                Agnico Eagle                                                                                                                                                                      2

                                          Less Complex and Lower Risk
                                                                                                                                                                                                                                                  0
                                      80                               75                              70                       65                        60                                               55                                50
                                                                                                     Gold production weighted Jurisdiction Mining-Relevant Risk
                             Note:
                             • Jurisdiction Mining-Relevant risk is calculated as a weighted average of the attributable gold production of the jurisdiction mining-relevant risk based on the World Risk Report 2021 (Mining Journal)
                             • Attributable gold production is based on 2022 guidance for Agnico Eagle, Newmont, Barrick, Yamana and Newcrest, and on 2021 actuals for AngloGold and Goldfields;
                             • Kinross attributable gold production and jurisdiction risk were based on 2022 guidance and were adjusted to remove production from the Russian assets; Newcrest attributable gold production and jurisdiction risk were based on 2022
                                guidance and were adjusted to add gold production from Brucejack

                                                                                                                                                                                                                      BofA 2022 Global Metals, Mining and Steel Conference   5
ESG is Central to our Strategy to Build a High Quality Business

➢ As the COVID-19 situation improved during Q1 2022, the Company began                       GHG Emissions in kt CO2 (Scope 1 & 2)
                                                                                  8,000
  the reintegration of its Nunavummiut workforce in mid-March with completion
  in April                                                                        6,000

                                                                                  4,000

➢ In Q1 2022, the Detour Lake mine was recognized for its research and            2,000
  progressive rehabilitation program and was awarded the Leading Practice            0
  Award by the International Network for Acid Prevention

➢ The Company expects to publish its 2021 sustainability report in Q2 2022,
                                                                                                          2019    2020      2021
  including information relating to the legacy Kirkland Lake Gold operations
                                                                                   Recognized for leading industry practices in ESG by independent
                                                                                                          research agencies
➢ The new Agnico Eagle continues to have one of the lowest greenhouse gas
  intensities among gold miners globally (0.37 tonnes CO2 equivalent per oz)      Rating Agency          Ranking Scale

                                                                                                         Leader (AAA, AA); Average (A,
                                                                                  MSCI Rating                                                                 AA
➢ The Company has committed to a net zero target for 2050 and pathways to                                BBB, BB); Laggard (B, CCC)

  achieve net zero, including specific reduction targets and other key climate-   RepRisk
                                                                                                         AAA low risk exposure;
                                                                                                                                                               A
                                                                                                         D high risk exposure
  related targets continue to be evaluated. An update on the Company's
  climate strategy is expected to be provided later in 2022                       Sustainalytics Risks   (40+ Severe Risk)                                    28

                                                                                                                 BofA 2022 Global Metals, Mining and Steel Conference   6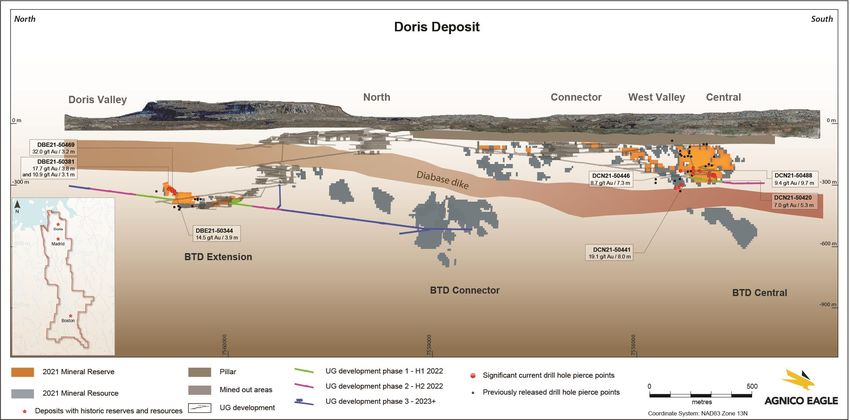
TRACK RECORD OF ADDING VALUE PER SHARE

                                           Gold Production (oz / 000 shares)
                                                                                                            ➢ Q2 2022 will be the first quarter with a full contribution from
                               10
                                                                                                              Detour, Macassa and Fosterville, which is expected to drive
Gold Prod. (oz / 000 shares)

                                8
                                                                                                              earnings and operating cash flow**
                                6

                                4                                                                           ➢ Mid-point of gold production guidance growing steadily from
                                2
                                                                                                              3.30Moz to 3.35Moz
                                0                                                                           ➢ Gold production is underpinned by six cornerstone assets with
                                    2005   2007    2009    2011   2013   2015     2017        2019   2021
                                                   Agnico Eagle     Kirkland Lake Gold
                                                                                                              production rates in excess of 300,000oz/yr – Detour, Fosterville,
                                                                                                              Meliadine, LaRonde, Meadowbank and Canadian Malartic
                                                  NAV per Share ($ / share)                                 ➢ Agnico Eagle has an attractive project pipeline supported by
                                                    CAGR - 2005 to 2021
                                                                                                              record exploration and meaningful investments in key growth
15%
                                    12%                                                                       projects:
10%
                                              6%                                                               ▪ Total exploration budget of $324M
     5%                                                   4%      4%
                                                                            3%
                                                                                         2%
                                                                                                     1%        ▪ Development capital of ~$700M
     0%

                                                                                                              ** Q1 2021 results include a full quarter of production from the Agnico Eagle mines and 52 days of production from the legacy
       Source: Scotia bank Global Banking and Markets, Bloomberg                                              Kirkland Lake Gold Ltd. mines (Detour Lake, Macassa and Fosterville) reflecting the period after the closing of the merger between
       * Peers Average include Barrick, Newmont, Kinross, Yamana, IAMGold                                     Agnico Eagle and Kirkland Lake Gold on February 8, 2022

                                                                                                                                                                                          BofA 2022 Global Metals, Mining and Steel Conference     7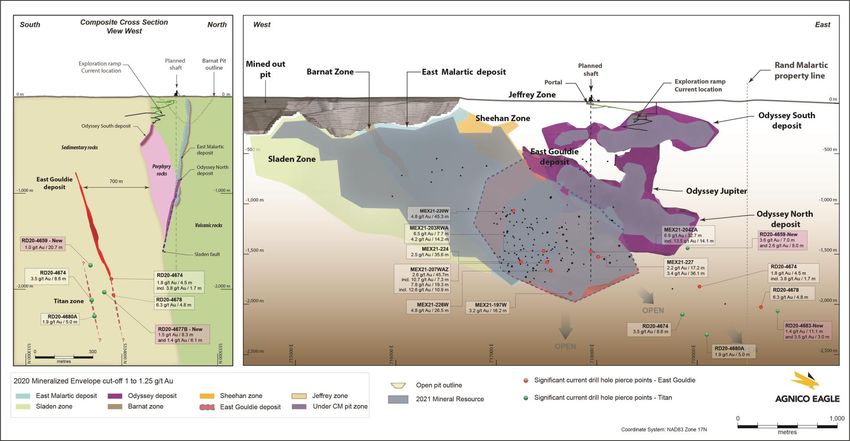
Key Value Drivers

➢ Odyssey Project – Underground development and surface construction activities remain on schedule and on budget. The Company is
  successfully building a highly skilled team and the project is considered an employer of choice in the Abitibi. Shaft sinking is expected to
  begin in Q4 2022 and the first underground production is expected to commence in H1 2023

➢ Detour Lake – Mill optimization projects are progressing as planned and drilling continues to intersect mineralization west of the
  resource pits. Additional mineralization has also been encountered at depth supporting the potential for future underground mining. A
  technical evaluation is underway with the goal of converting a portion of the 2021 mineral resources into mineral reserves in Q2 2022

➢ Macassa Mining Hub – At the AK deposit, the underground ramp from Macassa has been extended by 225m and drilling is underway.
  AK ore could complement the feed at the Macassa mill as early as 2024. At Upper Beaver, infill drilling continues to intersect significant
  mineralization and appears to have encountered a new zone of mineralization 500m southeast of the main mineralized zone

➢ Hope Bay – Drilling at the Doris deposit has discovered extensions to the known mineralized zones. Deep exploration drilling in the BTD
  Connector area returned highlights of 23.0 g/t gold over 5.0m at 502m depth and 9.4 g/t gold over 14.9m at 491m depth. Exploration is
  expected to continue through 2023 while a larger production scenario is being evaluated

                                                                                                                 BofA 2022 Global Metals, Mining and Steel Conference   8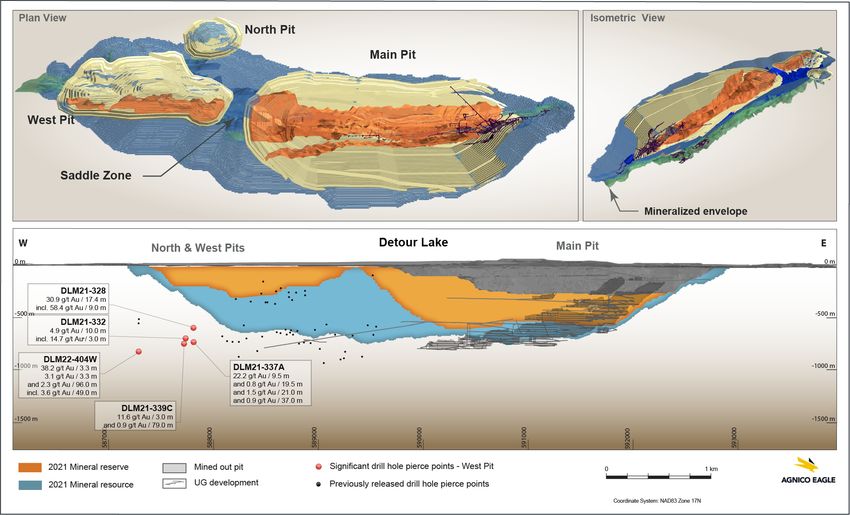
Synergy and Optimization Benefits Ahead of Estimates
Merger-related synergies now expected to be at the top end of the range of $40M to $60M in 2022

                   ➢ ~$45M synergies achieved to-date from streamlining personnel costs
                     and service contracts, lower finance and insurance costs and reduction
   Corporate         of office space
   Synergies       ➢ Now anticipate $40M to $50M/year (previously $35M/year)
                   ➢ $200M before tax in the first five years (up from $145M) and up to
                     $400M over the next ten years (up from $320M)                                 Synergies
                   ➢ Unification of mining operations and operational improvements
                   ➢ Procurement & warehousing savings
                                                                                                Targeting in pre-tax
  Operational
                                                                                              synergies & optimization
   Synergies       ➢ Forecast to be ~$25-35M for 2022
                                                                                                    benefits of
                   ➢ Target of ~$130M/year run-rate (~$30-40/oz)

                                                                                                   5 YR: ~$0.9B
                   ➢ Optimizing and consolidating infrastructure
                                                                                                   10 YR: ~$2B
                   ➢ Cross-pollination of best practices and innovation
   Strategic       ➢ Estimates of $240M over 5 years, $590M over 10 years
  Optimization     ➢ Priority opportunities include mining the AK deposit from Macassa with
                     initial production as early as 2024 and the Upper Beaver project

                                                                                                    BofA 2022 Global Metals, Mining and Steel Conference   9
STRONG GROWTH IN MINE OPERATING MARGIN

           $4,000

           $3,500

                                                                                                                                                      ➢ Production growth and low costs
           $3,000                                                                                                                                       post Merger drive significant free
                                                                                                                                                        cash flow generation
           $2,500
                                                                                                                                                      ➢ Potential uses of rising cash flow:
Millions

           $2,000
                                                                                                                                                         ▪   Increase dividends (and other forms
                                                                                                                                                             of capital return to shareholders,
                                                                                                                                                             including share buybacks)
           $1,500                                                                                                            Potential Total Capex

                                                                                                                                                         ▪   Funding exploration and internal
                                                                                                                                                             pipeline projects
           $1,000

                                                                                                                                                         ▪   Reduce net debt
            $500
                                                                                                                                                      ➢ A $100/oz increase in gold price
                                                                                                                                                        assumptions would add ~$330
              $0
                     2017              2018             2019              2020              2021             2022E             2023E          2024E     million in Mine Operating Margin
                    Sustaining Capex            Development Capital & Capitalized Exploration              Mine Operating Margin (Au $1850/oz)*

Note:
* Mine Operating Margin = ounces x (gold price – total cash costs per ounce).
  Mine Operating Margin based on Realized Gold Price for years 2015 to 2021 and based on $1850/oz gold price for year 2022 - 2024

                                                                                                                                                                 BofA 2022 Global Metals, Mining and Steel Conference   10
Strong Financial Position
Focused on Asset Development, Debt Repayment and Shareholder Returns
➢ As of March 31, 2022, the Company had strong liquidity with
Strong Available Liquidity - $2.3B*
$1.1B in cash and cash equivalents and $1.2B (excluding
$600M accordion) in undrawn credit lines available
➢ Net debt totaled $504M at March 31, 2022 and the Company
$1,062 M
$1,200 M repaid $125M of debt that matured on April 7, 2022
➢ On February 9, 2022, Fitch Ratings placed Agnico Eagle’s
BBB credit rating on a Positive Outlook. Current ratings are
Cash and cash equivalents Undrawn credit facilities
set below:
*As at March 31, 2022, excluding $600M accordion
Debt Maturities**
Agency Rating
$300
$250
$250
Fitch BBB (Positive)
$200
$200 DBRS BBB (Stable)
$150 $155
$150
$100 $100 $100 $100 $95
$110 Moody’s Baa2 (Stable)
$90
$100
$50
$-
$-
2022 2023 2024 2025 2026 2027 2028 2029 2030 2031 2032 2033
**As at April 28, 2022, in millions
BofA 2022 Global Metals, Mining and Steel Conference 11AGNICO EAGLE’S LONG HISTORY OF RETURNING VALUE TO SHAREHOLDERS
Consistent Dividend Payments; Normal Course Issuer Bid of up to $500M Commenced in May
An Attractive Sustainable Dividend Competitive
With Room To Grow Dividend Yield
Share
$400 $2,000
Buyback P P P O P ➢ Agnico Eagle has consistently paid a
4% dividend since 1983
$350
3.4%1
$1,800
$300
➢ Long history of creating value for
3.0%
3% shareholders
2.7%
$250 2.5%
US$ per ounce
$1,600
➢ Quarterly dividend increased by 14%
(In Millions)
1.7%
Dividend Yield (%)
2.3%
$200 to $0.40 per share in Q4 2021
2%
$150
$1,400 ➢ A share buyback launched in early
May with the ability to purchase up to
$100 $500M of common shares
1%
$1,200 1.7%
$50
$- $1,000 –
Total Annual Dividend Average Gold Price
Note: Market data as of May 4, 2022. Dividend yield based on
most recent quarterly dividend declaration annualized, except for
Newcrest which is based on sum of latest interim and final
dividends declared
1. Represents yield including annualized performance dividend of
US$0.40/sh based on current net cash position of US$743M
BofA 2022 Global Metals, Mining and Steel Conference 12THE NEW GOLD STANDARD
➢ Agnico Eagle plans to maintain a simple, consistent, disciplined and proven approach to value creation
▪ Low costs, strong margins and cashflows
▪ Robust production profile with strong growth prospects in premier jurisdictions
▪ Proven leadership with a track record of building per share value
➢ ESG leadership – A trusted and valued member of the communities in which we operate
➢ Growth potential from existing minesites and a pipeline of high-quality exploration and development assets
➢ Building on a long history of returning capital to shareholders – 38 years of consecutive dividend payments
and launch of a normal course issuer bid to repurchase up to $500M of common shares
BofA 2022 Global Metals, Mining and Steel Conference 13KEY VALUE DRIVERS
HIGH-QUALITY PRODUCTION ASSETS WITH GROWTH POTENTIAL
Low Risk Growth, Best Return on Capital Invested

            3.3 Moz Gold Production in 2022E1                                                            NEAR TERM VALUE DRIVERS

                                                                Jurisdiction

  Detour Lake
                                                                               ➢ Synergies and optimization opportunities
                                                          715     Canada

     Fosterville                                 400             Australia
                                                                               ➢ Odyssey Project – Project development and construction on schedule and on
                                                                                 budget; Exploration continues to expand East Gouldie mineral resources and test
      LaRonde                                380                  Canada         Odyssey internal zones
     Meliadine                              370                   Canada       ➢ Detour Lake Mine – New technical evaluation targeted for Q2 2022, expected to
                                                                                 show increased mineral reserves and enhanced production profile
 Meadowbank                                 348                   Canada

     Canadian                                                                  ➢ Macassa Mining Hub – Completion of the #4 Shaft project (expected in late 2022)
                                           320                    Canada
      Malartic
                                                                                 to drive future production growth; Evaluating the AK deposit using Macassa’s
          Kittila                    243                          Finland        infrastructure (potential to add 40koz/year by 2024)

      Macassa                  180                                Canada       ➢ Fosterville Mine – Exploration targeting the discovery of additional high-grade
                                                                                 zones that could potentially support higher production levels
        Goldex                135                                 Canada

                                                                               ➢ Kittila Expansion Project – Commissioning of shaft in early 2023 expected to
   Pinos Altos              128                                   Mexico
                                                                                 drive lower operating costs and provide drilling access to increase mineral
       La India          83                                       Mexico         reserves at depth
                    –          250               500     750                   ➢ Meliadine Phase 2 Expansion – Processing rate is forecast to increase to 6 ktpd
                                     Koz Au
                                                                                 by mid-2024; potential to optimize further to 6.25ktpd by 2026
Note:
1. Gold production based on mid-point of 2022 guidance

                                                                                                                                      BofA 2022 Global Metals, Mining and Steel Conference   15
ODYSSEY PROJECT – Focus on Infill Drilling and Expanding East Gouldie
Surface Construction and Underground Development Progressing as planned; Initial Production Expected in 2023
➢ At East Gouldie, the 2021 drilling
campaign confirmed the higher-
grade nature of the core of the
deposit and the simple and
consistent geometry of the zone. It
indicates that drill spacing of 80m
could be sufficient to convert to
mineral reserves
➢ The East Gouldie eastern extension
was intersected more than 1.2km
away from the current mineral
resources limit onto the adjacent
Rand Malartic property,
demonstrating significant resource
growth potential
➢ At Odyssey, recent underground drill
results in the Internal Zone and the
Jupiter Zone continue to
demonstrate the potential to add
mineral resources near the Odyssey
North and Odyssey South Deposit
See AEM February 23, 2022 press release and appendix for detailed breakdown of mineral reserves and mineral resources BofA 2022 Global Metals, Mining and Steel Conference 16DETOUR LAKE – Ongoing Exploration Expected to Drive Future Mineral Reserve Growth
Evaluating Options to Optimize and Potentially Increase the Mining and Milling Rates
➢ Historically, Detour Lake Gold conducted
limited diamond drilling outside of the
known mineral reserve areas
➢ Exploration carried out since 2020
identified a broad and continuous
corridor of mineralization extending over
4km from the Main Pit through the
Saddle Zone to the planned West Pit to
a depth of at least 800m below surface
with the system remaining open
➢ Another key target included the area
west of the existing West Pit mineral
reserves (an area that had seen limited
previous drilling)
➢ The Company is evaluating options to
optimize and potentially increase the
mining and milling rates to 32 million
tonnes per year, and to investigate
underground potential below the open pit
See AEM February 23, 2022 press release and appendix for detailed breakdown of mineral reserves and mineral resources BofA 2022 Global Metals, Mining and Steel Conference 17MACASSA – Potential to Create a Regional Mining Complex
Completion of #4 Shaft Project in 2022 Expected to Provide Opportunities for Increased Production Starting in 2024
➢ The Company is assessing
opportunities to incorporate the
AK Zone into the mine plan
starting in 2024. A 1.3km
exploration ramp from the Near-
Surface area is being developed
in order to access and infill drill
the AK deposit
➢ Infill drilling of the AK deposit
from surface was initiated in Q1
2022
➢ Exploration drilling is ongoing to
define and extend mineralization
at the South Mine Complex,
Main Break and ’04 Break
See AEM February 23, 2022 press release and appendix for detailed breakdown of mineral reserves and mineral resources BofA 2022 Global Metals, Mining and Steel Conference 18HIGH QUALITY PROJECT PIPELINE TO DRIVE FUTURE GROWTH
Low Risk, Regional Growth
ADVANCED PIPELINE PROJECTS MEDIUM TERM VALUE DRIVERS
1,2
ESTIMATED
GROWTH ➢ Hope Bay – Excellent potential to increase mineral reserves and
PROJECT STAGE ANNUAL TIMELINE
PRODUCTION
CAPITAL mineral resources in all deposit areas and regionally; Evaluating
the potential to develop a 4,000tpd underground operation
Hope Bay Advanced 250 – 300 koz > 2024 ➢ Macassa Mining Hub – Optimization and consolidation of
mining assets and infrastructure; Studies ongoing to advance
Upper Beaver Advanced 150 – 250 koz > 2027 Upper Beaver into production
➢ Hammond Reef – Mineral reserves declared in 2020; High
Hammond Reef Advanced 275 koz > 2030 tonnage low grade deposit; Optimization studies are ongoing
➢ Santa Gertrudis – Drilling focused on expanding the mineral
Santa Gertrudis Concept 100 - 150 koz > 2025 resources; Internal studies and metallurgical work ongoing
Odyssey ➢ Odyssey / Rand Malartic / Camflo – Extensions of the East
Extension – Concept 150 – 250 koz > 2030 Gouldie mineralization to the east or west could potentially
Rand Malartic3
support the concept of a new production center; An initial
Note:
evaluation of the Camflo property has identified porphyry hosted
1. Project start timelines are indicative and may change as
exploration and study work proceeds and based on market
APPROXIMATE GROWTH CAPITAL gold mineralization with potential to be mined via an open pit
conditions and board approval
2. Projects are under study and have not been approved for
development and additional permits may be required >$700M $450M to $150M toHOPE BAY – Expanding Doris Deposit; Mineralization Remains Open in All Directions
➢ Testing the extension of mineralization along strike to the south and to the north
➢ Testing the deep extensions below the dike to expand the BTD Extension, Connector and Central zones with a focus on
infilling gaps between the mineral resource areas
See AEM February 23, 2022 press release and appendix for detailed breakdown of mineral reserves and mineral resources BofA 2022 Global Metals, Mining and Steel Conference 20Select Exploration Properties, Joint Ventures / Earn-Ins and Equity Investments*
Longer Term Generative Opportunities
*Public Equity Investments where AEM has over 10% ownership
For a discussion of the risks associated with joint ventures and equity investments, please see the AIF
BofA 2022 Global Metals, Mining and Steel Conference 21Q1 2022 RESULTS
First Quarter 2022 Highlights

➢ Solid quarterly production and costs despite COVID-19 challenges – Payable gold production in Q1 2022 was 661koz at production
  costs/oz of $1,002, total cash costs/oz of $811 and all-in sustaining costs ("AISC")/oz of $1,079. Including a full quarter of production
  from the legacy Kirkland Lake Gold mines, total payable gold production in Q1 2022 was 806koz

➢ Several key cornerstone assets delivered strong operational performance – Good position to deliver on 2022 guidance forecasts

➢ COVID-19 challenges seen in late 2021 and early 2022 appear to be moderating – Production and costs in Q1 2022 were generally
  in line with forecasts despite COVID-19 challenges

➢ Gold production, cost and capital expenditure guidance reiterated for 2022

➢ Inflationary cost environment continues to evolve – Cost pressures were relatively minor in Q1 2022. The Company will continue to
  monitor and assess any impacts on forecasted costs as inflation could have more of an affect during the remainder of the year

➢ Kirkland Lake Gold Ltd. merger completed February 8, 2022; focus now on delivering synergies and maximizing value drivers –
  The senior management team has been finalized and corporate synergies are ahead of estimates

➢ Debt repayment of $125M completed in April and share buyback launched in early May

➢ A quarterly dividend of $0.40 per share has been declared
                                                                                                               BofA 2022 Global Metals, Mining and Steel Conference   23
Operating and Financial Results
Solid Quarterly Production and Costs Despite COVID-19 Challenges
Q1 2022*
Production Total Cash Costs Operating Margin
(Gold oz) ($/oz) ($000’s)
LaRonde Complex 105,037 $560 $120,220
Canadian Malartic (50%) 80,509 792 79,302
Goldex 34,445 777 37,118
Detour Lake 100,443 600 128,058
Macassa 24,488 787 24,155
Meliadine 80,704 1,002 84,279
Meadowbank 59,765 1,811 -5,198
Fosterville 81,827 309 106,856
Kittila 45,508 1,039 46,111
Pinos Altos 25,170 1,078 19,431
Creston Mascota 1,006 407 1,177
La India 21,702 820 22,300
Total 660,604 $811 $663,809
* These results include a full quarter of production from the Agnico Eagle mines and 52 days of production from the legacy Kirkland Lake Gold Ltd. mines (Detour Lake, Macassa and Fosterville) reflecting the period after the closing of the
merger between Agnico Eagle and Kirkland Lake Gold on February 8, 2022
Strong Cash Flow Generation Expected in 2022 Q1 2022 Total Operating Margin $664M
Q1 2022 Q1 2021 Mexico, 6%
Abitibi - Quebec, 36%
Realized Gold Price ($/oz) $1,880 $1,780
Revenues (millions) $1,326 $950 Finland, 7%
Net Income (millions) $110 $145
Net Income per share (basic) $0.29 $0.60
Nunavut, 12% Abitibi - Ontario, 23%
Cash provided by operating activities** (millions) $507 $367
** After changes in non-cash components of working capital Australia, 16%
BofA 2022 Global Metals, Mining and Steel Conference 24Abitibi Region – Quebec
Production Q1 2022 Production and Highlights
Costs
LaRonde Complex
105,037 ozs • Production in Q1 2022 was better than expected due to higher gold grades; mine is in a good position to deliver on 2022 guidance
• UG development underperformance related to COVID-19 results in a change in mining sequence, production in H2 expected to be slightly weaker than in H1
at a production cost of $596/oz
and total cash costs of $560/oz • In Q1 2022, the main drivers of lower total cash costs per ounce (than forecast) were higher gold production and lower operating costs related to the capex/opex
development metres ratio, offset by higher fuel and material costs
Proven & probable gold • During Q1 2022, at the LaRonde mine, 31% of the production mucking was done autonomously, in line with target. At the LZ5 mine, 21% of the production mucking
reserves: 3.8Moz was done in automated mode, compared to an objective of 23%
• The construction of the drystack tailings facilities is progressing on schedule. The filter press installation is almost complete and electrical and instrumentation work
began in late March. The drystack tailings facility is expected to be operational by the end of 2022
Canadian Malartic (50%)
80,509 ozs • During Q1 2022, production was generally in line with forecast despite the challenging conditions (COVID-19 and extreme cold temperatures) and slightly lower
grade than expected
at a production cost of $707/oz • In February 2022, the Partnership adjusted the milling rate to 51.5k tpd to optimize the processing plan to improve the production profile during the transition to the
and total cash costs of $792/oz Odyssey underground project
Proven & probable gold • The Odyssey project remains on schedule and budget. Inflationary cost pressures remain manageable and from a labour perspective, the Odyssey project is
reserves: 1.8Moz viewed favourably by workers in the region
• During Q1 2022, the Partnership repurchased the 2% NSR royalty on the Rand Malartic property for $7M
• In 2021, the Camflo property was added to the Partnership's land holdings. The Camflo property covers the past producing Camflo (1.6Moz gold historically). An
initial evaluation of the Camflo property has identified porphyry hosted gold mineralization that could potentially be mined via an open pit
Goldex
34,445 ozs • Gold production in line with forecast driven by higher throughput levels from the Rail-Veyor and South Zone
• In March 2022, the Rail-Veyor set a record at an average of 7.6k tpd (above its design capacity) and had the best single day performance ever at 10.7 tonnes
at a production cost of $761/oz
• Ore production from the South Zone was 960 tpd in Q1 2022 and reached a record 1,689 tpd in March
and total cash costs of $777/oz
• Mining at South Zone sector #2B started ahead of schedule and good exploration results were reported from between levels 094 and 098 (10.0 g/t gold over 3.0m
Proven & probable gold at 956m depth and 21.2 g/t gold over 3.0m at 955m depth)
reserves: 1.0Moz • South Zone Sector #3 also yielded strong conversion and delineation drill results, including 10.2 g/t gold over 5.3m at 1,288m depth and 19.4 g/t gold over 5.7m at
1,264m depth
See AEM February 23, 2022 press release and appendix for detailed breakdown of mineral reserves and mineral resources BofA 2022 Global Metals, Mining and Steel Conference 25Abitibi Region – Ontario
Production Q1 2022 Production and Highlights
Costs*
Detour Lake
100,443 ozs • For the full Q1 2022, gold production at Detour Lake was 182koz
• In Q1 2022, despite cost pressures related to higher fuel and higher electricity prices, the Detour Lake mine achieved lower total cash costs per ounce than guided
at a production cost of primarily due to higher gold grade
$1,194/oz
and total cash costs of • Several projects are underway to progressively increase the mill throughput to 28Mtpy by 2025, including pre-screening before the secondary crusher, construction of
$600/oz additional CIP leach tanks, an upgrade to the gravity circuit, construction of an assay lab, an upgrade of the 230kV main substation
• A technical evaluation is underway with the intent of converting a portion of 2021 mineral resources into mineral reserves, update the life of mine plan and incorporate
Proven & probable gold the mill optimization projects designed to increase mill throughput to 28Mtpa by 2025. Highlights from the evaluation will be provided in the Company’s Q2 2022 news
reserves: 15.0Moz release in July
• The Company is also assessing the potential for an underground operation and the expansion of production to 32Mtpa
Macassa
24,488 ozs • For the full Q1 2022, gold production at Macassa was 44koz, in line with forecast. The higher than forecast mined and milled tonnage was offset by lower mined
grades than anticipated
at a production cost of • Increased underground operational efficiencies due to better than expected development rates (47% ahead of forecast) and stope availability drove the higher than
$1,320/oz forecast ore tonnage mined
and total cash costs of
$787/oz • In Q1 2022, the planned work on the #4 Shaft project remained on schedule. On level 6300, the focus was on developing the new conveyor drift and loading pocket.
Completion of the #4 Shaft project is expected in late 2022
Proven & probable gold • The upgrade of the ventilation system progressed as planned. This upgrade is expected to increase ventilation capacity from ~300k cfm to ~750k cfm to support the
reserves: 1.9Moz increase in underground production in 2023 and 2024
• Construction to increase the power supply at Macassa is expected to begin in Q3 2022 and the upgrade is expected to be completed in late 2023
* Includes production and costs from February 8, 2022 to March 31, 2022
See AEM February 23, 2022 press release and appendix for detailed breakdown of mineral reserves and mineral resources BofA 2022 Global Metals, Mining and Steel Conference 26Nunavut
Production Q1 2022 Production and Highlights
Costs
Meliadine
80,704 ozs • In Q1 2022, the COVID-19 pandemic resulted in lower than planned workforce levels which primarily affected the underground mine. The processing plant
operated as per planned, achieving a run rate of ~4,800 tpd
at a production cost of $975/oz • The permit for the construction of the discharge waterline was received on January 31, 2022. The construction activities are expected to start later in 2022 and to
and total cash costs of be completed in time to start discharging in 2024
$1,002/oz
• The Phase 2 mill expansion to 6,000 tpd is expected to be completed in mid-2024
Proven & probable gold • In Q1 2022, the Tiriganiaq exploration drift was advanced by ~109m and a second drilling bay was completed. Initial drilling from the first drill bay is underway and
reserves: 3.7Moz assay results are expected in Q2 2022. Infill and exploration drilling at the Tiriganiaq deposit returned significant results. Highlights include 6.8 g/t gold over 6.1m
at 81m depth and 33.2 g/t gold over 2.7m at 117m depth, demonstrating potential for near surface mineral resources; and 15.7 g/t gold over 6.6m at 508m depth
* Includes pre-commercial production of 24,057 ozs at the Tiriganiaq pit in a new ore shoot discovered during Q4 2021 that remains open at depth
Meadowbank Complex
59,765 ozs • The Meadowbank Complex successfully overcame significant challenges related to COVID-19. At the start of the year, site activities were reduced to essential
services. The operation ramp-up began on January 10, 2022
at a production cost of • The mill operated above forecast. In March 2022, the Meadowbank Complex achieved a record monthly throughput of approximately 377,000t milled, averaging
$1,618/oz and total cash costs 12,161 tpd, including an all-time daily record of 14,206 tpd
of $1,811/oz
• The High Pressure Grinding Rolls expected to be commissioned in Q2 2022
Proven & probable gold • With the open pit entering a higher-grade mining sequence and the ore contribution from underground starting in H2 2022, gold production is expected to increase
reserves: 2.6Moz consistently over the next three quarters of 2022
• In Q1 2022, the lower workforce availability related to COVID-19 resulted in delays in the underground development and the construction of the underground mine
** Includes pre-commercial production of 1,956 ozs at the Amaruq Underground project
infrastructure. Despite these challenges, the underground project remains on budget and on schedule. The extraction of a test stope is planned for Q2 2022 and
commercial production is expected to be achieved in H2 2022
See AEM February 23, 2022 press release and appendix for detailed breakdown of mineral reserves and mineral resources BofA 2022 Global Metals, Mining and Steel Conference 27Australia & Finland
Production Q1 2022 Production and Highlights
Costs
Fosterville (Australia)
81,827 ozs* • The Meadowbank Complex successfully overcame significant challenges related to COVID-19. At the start of the year, site activities were reduced to essential
services. The operation ramp-up began on January 10, 2022
at a production cost of • The mill operated above forecast. In March 2022, the Meadowbank Complex achieved a record monthly throughput of approximately 377,000t milled, averaging
$1,075/oz* and total cash costs 12,161 tpd, including an all-time daily record of 14,206 tpd
of $309/oz*
• The High Pressure Grinding Rolls expected to be commissioned in Q2 2022
Proven & probable gold • With the open pit entering a higher-grade mining sequence and the ore contribution from underground starting in H2 2022, gold production is expected to increase
reserves: 2.0Moz consistently over the next three quarters of 2022
• In Q1 2022, the lower workforce availability related to COVID-19 resulted in delays in the underground development and the construction of the underground mine
infrastructure
• Despite these challenges, the underground project remains on budget and on schedule. The extraction of a test stope is planned for Q2 2022 and commercial
production is expected to be achieved in H2 2022
Kittila (Finland)
45,508 ozs • Gold production in Q1 2022 was below forecast due to lower grades, lower throughput and lower recoveries. The Company expects production levels to normalize
over the remainder of the year
at a production cost of • Mill tonnes were slightly below forecast mainly due to lower-than-expected autoclave availability during the restart of the mill after the planned shutdown in
$1,087/oz and total cash costs February 2022. Availability returned to more normal levels in March and the mill achieved an all-time monthly record of 191k tonnes processed
of $1,039/oz
• Despite challenges from COVID-19, shaft construction continues to progress as planned. Work on the 875-level shaft station will continue until the end of May and
Proven & probable gold shaft sinking is expected to be completed in Q3 2022. Commissioning of the production hoist remains on schedule for Q4 2022
reserves: 3.8Moz • As part of the expansion project at the mine, the construction of a nitrogen removal plant is expected to be commissioned in H2 2022
• Drilling confirmed the potential to extend gold mineralization at depth, with highlight hole returning 6.3 g/t gold over 13.6m at 1,948m depth and 5.7 g/t gold over
3.7m at 1,973m depth in the Sizar Zone
* Includes production and costs from February 8, 2022 to March 31, 2022
See AEM February 23, 2022 press release and appendix for detailed breakdown of mineral reserves and mineral resources BofA 2022 Global Metals, Mining and Steel Conference 28Mexico
Production Q1 2022 Production and Highlights
Costs
Pinos Altos
25,170 ozs • At Santo Niño and Cerro Colorado, significantly more rehabilitation work than expected resulted in lower than planned underground development and stope
preparation. These delays affected overall underground production and resulted in low ore availability at the mill and lower than forecast gold production
at a production cost of • At Reyna de Plata, open pit pre-stripping activities at Pit 1 progressed as per plan and are ~25% complete. The lower section of Pit 2 provided initial ore production
$1,293/oz and total cash costs of ~47k tonnes
of $1,078/oz • At Cubiro, the main underground pumping system was commissioned in Q1 2022. Underground development advanced by 874m and included the excavation of
Proven & probable gold ~8k tonnes of ore at a higher than expected gold grade of 4.37 g/t
reserves: 0.8Moz • Pre-production activities will continue through 2022 into 2023. Initial production is expected in H2 2023. Once production commences, Cubiro is expected to
provide additional production flexibility to the Pinos Altos operations
La India
21,702 ozs • Despite COVID-19 challenges, the La India mine delivered strong operational performance with higher tonnage placed on the heap leach than forecast
• The water storage facilities at the end of Q1 2022 were at ~50% of their maximum capacities. At these water levels, La India is expected to be able to operate until
at a production cost of $817/oz the start of the next rainy season which is expected in June 2022
and total cash costs of $820/oz • The Main Zone pit is expected to be depleted in Q3 2022. Ore production will then fully transition to the La India pit and the El Realito pit
• Pre-stripping of the El Realito pit is ~39% complete and the first gold production was started in Q1 of 2022. Pre-stripping activities are in line with forecast and are
Proven & probable gold
expected to be completed in Q3 2022
reserves: 0.2Moz
See AEM February 23, 2022 press release and appendix for detailed breakdown of mineral reserves and mineral resources BofA 2022 Global Metals, Mining and Steel Conference 29Mineral Reserves and Mineral Resources
2021 GOLD MINERAL RESERVES AND MINERAL RESOURCES
Gold Mineral Reserves Increased to a Record Level on a Combined Basis

                           Consistent Growth in Mineral Reserves & Mineral Resources                                                                               45 Moz Gold Reserves1
                                        Reserves                     M&I Resources                        Inferred Resources                                                       Mexico,
                     120                                                                                                                                               Finland,
                                                                                                                                                                         8%         2%

                                                                                                                                                          Australia,
                     100                                                                                                               31                   5%
                                                                                                                                30
                      80
        Gold (Moz)

                                                                                                                24       27            40
                      60                                                            21            23
                                                                                                                                28

                                                        15            18
                      40     14          12                                                       25            25       25
                                                                                    25
                                                        17            17
                             11          13
                      20                                                                                                        44     45                                                                      Canada,
                                                                                                                28       27                                                                                     85%
                             21                         21            21            23            25
                                         19
                      –
                            2012        2013          2014          2015          2016          2017          2018      2019   2020   2021
  Note: Based on published gold reserves and resources reported as of December 31 of each respective year by Agnico Eagle and Kirkland Lake Gold   Note: 1. Combined Agnico Eagle and Kirkland Lake Gold as at December 31, 2021.

➢ Strong combined mineral reserve base totaling 44.6 Moz of gold
➢ Focused on growing mineral reserves and mineral resources through consistent investment in exploration
➢ New technical evaluation at Detour Lake in 2022 is expected to show further growth in mineral reserves
➢ Significant exploration program in 2022 driven by strong results, in safe jurisdictions, leveraging off existing infrastructure

See AEM February 23, 2022 press release and appendix for detailed breakdown of mineral reserves and mineral resources                                                             BofA 2022 Global Metals, Mining and Steel Conference   31
2021 GOLD MINERAL RESERVES AND MINERAL RESOURCES
Gold Mineral Reserves Increase to Record Level
AGNICO EAGLE
As of December 31, 2020 As of December 31, 2021
Category Tonnes Grade Contained Gold Tonnes Grade Contained Gold
(000s) (g/t Au) (000 oz) (000s) (g/t Au) (000 oz)
Mineral Reserves
Proven 44,098 1.99 2,821 38,700 1.92 2,385
Probable 303,675 2.18 21,261 298,250 2.43 23,339
Total Proven & Probable 347,773 2.15 24,082 336,950 2.37 25,724
Mineral Resources
Measured 74,182 0.93 2,216 69,049 0.92 2,040
Indicated 267,264 1.53 13,130 284,426 1.66 15,213
Total Measured & Indicated 341,446 1.40 15,346 353,475 1.52 17,253
Total Inferred 282,965 2.57 23,351 271,664 2.71 23,709
DETOUR, MACASSA, FOSTERVILLE
As of December 31, 2020 As of December 31, 2021
Category Tonnes Grade Contained Gold Tonnes Grade Contained Gold
(000s) (g/t Au) (000 oz) (000s) (g/t Au) (000 oz)
Mineral Reserves
Proven 85,029 1.50 4,087 81,726 1.41 3,713
Probable 519,598 0.96 16,031 501,789 0.94 15,196
Total Proven & Probable 604,627 1.03 20,118 583,515 1.01 18,909
Mineral Resources
Measured 29,206 2.55 2,395 34,059 2.33 2,551
Indicated 177,942 1.77 10,110 613,204 1.01 19,872
Total Measured & Indicated 207,148 1.88 12,505 647,263 1.08 22,423
Total Inferred 92,872 2.32 6,930 93,754 2.28 6,882
See AEM February 23, 2022 press release and appendix for detailed breakdown of mineral reserves and mineral resources BofA 2022 Global Metals, Mining and Steel Conference 32MINERAL RESERVES AS AT DECEMBER 31, 2021 FOR PROPERTIES HELD BY
AGNICO EAGLE PRIOR TO THE MERGER
Mineral reserves are not a subset of mineral resources. Tonnage amounts and contained metal amounts presented in this table have been rounded to the nearest thousand, so aggregate amounts may differ from column totals.
BofA 2022 Global Metals, Mining and Steel Conference 33MINERAL RESOURCES AS AT DECEMBER 31, 2021 FOR PROPERTIES HELD BY
AGNICO EAGLE PRIOR TO THE MERGER
Mineral reserves are not a subset of mineral resources. Tonnage amounts and contained metal amounts presented in this table have been rounded to the nearest thousand, so aggregate amounts may differ from column totals.
BofA 2022 Global Metals, Mining and Steel Conference 34MINERAL RESOURCES AS AT DECEMBER 31, 2021 FOR PROPERTIES HELD BY
AGNICO EAGLE PRIOR TO THE MERGER
Mineral reserves are not a subset of mineral resources. Tonnage amounts and contained metal amounts presented in this table have been rounded to the nearest thousand, so aggregate amounts may differ from column totals.
BofA 2022 Global Metals, Mining and Steel Conference 35MINERAL RESERVES AS AT DECEMBER 31, 2021 FOR PROPERTIES HELD BY
KIRKLAND LAKE GOLD PRIOR TO THE MERGER
Mineral reserves are not a subset of mineral resources. Tonnage amounts and contained metal amounts presented in this table have been rounded to the nearest thousand, so aggregate amounts may differ from column totals.
BofA 2022 Global Metals, Mining and Steel Conference 36MINERAL RESOURCES AS AT DECEMBER 31, 2021 FOR PROPERTIES HELD BY
KIRKLAND LAKE GOLD PRIOR TO THE MERGER
Mineral reserves are not a subset of mineral resources. Tonnage amounts and contained metal amounts presented in this table have been rounded to the nearest thousand, so aggregate amounts may differ from column totals.
BofA 2022 Global Metals, Mining and Steel Conference 37NOTES TO INVESTORS REGARDING THE USE OF MINERAL RESOURCES
NI 43-101 requires mining companies to disclose mineral reserves and mineral resources using the subcategories of "proven mineral reserves", "probable mineral reserves", "measured mineral resources", "indicated mineral resources" and "inferred
mineral resources". Mineral resources that are not mineral reserves do not have demonstrated economic viability.
A mineral reserve is the economically mineable part of a measured and/or indicated mineral resource. It includes diluting materials and allowances for losses, which may occur when the material is mined or extracted and is defined by studies at pre-
feasibility or feasibility level as appropriate that include application of modifying factors. Such studies demonstrate that, at the time of reporting, extraction could reasonably be justified. The mineral reserves presented in this news release are
separate from and not a portion of the mineral resources.
Modifying factors are considerations used to convert mineral resources to mineral reserves. These include, but are not restricted to, mining, processing, metallurgical, infrastructure, economic, marketing, legal, environmental, social and governmental
factors.
A proven mineral reserve is the economically mineable part of a measured mineral resource. A proven mineral reserve implies a high degree of confidence in the modifying factors. A probable mineral reserve is the economically mineable part of an
indicated and, in some circumstances, a measured mineral resource. The confidence in the modifying factors applying to a probable mineral reserve is lower than that applying to a proven mineral reserve.
A mineral resource is a concentration or occurrence of solid material of economic interest in or on the Earth's crust in such form, grade or quality and quantity that there are reasonable prospects for eventual economic extraction. The location,
quantity, grade or quality, continuity and other geological characteristics of a mineral resource are known, estimated or interpreted from specific geological evidence and knowledge, including sampling.
A measured mineral resource is that part of a mineral resource for which quantity, grade or quality, densities, shape and physical characteristics are estimated with confidence sufficient to allow the application of modifying factors to support detailed
mine planning and final evaluation of the economic viability of the deposit. Geological evidence is derived from detailed and reliable exploration, sampling and testing and is sufficient to confirm geological and grade or quality continuity between
points of observation. An indicated mineral resource is that part of a mineral resource for which quantity, grade or quality, densities, shape and physical characteristics are estimated with sufficient confidence to allow the application of modifying
factors in sufficient detail to support mine planning and evaluation of the economic viability of the deposit. Geological evidence is derived from adequately detailed and reliable exploration, sampling and testing and is sufficient to assume geological
and grade or quality continuity between points of observation. An inferred mineral resource is that part of a mineral resource for which quantity and grade or quality are estimated on the basis of limited geological evidence and sampling. Geological
evidence is sufficient to imply but not verify geological and grade or quality continuity.
Investors are cautioned not to assume that part or all of an inferred mineral resource exists, or is economically or legally mineable.
A feasibility study is a comprehensive technical and economic study of the selected development option for a mineral project that includes appropriately detailed assessments of applicable modifying factors, together with any other relevant operational
factors and detailed financial analysis that are necessary to demonstrate, at the time of reporting, that extraction is reasonably justified (economically mineable). The results of the study may reasonably serve as the basis for a final decision by a
proponent or financial institution to proceed with, or finance, the development of the project. The confidence level of the study will be higher than that of a pre-feasibility study.
The effective date for all of the Company's mineral resource and mineral reserve estimates in this presentation is December 31, 2020. Additional information about each of the mineral projects that is required by NI 43-101, sections 3.2 and 3.3 and
paragraphs 3.4(a), (c) and (d), as well as other information, can be found in Technical Reports, which may be found at www.sedar.com. Other important operating information can be found in the Company's AIF, MD&A and Form 40-F.
Scientific and Technical Data
The scientific and technical information contained in this presentation relating to Quebec operations has been approved by Daniel Paré, P.Eng., Vice-President Operations – Eastern Canada; relating to Nunavut operations has been approved by
Dominique Girard, Eng., Senior Vice-President, Operations – Canada and Europe; relating to Finland operations has been approved by Francis Brunet, Eng., Corporate Director, Business Strategy; relating to Southern Business operations has been
approved by Marc Legault, Eng., Senior Vice-President, Operations – U.S.A. & Latin America; relating to exploration at legacy Agnico Eagle assets has been approved by Guy Gosselin, Eng. and P.Geo., Senior Vice-President, Exploration, each of
whom is a "Qualified Person" for the purposes of NI 43-101.
The scientific and technical information relating to Agnico Eagle's mineral reserves and mineral resources contained in this presentation (other than the Canadian Malartic mine) has been approved by Dyane Duquette, P.Geo., Corporate Director,
Reserves Development of the Company; relating to mineral reserves and mineral resources at the Canadian Malartic mine and other Partnership projects such as the Odyssey project, has been approved by Sylvie Lampron, Eng., Senior Project Mine
Engineer at Canadian Malartic Corporation (for engineering) and Pascal Lehouiller, P.Geo., Senior Resource Geologist at Canadian Malartic Corporation (for geology), each of whom is a "Qualified Person" for the purposes of NI 43-101.
The technical contents related to Kirkland Lake Gold mines and properties in this presentation have been reviewed and approved by Andre Leite, P.Eng, AUSIMM CP (MIN), MEng., Vice-President, Technical Services, and Eric Kallio, P.Geo, Senior
Vice-President, Exploration. Mr. Leite and Mr. Kallio are “qualified persons” as defined in National Instrument 43-101 and have reviewed and approved disclosure of the technical information and data in this news release.
BofA 2022 Global Metals, Mining and Steel Conference 38You can also read