NZX INTERIM 2021 RESULTS INVESTOR PRESENTATION - 26 August 2021

Page created by Tammy Burgess
 
CONTINUE READING
NZX INTERIM 2021 RESULTS INVESTOR PRESENTATION - 26 August 2021
NZX INTERIM 2021 RESULTS
INVESTOR PRESENTATION
26 August 2021

                           1
NZX INTERIM 2021 RESULTS INVESTOR PRESENTATION - 26 August 2021
Today’s Agenda

                                                              Important notice

                                                              This half year investor presentation should be read in
             Half Year 2021 Highlights                   3    conjunction with the financial statements in the 2021 Interim
                                                              Report, which provides additional information on many areas
             Business Unit Highlights                    5    covered in this presentation.

             Financial Performance                       14   This presentation contains forward looking information, statements
                                                              and targets. These reflect our current assumptions, which are
             Financial Position & Cash Flows             21   subject to market outcomes, particularly with respect to market
                                                              capitalisation, total capital raised, secondary market value and
             Interim Dividend & 2021 Earnings Guidance   25   derivatives volumes traded, funds under management and
                                                              administration growth and technology costs.
             NZX’s Strategy                              27   Additionally, NZX notes the global health environment remains
                                                              volatile and assumes no material adverse events, significant one-
Appendices                                                    off expenses, major accounting adjustments, other unforeseeable
                                                              circumstances, or future acquisitions or divestments.

                                                                                                                                   NZX Half Year 2021 Results
    1        Segmental Analysis                          35   Actual outcomes could be materially different. We give no
                                                              warranty or representation as to our future performance (financial
    2        Operating Revenue Definitions               44   or otherwise) or any future matter. Except as required by law or
                                                              NZX listing rules, we are not obliged to update this presentation
                                                              after its release.

                                                                                                                                   2
NZX INTERIM 2021 RESULTS INVESTOR PRESENTATION - 26 August 2021
Half Year 2021
Highlights

                 3
NZX INTERIM 2021 RESULTS INVESTOR PRESENTATION - 26 August 2021
Half Year 2021 results at a glance
     H1-2021 has successfully carried the step change in our markets, with a structurally higher level of market activity (after the
     extraordinary peaks seen over the H1-2020 period), particularly for capital raised and value traded

                         Operating Earnings*                                                                                Net Profit After Tax                                                                                 Interim Dividend

                                   $16.9                                                                                               $7.6                                                                                           (fully imputed)

                                      million                                                                                           million                                                                                             3.0
                                                                                                                                                                                                                                     cents per share

                                  (3.5)%                                                                                          (16.0)%
      Capital raised                                    Data & Insights                             Total Value Traded                                Dairy Derivatives                                   Funds Under                                   Funds Under
(total new capital and secondary                           Revenue                                                                                      Lots traded                                       Management                                   Administration
         capital raised)

                                                                                                              $27.1                                         139,950                                             $5.69                                         $7.73

                                                                                                                                                                                                                                                                                   NZX Half Year 2021 Results
            $7.3                                                $8.6
             billion                                             million                                         billion                                                                                          billion                                        billion

   H1-20           5 Yr Average                                 5.1%                                H1-20
                                                                                                    (2.8)%
                                                                                                                       5 Yr Average
                                                                                                                          22.1%
                                                                                                                                                            (31.9)%                                            44.3%                                        151.1%
  (10.6)%             16.5%
       * Operating earnings are before net finance expense, income tax, depreciation, amortisation, loss on disposal of assets, and gain on lease modification. Operating earnings is not a defined performance measure in NZ IFRS. The Group's definition of operating earnings
       may not be comparable with similarly titled performance measures and disclosures by other entities.

       The 2021 deliverable targets are detailed in the management commentary section of the 2021 Interim Report.

       Data is “for the 6 month period ended 30 June 2021,” or “as at 30 June 2021” (as applicable). Percentage changes represent the movement for the interim period June 2020 to June 2021, except Funds Under Management and Funds Under Administration which are the
       movement in balances as at 30 June 2020 to 30 June 2021. 5 year average percentage changes represent the movement against the rolling average for the preceding 5 year interim periods.
                                                                                                                                                                                                                                                                                   4
NZX INTERIM 2021 RESULTS INVESTOR PRESENTATION - 26 August 2021
Business Unit Highlights

                           5
NZX INTERIM 2021 RESULTS INVESTOR PRESENTATION - 26 August 2021
Issuer Relationships – Capital Raised
Another strong performance for the 6 months, with the capital raised mix adjusting to suit a more settled economic
environment over the period

                                                                         Capital Raised ($'b)
    25
                                                                                                                                                               Macro drivers of capital raised:
                                                                                                                                                               •   Primary listing fees driven by equity and retail debt listings
    20
                                                                                                                                                               •   Secondary issuance fees reflect a lower level of equity recapitalisations and
    15                                                                                                                                                             retail debt issuances compared to the H1-20 COVID period

    10

                                                                                                                                                               Listings during H1-21 were:
    5
                                                                                                                                                               •   IPO - My Food Bag Limited (MFB),
    -                                                                                                                                                          •   Direct Listings – Third Age Health Services Limited (TAH) and NZ
                2012       2013          2014        2015         2016            2017      2018          2019         2020       2021        2022      2023
                                                                                                                                                                   Automotive Investments Limited (NZA)
                          H1 - Capital Raised               H2 - Capital Raised              Low Target                         High Target
                          Low track                         High Track                       5 Year Rolling Average (HY)
                                                                                                                                                               •   Foreign Exempt Listing – DGL Corporation (DGC)
Capital raised (new and secondary capital raisings)                                                                           $7.3 billion                     •   Green Bonds – Mercury NZ $200 million (supporting NZ’s transition to a
•        Relative to 5 year rolling average for H1                                                                            +16.5%                               low emissions future), and PPNZ $150 million (to finance or refinance

                                                                                                                                                                                                                                                   NZX Half Year 2021 Results
                                                                                                                                                                   energy efficient buildings)
•        Relative to H1-20 COVID period                                                                                       (10.6)%
                                                                                                                                                               •   Other sustainable and ethical investment capital raised included Housing
                                                            Capital Raised H1-21 v H1-20
        4,000                                                                                                                                                      New Zealand (Kāinga Ora) issuing further 2028 Wellbeing bonds ($600m)
                         Primary Capital Raised                                                                  Secondary Capital Raised
                                                                                                                                                                   supporting the development of good quality, affordable housing
        3,000

                                                                                                                                                               •   Increasing level of ETF capital raised
        2,000

        1,000
                                                                                  H1-2020                                                                      Team operating a true origination model – with active pipeline development
                                                                                  H1-2021
           -                                                                                                                                                   and conversion
                       Equity          Retail Debt   Wholesale Debt                            Equity             Retail Debt   Wholesale Debt       Funds

                                                                                                                                                                                                                                                   6
NZX INTERIM 2021 RESULTS INVESTOR PRESENTATION - 26 August 2021
Secondary Markets – Value Traded / Cleared
Value traded levels holding close to the record levels of last year

                                                           Value Traded / Cleared ($'b)
    60
                                                                                                                                                        Macro drivers
    50                                                                                                                                                  •   Continued elevated levels of on-market liquidity (63.8%) and value traded
                                                                                                                                                            / cleared ($27.1 billion). This is as a result of the removal of barriers in
    40
                                                                                                                                                            prior years and a move towards global standards resulting in a rising tide of
    30
                                                                                                                                                            liquidity across all participants and market segments.
                                                                                                                                                        •   Market Trends show that across H1-21 24.8% of all value is being executed
    20
                                                                                                                                                            through the exchange’s closing auction and represents the largest liquidity
    10                                                                                                                                                      event on each trading day. Additionally, the five index rebalance days in
                                                                                                                                                            H1-21 have accounted for 12.7% of all value traded.
    -
           2008   2009      2010     2011      2012    2013        2014   2015    2016     2017      2018      2019    2020     2021      2022   2023   •   Continued growth in the NZX Depository business (depository OTC
                      H1 - Value Traded               H2 - Value Traded              Low Target                       High Target
                                                                                                                                                            transactions +4.9% and assets under custody +44.3%), to increase
                      Low track                       High Track                     5 Year Rolling Average (HY)
                                                                                                                                                            efficiencies of NZ market and participate in the last leg of securities
Traded Value                                                                                                       $27.1 billion                            settlement value chain
•        Relative to 5 year rolling average for H1                                                                 +22.1%                               Market Development

                                                                                                                                                                                                                                            NZX Half Year 2021 Results
•        Relative to H1-20 COVID period                                                                            (2.8)%                               •   Trading System Upgrade went live in early August 2021; ensuring NZX
                                          Value Traded/Cleared by Market Segment                                                                            Trading architecture is fit for purpose and delivers the ability to provide
20,000,000,000
                                                                                                                                                            further increased functionality and trading options for participants (e.g.
                                                                                                                                                            NZX DARK – the midpoint order book)
                                                                                                                                          H1 2021
15,000,000,000
                                                                                                                                          H1 2020       •   BNP Paribas is expected to become a General Clearing Participant in late
10,000,000,000                                                                                                                                              2021. This has the potential to unlock remote broker Participation and
                                                                                                                                                            greater access to the exchange’s Secondary Markets.
    5,000,000,000
                                                                                                                                                        •   Continued development of NZX CSD to support a fully automated and
                  0
                                          Retail                                 Wholesale                                          ETF                     efficient post trade environment.
                                                                                                                                                                                                                                            7
NZX INTERIM 2021 RESULTS INVESTOR PRESENTATION - 26 August 2021
Data & Insights revenue
Solid continuation of business growth driven by professional terminal numbers lifting, offset partly by retail terminals
settling back after the extremes of 2020

      16.00
                                                     Data & Insights Revenue ($'m)                                                Macro drivers
      14.00                                                                                                                       •   Recurring revenue (i.e. excluding audit and back dated licenses revenue)
      12.00                                                                                                                           growth in H1-21 was 8.7%.
      10.00
                                                                                                                                          •   Royalty revenue growth of 8.3% is a mix of professional terminals
       8.00                                                                                                                                   (higher value - increased 6.2%) and retail terminals (lower value -
       6.00                                                                                                                                   decreased 26.5% from post H1-20 COVID lock down peak)
       4.00
                                                                                                                                          •   Subscription and licences revenue growth of 12.1% reflects
       2.00
                                                                                                                                              continued growth in non-display applications and ability to capture
         -
                 2016          2017                2018         2019       2020         2021               2022            2023
                                                                                                                                              licence revenue streams post audit
                 H1 Revenue           H2 Revenue           Low Target     High Target          Low track          High Track
                                                                                                                                          •   Connectivity revenue reflects changing client connectivity
                                                                                                                                              requirements to a higher standard of performance and resilience
    * Data & Insights Revenue in graph excluding connectivity revenue to ensure comparability with 2018 strategic targets
                                                                                                                                  •   Audit activity continues to be high although lower than H1-20, driving one
                                                                                                                                      off audit and back dated licencing revenue
Data & Insights Revenue                                                                          $8.6 million

                                                                                                                                                                                                                     NZX Half Year 2021 Results
•     Relative to H1-20                                                                          +5.1%
                                                                                                                                  Future revenue growth driven by:
Split by revenue type:                                                                                                            •   Focus on product offering for market data and connectivity
•     Royalties, Subscriptions, Licenses and Indices                                             +8.9%                            •   Developing value added services for issuers (e.g. collection of ESG metrics)
•     Audits and back dated licenses                                                             (26.9)%                          •   Supporting S&P indices revenue growth (e.g. Carbon Efficiency Indices
•     Connectivity                                                                               +7.5%                                launched, in conjunction with S&P, in May)

                                                                                                                                                                                                                     8
NZX INTERIM 2021 RESULTS INVESTOR PRESENTATION - 26 August 2021
Dairy Derivatives
Soft result driven by low volatility in physical prices, the strategic change to the SGX dairy partnership is a global
opportunity

                                                           Dairy Derivative Lots (#)                                                                Macro drivers
    1,600,000

    1,400,000
                                                                                                                                                    •   Total lots traded decreased 31.9%.
    1,200,000                                                                                                                                               •   NZ Milk Price Derivative volumes grew by 17% assisted by rising
    1,000,000                                                                                                                                                   prices and local development activities drawing increased farmer
     800,000                                                                                                                                                    participation.
     600,000
                                                                                                                                                            •   Global Dairy Ingredients volumes decreased by 35% impacted by
     400,000
                                                                                                                                                                lower volatility on GDT for the majority of the first half, and with
     200,000
                                                                                                                                                                COVID travel restrictions continuing to inhibit global marketing and
           -
                2010   2011      2012   2013        2014      2015        2016   2017          2018   2019        2020   2021         2022   2023
                                                                                                                                                                event activity.
                         H1 - Lots      H2 - Lots            Low Target          High Target          Low track          High Track

                                                                                                                                                    Singapore Exchange (SGX) strategic partnership:
Dairy Derivatives Lots traded                                                                                139,950                                •   to grow NZX’s dairy derivatives market is planned to go live in late H2-21
•      Relative to H1-20                                                                                     (31.9)%                                    (subject to regulatory approvals)

                                                                                                                                                                                                                                       NZX Half Year 2021 Results
                                                                                                                                                    •   aims to extend market distribution and expand global access by:
Notional Value traded (USD)                                                                                  $886 million                                   •   Increasing the number of trading and clearing members from four
•      Relative to H1-20                                                                                     +8.3%                                              to a possible 86+; enabling proprietary and speculative firms to
                                                                                                                                                                more easily connect
                                                                                                                                                            •   Increasing the number of independent software providers from two
                                                                                                                                                                to 25
                                                                                                                                                            •   Providing a more global platform and presence in the dominant
                                                                                                                                                                region for dairy imports (Asia)
                                                                                                                                                                                                                                       9
NZX INTERIM 2021 RESULTS INVESTOR PRESENTATION - 26 August 2021
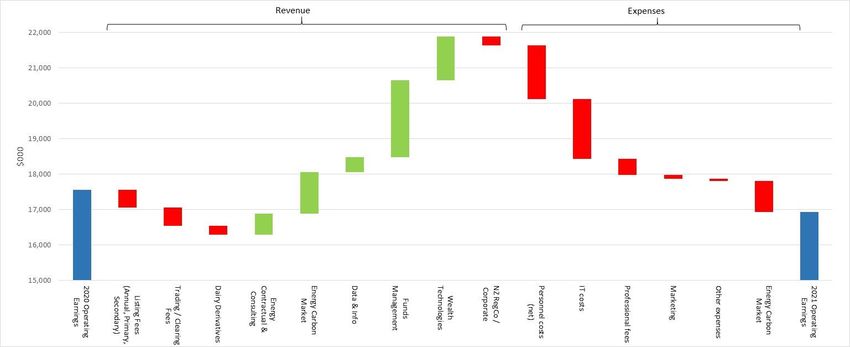
Smartshares – Funds Under Management (FUM)
Continues to drive growth; we look to further scale this business through both organic and inorganic growth opportunities

                                                      Funds Under Management ($'million)                                                                               Macro drivers of the ETF market trajectory:
    6,000

                                                                                                                                                                       •    ETF penetration rate is low compared to US/Europe
    5,000

                                                                                                                                                                       •    KiwiSaver future growth profile
    4,000

    3,000

                                                                                                                                                                       FUM growth target 14% p.a. is being over achieved:
    2,000
                                                                                                                                                                       •   Net FUM inflow H1-21: $383m is approx. 7.5% of opening FUM
    1,000
                                                                                                                                                                       •   Market return H1-21: $231m is approx. 4.5% of opening FUM
       0
        Dec-14         Dec-15           Dec-16          Dec-17               Dec-18         Dec-19        Dec-20           Dec-21          Dec-22             Dec-23   •   Growth activities include being appointed a KiwiSaver Default provider
                 2023 Strategy Low Target        2023 Strategy High Target            TOTAL FUM      2023 Strategy Low Track        2023 Strategy HighTrack
                                                                                                                                                                           effective from December 2021

Funds Under Management                                                                                               $5.69 billion                                     Strategic step change
•      Relative to H1-20                                                                                             +44.3%
                                                                                                                                                                       We continue to mature the operations (particularly in the IT environment), as

                                                                                                                                                                                                                                                       NZX Half Year 2021 Results
                                                                                                                                                                       well as investing for growth including:
Cash Flows                                                                                                           $383 million                                      •   KiwiSaver Default provider - Smartshares selected as a default provider
•      Relative to H1-20                                                                                             +79.8%                                                effective from December
                                                                                                                                                                       •   Transitional Financial Advice Provider licence obtained in March
                                                                                                                                                                       •   Bloomberg implemented for ETF Basket Creation/Redemption (BSKT) and
                                                                                                                                                                           order management (AIM) i.e. front and middle office
                                                                                                                                                                       •   exploring potential acquisition opportunities

                                                                                                                                                                                                                                                       10
Wealth Technologies – Funds Under Admin (FUA)
Client transitions have driven the growth, and there is a positive outlook for this to continue

                                             Funds Under Administration (FUA $'b)                                                            Macro drivers
    50

    45                                                                                                                                       •   As increased compliance obligations force large advisor firms to upgrade
    40                                                                                                                                           their internal platforms the Wealth Technologies SaaS offering becomes
    35
                                                                                                                                                 attractive
    30

    25                                                                                                                                       •   The increasing cost to service clients also impacts medium adviser firms
    20                                                                                                                                           making the Wealth Technologies option cost efficient, allowing scalable
    15                                                                                                                                           growth and reducing operational and compliance risks.
    10

    5
                                                                                                                                             Platform and Operations:
    -
          2014           2015       2016           2017          2018          2019      2020           2021      2022           2023
                                                                                                                                             •   We now have a scalable platform with a highly skilled operational team
         2023 Strategy Low Target    2024 Strategy High Target      FUA (Closing $'b)   2025 Strategy Low Track   2025 Strategy High Track
                                                                                                                                             •   Historic clients will start transitioning off the legacy platform on to the new
                                                                                                                                                 platform in Q3-21
Funds Under Administration                                                                          $7.73 billion                            •   Enhanced structure and increased resourcing to enable strong operational
•   Relative to H1-20                                                                               +151.1%                                      excellence while continuing aggressive growth trajectory

                                                                                                                                                                                                                                   NZX Half Year 2021 Results
                                                                                                                                             •   NZX WT now operating earnings positive in H1-21
                                                                                                                                             Clients:
                                                                                                                                             •   4 clients on the new platform (and 7 on the legacy platform)
                                                                                                                                             •   3 new client contracts signed in H1-21; of which 2 have on-boarding
                                                                                                                                                 projects underway and hence we expect FUA to increase to around $10
                                                                                                                                                 billion at year end
                                                                                                                                             •   Strong pipeline for 2022 – the 2023 aspirational targets remain valid

                                                                                                                                                                                                                                   11
Regulation (NZ RegCo)
Regulatory operating and governance model aligns to global best practice, with structural separation of regulatory activities
from NZX’s commercial activities

                                                                   NZX Regulation Limited (NZ RegCo)
                                                                   •   NZ RegCo is structurally separate from NZX's commercial and operational
                                                                       activities
                                                                   •   Governed by a separate board with:
                                                                         •    an independent Chair - Trevor Janes; and
                                                                         •    the majority of members independent of the NZX Group:
                                                                                 •    Elaine Campbell (NZX Director)
      NZX Shareholders                  Regulators
                                                                                 •    Annabel Cotton (Independent)

             NZX Board                     NZ RegCo Board                        •    John Hawkins (Independent); and
                                                                                 •    Michael Heron QC (Independent)
              NZX CEO                      NZ RegCo CEO                  •    The establishment board has now been made permanent
                                                                   •   NZ RegCo CEO is Joost van Amelsfort

                                                                                                                                                 NZX Half Year 2021 Results
           NZX employees                 NZ RegCo employees
                                                                   •   Targeting to operate on a cost-neutral basis

                                                                                                                                                 12
People
Our people continue to show enormous commitment, resilience and flexibility as they deliver further growth across the Group.
Every area of our business is pushing forward to grow the capacity and capability to deliver these strategic priorities.

 Building Capacity                                        Building Capability                                      Culture & Engagement
 •   To support business growth across the group          •   Our two-year programme to drive sales                •   Implementation of our Future of Flexible Work
     and market stability, our workforce grew from            capability and consistent processes across the           hybrid model is underway, to leverage the
     257 at December 2020 to 267 at June 2021 full-           Group is delivering results                              benefits for employees, customers, and
     time equivalent employees, with further new                                                                       company performance
     roles to come on in H2                               •   Organisational capability in IT functions has
                                                              been a particular focus, in areas of automation,     •   Employee engagement has dipped slightly in the
 •   Capacity was bolstered in technology, sales, risk        testing, IT performance monitoring and                   first half after our highest engagement result
     management, project management, cyber                    reporting, and cyber security                            ever last year. Our ambition remains to be top
     security and corporate services                                                                                   quartile globally
                                                          •   Launched an internal financial capability
 •   NZX Wealth Technologies reshaped their                   programme for employees in partnership with          Health & Safety
     structure to add capacity in client facing,              the Commission for Financial Capability, as part
     onboarding and technical teams to serve new              of our employee benefits suite                       •   Wellbeing and morale continues to be a focus
     clients                                                                                                           for management effort, to keep our workforce
                                                          Diversity & Inclusion                                        connected, supported and informed

                                                                                                                                                                          NZX Half Year 2021 Results
 •   Strong competition for talent is being
     experienced given the labour market constraints      •   We are committed to developing female leaders        •   Active management of pandemic risks
     (particularly for IT and legal resources), however       internally                                               continues to ensure full resourcing and health
     our strong brand is ensuring we continue to                                                                       of our workforce to date
     attract good talent. Employee retention is under     •   Among other Diversity and Inclusion initiatives
     pressure, with turnover of 9% in H1-21. Overall          includes three of NZX’s leaders taking part in the   •   Excellent safety record, with Total Recordable
     we are experiencing wage pressure                        Global Women Activate Leaders Programme                  Injury Rate (TRIR) of 0.85 incidents per 200,000
                                                                                                                       hours worked

                                                                                                                                                                          13
Financial Performance

                        14
Income Statement
                                              June 2021     June 2020       Change
                                                   $000          $000    Fav/(unfav)
Operating revenue                                42,451        38,372         10.6%
Operating expenses                              (25,513)      (20,822)      (22.5%)
Operating earnings*                              16,938        17,550        (3.5%)

Net finance expenses                             (1,174)        (758)       (54.9%)
Loss on disposal of assets                         (112)             -          N/A
Depreciation and amortisation expenses           (4,797)       (4,042)      (18.7%)
Income tax expense                               (3,225)       (3,667)        12.1%
Profit for the period                             7,630         9,083       (16.0%)

Operating Margin                                  39.9%         45.7%       (12.7%)

Operating earnings of $16.9 million (2020: $17.6 million) is 3.5% lower, with:                 The operating margin at 39.9% (2020: 45.7%) which is lower than our peers1
Operating revenue increasing 10.6% to $42.5 million:                                           due to:
• Data & Insights, Energy (including development revenue relating to the implementation of     •   the diverse nature of NZX (i.e. non-markets businesses and NZ RegCo) relative to peers. For
  new carbon managed auction service), Funds Management and Wealth Technologies                    example the operating margin of NZX’s commercial activities (i.e. excludes NZ RegCo) is
  business units revenues have increased; which is partially offset by                             41.6% (2020: 47.6%);
• Secondary listing fees, securities trading and securities clearing revenues reducing from
                                                                                               •   Capital raised, trading and clearing fees being lower than their H1-20 COVID peaks;

                                                                                                                                                                                                              NZX Half Year 2021 Results
  their peaks during comparable H1-20 COVID period; and
                                                                                               •   IT costs incurred to further strengthen our security as well as to increase trading and
Operating expenses increasing 22.5% to $25.5 million:                                              clearing system capacity and resilience, and maintain market stability; and
• the Markets businesses have supplemented the Securities IT team with additional skills and   •   Professional fees includes Smartshares investments for growth and exploring potential
  resources and have also invested to increase trading and clearing system capacity, improve       acquisition opportunities
  resilience and strengthen further our cyber defences;                                        Operating revenue, operating expenses and non-operating expenses are
• as well as implementing the new carbon managed auction service; and
• we continue to invest for growth in the Funds Management (exploring potential acquisition
                                                                                               discussed in detail on the following slides
  opportunities) and Wealth Technologies business units (to service new clients).              Segmental analysis by business unit is provided in detail in Appendix 1.
                                                                                               1 Finance Technology Partners (June 2021) EBITDA Margins (median) information for Regional/Country
                                                                                               Based Exchanges is estimated at 2021: 52%
                                                                                               * Operating earnings is not a defined performance measure in NZ IFRS. The Group's definition of operating
                                                                                               earnings may not be comparable with similarly titled performance measures and disclosures by other entities.   15
Operating Earnings
                                            June 2021        June 2020          Change                                                       H1-21 Revenue Analysis
                                                 $000             $000      Fav/(unfav)                                                                          0%
Revenue                                                                                                                                                         4%
                                                                                                                                                           5%
 Issuer Relationships                            6,795           7,291           (6.8%)                                                                               16%

 Secondary Markets                              14,339          13,334             7.5%
 Data & Insights                                 8,626           8,207             5.1%                                                    21%

 Funds Management                                8,941           6,760           32.3%
 Wealth Technologies                             2,074             849          144.3%
 Regulation                                      1,665           1,742           (4.4%)                                                                                      34%
 Corporate                                          11             189              N/A
                                                                                                                                                     20%
Total revenue                                   42,451          38,372           10.6%

Expenses                                                                                                       Issuer Relationships         Secondary Markets         Data & Insights            Funds Management
 Gross personnel costs                        (18,667)         (16,620)         (12.3%)                        Wealth Technologies          Regulation                Corporate
 Less capitalised labour                         3,004           2,573           16.8%
 Personnel costs                              (15,663)         (14,047)         (11.5%)
                                                                                                                                                     H1-21
 Information technology                        (5,858)          (3,707)         (58.0%)                                                      Gross Cost Base Analysis
 Professional fees                             (2,381)          (1,676)         (42.1%)
 Marketing                                       (510)            (376)         (35.6%)
 Other expenses                                (1,822)          (1,558)         (16.9%)                                                                                                           8%

                                                                                                                                                                                                                    NZX Half Year 2021 Results
 Capitalised overheads                             721             542           33.0%
                                                                                                                                                                                                         2%
                                                                                                                         64%                                                       20%
Total expenses                                (25,513)         (20,822)         (22.5%)                                                                                                                       1%
                                                                                                                                                                                                       3%

Operating earnings*                             16,938          17,550           (3.5%)                                                                                                                  1%
                                                                                                                                                                                                    1%

                                                                                                                Personnel                                             Info Technology
The Operating Revenue and Operating Expenses are discussed in the following
                                                                                                                Professional Fees                                     Marketing
slides, with further detailed Segmental Analysis by Business Unit provided in
                                                                                                                Travel                                                Directors Fees / Insurance / External Audit
Appendix 1
                                                                                                                Rent / Utilities / Office Supplies                    Other Expenses

* Operating earnings is not a defined performance measure in NZ IFRS. The Group's definition of operating
earnings may not be comparable with similarly titled performance measures and disclosures by other entities.
                                                                                                                                                                                                                    16
Operating Earnings Waterfall

                               NZX Half Year 2021 Results
                               17
Operating Revenue
Non Recurring Revenue                                     Data & Insights:                                         Other revenue has remained at similar level to the
Consulting and development revenue includes               Royalties from terminals revenue increase relates to     comparable period, being impacted by the low OCR
revenue relating to the development of the new            higher professional terminal numbers, partially offset   rate offset by introduction of stock lending in Q2 2020
carbon managed auction service for the Ministry for       by lower retail terminals numbers (from post H1-20
the Environment that was fully completed (non                                                                      Wealth Technologies:
                                                          COVID lock down peak)
recurring revenue $0.9m)                                                                                           Administration (FUA based) fees driven by:
                                                          Subscriptions and licences revenue growth reflects
                                                          continued growth in clients data usage and ability to    • New platform – revenue increased due to three
Issuer Relationships:                                     capture licence revenue streams post audit (resulting       new clients migrated in late 2020; and
Annual listing fees (ALF) were positively impacted by     in increased license numbers)                            • OE platform – number of customers is unchanged,
the growth in equity market capitalisation                Dairy subscription revenue has stablised post the           with 27% growth in FUA
Primary listing fees driven by equity and retail debt     disposal of the agri-businesses in 2018                  Development revenue included some client specific
listings                                                  Indices revenue growth has been driven through an        (non recurring) in the current period
Secondary issuance fees reflect a lower level of equity   increase in funds using the indices as benchmarks and
recapitalisations and retail debt issuances compared      additional index data clients                            Regulation (NZ RegCo):
to the H1-20 COVID period                                 Audit and back dated licencing revenue continues to      Regulatory fees relate to issuer regulation, market
                                                          have high levels of audit activity, although revenues    conduct, participant compliance and surveillance
Secondary Markets:                                        were slightly lower than H1-20                           activities, plus an internal allocation of Annual Listing
Securities trading and clearing revenues decreased        Connectivity revenue has increased in line with          Fees and Annual Participants Fees, set in advance
due to lower activity levels than the H1-20 COVID         increased connectivity requirements from both            based on the services expected to be provided by NZ
period                                                    market participants and data vendors                     RegCo
Dairy derivatives revenue decreased in line with lots                                                              Regulatory fees generating activity has been lower

                                                                                                                                                                               NZX Half Year 2021 Results
traded being down 31.9%                                   Funds Management:                                        than the H1-20 COVID period
Consulting and development revenue earned through         FUM based revenue has increased 35.6% driven by
• a higher level of enhancements to the electricity       increased average FUM (+43.0%), partially offset by      Corporate Services:
    market systems, including the market real time        new wholesale clients at lower average bps               Corporate revenue related to the short term sub lease
    pricing project, which is due for completion in       Member based revenue has increased 20%, reflecting       of part of the Wellington premises (ceased June 2020)
    2022; and                                             a mix of increased investor / member numbers, a          and NZX.com advertising revenue (ceased May 2020)
• development of the carbon managed auction               reduction in some annual admin fees from 1 April
    service for the Ministry for the Environment bi-      2021, and the comparable period which included a
    monthly auctions                                      historical pricing provision

                                                                                                                                                                               18
Operating Expenses
Non Recurring Costs                                                 Information Technology                                                 Marketing
Development of the new carbon managed auction service               IT costs include additional costs from:                                Marketing spend increased for the Issuer Relationship team,
for the Ministry for the Environment was fully completed            •   Cyber security – additional license costs to improve resilience    with additional membership of various industry groups to
(non recurring expenses $0.7m) and bi-monthly auctions                  of NZX's clearing and settlement system (BaNCS), plus the          identify listing opportunities
commenced                                                               modification and strengthening of existing security services       Marketing spend remains low for the Investor relations
                                                                        and the implementation of additional cyber defence                 program, marketing the exchange business, and Smartshares
                                                                        capabilities and security services to mitigate the impact of any
Personnel costs                                                                                                                            branding promotion
                                                                        future cyber attacks
Personnel costs are driven by the average FTEs in the period        •   Carbon – costs associated with the development and ongoing
and the capitalisation of internal development resources                operation of the new carbon managed auction service for the        Professional Fees
Personnel costs have increased due to a combination of                  Ministry for the Environment.                                      Professional fees include those relating to:
wage inflation, higher levels of annual leave taken (relative       •   Energy Electricity Market – utilising third party specialist       •   set up costs for the dairy derivatives partnership with SGX, and
to the COVID lockdown period), and the movement in                      support to assist with the increased level of development              costs associated with the development of the new carbon
average FTEs arising from:                                              (which is generating additional consulting and development             managed auction service for the Ministry for the Environment.
•   the Securities IT team additional resources to deliver              revenue);                                                          •   Smartshares investments for growth includes the costs
    technology solutions to increase trading and clearing system    •   Trading and clearing system costs – impacted by movements              associated with exploring potential acquisition opportunities;
    capacity and resilience, and maintain market stability;             in FX rates and contractual inflation rates;                       •   the assurance programme – internal audits, internal control
•   Issuer Relationships additional sales role focused on           •   Data & Insights IT costs – increases in software licences              reports, energy audits and consulting obligations under the
    origination, with active pipeline development and conversion;       associated with the delivery of customer management data               Electricity Authority contracts, annual conflicts review;
•   Secondary Markets product resource to support growth in the         platforms;                                                         •   terminal royalty audit fees which vary in proportion to audit
    depository business;                                            •   Smartshares Bloomberg AIM and BSKT costs (front and middle             revenue; with costs and revenues recognised on a gross basis
•   Energy contractors delivering increased levels of consulting        office operating system) now reflect a full period after being         and
    and development revenue including the electricity market real       implemented in Q4-20; and                                          •   EEX royalty fees relating to the carbon managed auction
    time pricing project and the carbon managed auction service;    •   Wealth Technologies additional data feeds, data hosting and            service
•   Smartshares additional sales and customer services resources        software license costs relating to new clients
    to support client and FUM growth;                                                                                                      Other Expenses

                                                                                                                                                                                                                  NZX Half Year 2021 Results
•   Wealth Technologies additional client facing, onboarding and    Capitalised overheads                                                  Other expenses include premises related costs (i.e.
    technical staff to service new clients;                         The portion of all expense categories which relate to capital          electricity, rates etc), insurance, directors fees, travel,
•   Corporate Services additional legal, HR and communications      activities (e.g. Wealth Technologies core platform, NZX’s              external audit costs, outsourced payroll system, corporate
    resources to support the Smartshares and Wealth                 trading system upgrade and the Network Transformation                  memberships, statutory / compliance costs and non
    Technologies businesses;                                                                                                               recoverable GST (on the Clearing House, Smartshares and
                                                                    project) has increased (2021: $0.72 million; 2020: $0.54
•   Additional project management resources related to the
                                                                    million)                                                               Wealth Technologies businesses).The increase relates to
    current elevated levels of project activity; and
•   movements in vacancy numbers at period ends                                                                                            renewed travel (relative to the H1-20 COVID period), plus
                                                                                                                                           higher insurance and compliance costs
Capitalisation of internal development resources (2021:
$3.00 million; 2020: $2.57 million) primarily relates to
Wealth Technologies' core platform, NZX’s trading system
upgrade and the Network Transformation project
                                                                                                                                                                                                                  19
Non-operating Income and Expenses

                                      June 2021   June 2020      Change
                                                                            Net finance costs include:
                                          $000        $000    Fav/(unfav)   •   interest income on operational cash balances, Clearing House risk capital
Interest income                            174         534       (67.4%)        and regulatory working capital; which have been impacted by decreased
                                                                                interest rates;
Interest on lease liabilities             (122)       (215)        43.3%
Other interest expenses                 (1,183)     (1,181)        (0.2%)   •   interest expenses (including amortised borrowing costs) on the
Amortised borrowing costs                  (40)        (37)        (8.1%)       subordinated notes and lease liabilities; and
Net gain/(loss) on foreign exchange         (3)        141      (102.1%)    •   Net gain/(loss) on foreign exchange
Net finance expenses                    (1,174)       (758)      (54.9%)

                                                                            Depreciation and amortisation expenses have increased due to amortisation
Depreciation of PP&E                      (428)       (482)        11.2%
                                                                            on Wealth Technologies capitalised costs in late 2020 relating to the core
Amortisation of lease assets              (654)       (613)        (6.7%)   platform's refinement and the completed migrations of new clients
Amortisation of intangibles             (3,715)     (2,947)      (26.1%)
Total depreciation and amortisation     (4,797)     (4,042)      (18.7%)
                                                                            Effective tax rate is higher than statutory rate of 28% due to non-deductible
                                                                            items
Loss on disposal of assets                (112)           -          N/A

                                                                                                                                                            NZX Half Year 2021 Results
Tax expense                             (3,225)     (3,667)        12.1%

Total net other expenses                (9,308)     (8,467)       (9.9%)

                                                                                                                                                            20
Financial Position and
Cash Flows

                         21
Balance Sheet

                                        June 2021   June 2020       Change
                                            $000        $000    Fav/(unfav)
                                                                              Cash and cash equivalents includes:
Current assets                                                                •   Clearing House risk capital ($20 million) which is not available for general use;
Cash and cash equivalents                 41,325      41,420         (0.2%)
Receivables and prepayments               23,179      20,798         11.4%    •   Clearing House also complies with International Organisation of Securities
Funds held on behalf of third parties    135,643     121,159         12.0%        Commissions principles requiring retention of sufficient working capital
Total current assets                     200,147     183,377          9.1%        (including cash of approximately $2.6 million); and
                                                                              •   Smartshares maintains sufficient net tangible assets in accordance with its
Non-current assets                                                                license requirements (including cash of approximately $3.9 million)
Right-of-use lease assets                   4,456       6,199      (28.1%)
Other non-current assets                  77,007      71,984          7.0%    Funds held on behalf of third parties (assets and liabilities) offset. These relate to
Total non-current assets                  81,463      78,183          4.2%    issuer bond deposits, participants’ collateral deposits and deposited funds
                                                                              (including those held in the Mutualised Default Fund). Amounts are repayable to
Current liabilities                                                           issuers and participants and not available for general use
Trade payables                              8,261       5,257      (57.1%)    Right-of-use lease assets and the lease liabilities relate to leased premises and IT
Other current liabilities                 19,476      17,793         (9.5%)   equipment
Lease liabilities                          1,052       1,657         36.5%
Funds held on behalf of third parties    135,643     121,159       (12.0%)    Other non-current assets consist of property, plant & equipment, intangible assets
Total current liabilities                164,432     145,866       (12.7%)    and goodwill

                                                                                                                                                                       NZX Half Year 2021 Results
                                                                              Other current liabilities includes income in advance related to annual listing (billed
Non-current liabilities
                                                                              on 30 June each year), data subscriptions, employee benefits payable, and tax
Interest bearing liabilities              38,940      38,871         (0.2%)
                                                                              payables
Lease liabilities                           5,232       7,267        28.0%
Other non-current liabilities               3,787       3,584        (5.7%)   Other non-current liabilities mainly relate to deferred tax
Total non-current liabilities             47,959      49,722          3.5%

Net assets/equity                         69,219      65,972          4.9%

                                                                                                                                                                       22
CAPEX

        Core Markets
        CAPEX driven by specific system life cycles which result in large multi-year projects, plus
        the normal life cycle replacements for IT equipment and software
        As expected, H1-21 CAPEX is higher, including:
        • Technology upgrades and enhancements – of the NZX technology architecture and
            the Network Transformation project which strengthens NZX’s cyber security;
        • The establishment of a Capital Markets Centre in Auckland; and
        • Trading System upgrade
        Additional focus for H2-21 includes:
        • Technology upgrades – continued enhancements of NZX technology architecture and
            the Network Transformation project, as well as NZX.com capabilities, and automation
            of the Depository system and processes;
        • Finalisation of the Capital Markets Centre in Auckland, including replacement of the
            old ticker; and
        • Preparing for the Clearing System upgrade which is expected in 2022/23

                                                                                                      NZX Half Year 2021 Results
        Growth Businesses
        Wealth Technologies CAPEX relates primarily to migration of new clients onto the
        platform
        Smartshares CAPEX relates to the delivery of digital tools for improved client servicing
        and efficiency. This is important to the successful implementation of the new KiwiSaver
        Default Scheme i.e. automation of the migration of new KiwiSavers and their client
        experience

                                                                                                      23
Cash Flows

                                                                                   Operating activities
                                                                                   •   Cash flow from operating activities includes net interest and income tax paid
                                            June 2021   June 2020       Change     •   The decrease reflects a lower Net Profit After Tax and working capital
                                                 $000        $000   Fav/ (unfav)       movements (e.g. timing of receivables receipts and trade payables payments)
Operating activities                            3,854       6,837       (43.6%)

Investing activities                          (7,903)     (5,081)       (55.5%)
                                                                                   Investing activities
Financing activities                          (7,401)     (8,076)        (8.4%)
                                                                                   •   Investing activities relate to CAPEX, which is primarily:
Net decrease in cash and cash equivalents    (11,450)     (6,320)       (81.2%)           •   Wealth Technologies software development;
                                                                                          •   The new Auckland office fit out;
                                                                                          •   The Trading System upgrade; and
                                                                                          •   Technology upgrades and enhancements, including to the NZX
                                                                                              technology architecture, and the Network Transformation project

                                                                                                                                                                       NZX Half Year 2021 Results
                                                                                   Financing activities
                                                                                   •   Financing activities includes dividends which are net of participation in the
                                                                                       dividend reinvestment plan, and payment of lease liabilities.

                                                                                                                                                                       24
Interim Dividend and
2021 Earnings Guidance

                         25
Interim Dividend                                                                      2021 Earnings Guidance

Final Dividend                                                                        2021 Earnings Guidance
•   The Board has declared a fully imputed interim dividend of 3.0 cents per share
                                                                                      NZX is maintaining its full year 2021 Operating Earnings* to be in the range of
•   Dividend to be paid on 24 September 2021 to shareholders registered as at 10      $32.0 million to $35.5 million.
    September 2021
                                                                                      The guidance is subject to market outcomes, particularly with respect to market
                                                                                      capitalisation, total capital raised, secondary market value and derivatives
                                                                                      volumes traded, funds under management and administration growth and
Dividend Policy
                                                                                      technology costs.
•   The policy is to pay between 80% to 110% of adjusted Net Profit After Tax
    over time, subject to maintaining a prudent level of capital to meet regulatory   Additionally, NZX notes the global health environment remains volatile and this
    requirements                                                                      guidance assumes no material adverse events, significant one-off expenses, major
•   Adjustments include reversing the impact of intangible asset impairments (if      accounting adjustments, other unforeseeable circumstances, or future
    any)                                                                              acquisitions or divestments.

                                                                                                                                                                                                NZX Half Year 2021 Results
Dividend reinvestment plan
•   Available for the final dividend
•   Shares will be issued at 1.0% discount

                                                                                       * Operating earnings is not a defined performance measure in NZ IFRS. The Group's definition of
                                                                                       operating earnings may not be comparable with similarly titled performance measures and disclosures by
                                                                                       other entities.

                                                                                                                                                                                                26
NZX’s Strategy

                 27
NZX 2.0: The heart of our strategy
Grow Markets – The previously named ‘Refocus Core’ and ‘Grow
Opportunities’ are consolidated under ‘Grow Markets’ with
particular focus on driving listings, leveraging the New Zealand
advantage

                                                                 New Zealand’s Exchange
                                                       “Helping to Build New Zealand’s Tomorrow”                        Empower Performance –
                                                                                                                        ensuring the right technical and
                                                                                                                        people capabilities creating
                                       Grow markets                    Maximise financial             Empower           efficiencies in execution and
                                                                           services                  performance        innovation to drive growth

                                                                   Act with greater purpose

                                                                                                                                                           NZX Half Year 2021 Results
 Maximise Financial Services – previously named ‘Maximise
                                                                                                   “By combining the needs of our customers,
 Options’, to deliver super-normal growth and sustain the
                                                                                                   with innovation and modern technology we
 business in the long term
                                                                                                   build enduring markets to deliver capital
                                                                                                   pathways, investment opportunities and
                                                                                                   economic success for New Zealand”
                                                                                                                                                      28
NZX 2.0 is a financial markets model structured to enable a
virtuous circle of growth
*Driving scale in capital flows enables growth                                                1. Product.
 Scale in Smartshares enables NZX to create a greater range of                                Listed equity, fixed income and fund securities
 investment products which enables passive capital to flow to                                 delivers product for investors and also delivers
 wider parts of the market. These can                                                         deeper data
 be available for investors and financial advisors.                     Listing
 Wealth Tech delivers the platform for efficient administration
 of investments

                                                                          Capital
                                                                          Flows*

                                                                                    Trading

                                                                                                                                                        NZX Half Year 2021 Results
                        3. Data and Insights.                     Informing
                        Greater liquidity delivers deeper data
                        sets, deeper data drives liquidity and
                        product listings
                                                                                                   2. Liquidity.
                                                                                                   Liquidity helps drive additional product listings,
                                                                                                   and greater capital flows and delivers deep data
                                                                                                   sets

                                                                                                                                                        29
We are doing what we said we would…delivering growth
                                      NEW ZEALAND’S EXCHANGE

           Removed Blockages                         Delivered Results and                               Growing Our Market
 2018                                     2019                                            2020
                                                     Proof Points

                                                      Driving new equity listings                  4 new listings in H1 21

                          Grow Markets               Grow participation/liquidity               % on market, % up in trading

        2021
                                                  Execute on dairy initiatives, deliver        NZX SGX partnership finalised,
                                                           carbon market                             carbon launched

Support growth across
                                                                                           Smartshares FUM +44.3% on H1-20 and
   the NZX Group                                 Drive margin growth in Smartshares

                                                                                                                                                NZX Half Year 2021 Results
                             Maximise                                                           operating earnings +36.2%
                         Financial Services
                                                                                          Wealth Technologies FUA +151.1% on H1-
                                                 Deliver client transitions Wealth Tech    20 and operating earnings now positive

                                                                                            Enhanced NZX’s IT capabilities, security services
                           Empower               Mature approach to technology &            improved to mitigate the impact of future cyber
                          Performance            excellence in operational basics              attacks, implemented Bloomberg in SMS,
                                                                                                completed the Trading System upgrade

                                                                                                                                                30
Building a sustainable business and ESG strategy anchored in
our vision and purpose…
                                       “Helping to Build New Zealand’s Tomorrow”
     “By combining the needs of our customers, with innovation and modern technology we build enduring markets to
               deliver capital pathways, investment opportunities and economic success for New Zealand”
Strong ESG Market Leadership - Creating transparency                              NZX focus

    Facilitating the carbon market and green bonds                                We are on a similar journey as our customers. The key is to look for continual
    • Carbon Auction launched March 2021 - Enables businesses to offset as        improvement and focus on three key areas of impact.
      they transition to lower carbon activity. Plans to grow in this space       1. Leading customer behaviour change – will improve impact across NZ and our own
    • Carbon Efficient Index - Enabled visibility and transparency of carbon      2. Key measures internally:
      efficiency to the market and our issuers to encourage behavior change              a) Validated measure of carbon intensity – target 18 months to have all
    • Green Bonds - $8.775 billion of Green and Sustainable bonds listed on the          b) Gender equality, including continual pay gap analysis and adjustment
      NZDX. Continued interest from issuers and investors will drive growth in           c) Wellbeing – measured through biannual GPS
      this space.                                                                 3. Continued enhancement of governance arrangements:
                                                                                         a) Structural separation of regulatory activities (RegCo) from NZX's
    Gender Equality                                                                         commercial activities, including implementation of a separate permanent
    • Issuer gender diversity statistics provide transparency on behaviour

                                                                                                                                                                         NZX Half Year 2021 Results
                                                                                            RegCo board
      change                                                                             b) Establishment of a specialist technology committee to provide oversight in
    ESG Initiatives                                                                         executing NZX's technology strategy
    • ESG report providing guidance to issuers and transparency across                   c) Continued participation in the Future Director programme to help identify
      progress in measuring the impact of behavior change                                   and grow the next generation of directors for New Zealand, with the
                                                                                            appointment of Victoria Newman from 1 July 2021
    • Creating a platform to cross pollinate ESG knowledge (webinars/podcasts)
                                                                                  Next steps - understanding the measures and creating key focus areas for behaviour
    • Partnering with global agencies on data collection, e.g. ESG scores on      change
      listed companies while supporting efforts on required behavior change              a) Carbon emission adaption
    • NZX 1:1 accessibility supporting our customers on their ESG journey with           b) Gender Equality improvement
      guidance and connection                                                            c) Focus on Diversity and Inclusion
    • Smartshares’ product suite expanded to include ESG shares ETFs                                                                                                     31
Building a diverse but connected business
Diversified, scalable and resilient business portfolio serves as a strong basis for future growth

               100%     2.3%      1.5%                    2.2%
                                             2.6%                         4.9%

                                 16.9%
                                                                                  •   The Funds Management and Wealth Technologies businesses now account
                        16.1%                             17.6%
                                             19.1%                                    for 26.0% of revenues (H1-20: 19.8%)
                                                                          21.1%
               80%      4.6%      4.7%
                                             4.2%
                                                          4.5%                    •   Additionally the Secondary Markets segment includes the growth businesses -
                                                                          3.9%        Dairy and Carbon commodity markets

                                                                                  •   The growth businesses are early in their growth life cycle and will continue to
               60%
                                                                                      grow as a % of revenue (and ultimately operating earnings)
% of Revenue

               40%
                        77.0%    76.9%                    75.6%
                                             74.1%
                                                                          70.1%

                                                                                                                                                                        NZX Half Year 2021 Results
               20%

                0%
                        2017      2018       2019         2020             2021

                      Markets   Regulation   Funds               Wealth
                                             Management          Technologies

                                                                                                                                                                        32
Questions?

             33
Appendix

           34
Appendix 1: Segmental Analysis
Operating Earnings By Business Unit

Six months ended 30 June 2021           Issuer Relationships Secondary Markets        Data & Insights          Markets            Funds Management          Wealth            Corporate Services     NZX Commercial              Regulation              NZX Group
$000                                                                                                           Sub-total                                 Technologies                                  Operations                                          Total
                                                                                                                                                                                                        Sub-total

Operating revenue                                      6,795                14,339                 8,626                29,760                 8,941                 2,074                     11                  40,786                     1,665                42,451
Operating expenses                                                                                                      (8,988)               (5,034)               (1,946)               (7,863)                 (23,831)                  (1,682)               (25,513)
Operating earnings                                                                                                      20,772                 3,907                    128               (7,852)                  16,955                      (17)                16,938
FTEs                                                                                                                       77.1                  51.4                  61.7                  60.2                    250.4                     16.5                  266.9
Operating margin                                                                                                         69.8%                 43.7%                  6.2%                   N/A                    41.6%                      N/A                  39.9%

Six months ended 30 June 2020           Issuer Relationships Secondary Markets        Data & Insights          Markets            Funds Management          Wealth            Corporate Services     NZX Commercial              Regulation              NZX Group
$000                                                                                                           Sub-total                                 Technologies                                  Operations                                          Total
                                                                                                                                                                                                        Sub-total

Operating revenue                                      7,291                13,334                 8,207                28,832                 6,760                    849                  189                   36,630                     1,742                38,372

Operating expenses                                                                                                      (6,916)               (3,891)               (1,382)               (7,011)                 (19,200)                  (1,622)               (20,822)
Operating earnings                                                                                                      21,916                 2,869                  (533)               (6,822)                  17,430                       120                17,550
FTEs                                                                                                                       68.1                  49.8                  50.3                  51.7                    219.9                     19.5                  239.4

                                                                                                                                                                                                                                                                                   NZX Half Year 2021 Results
Operating margin                                                                                                         76.0%                 42.4%               (62.8%)                   N/A                    47.6%                      N/A                  45.7%

Notes:
•    Markets is the integrated business that supports the growth of NZ capital markets with the revenue generating BUs being:
     –     Issuer Relationships – provider of issuer services for current and prospective customers;
     –     Secondary Markets – provider of trading and post-trade services for securities and derivatives markets operated by NZX, as well as the provider of a central securities depository and Market operator for Fonterra Co-Operative Group, the Electricity Authority and
           the Ministry for the Environment; and
     –     Data & Insights – provider of data services for the securities and derivatives markets, and analytics for New Zealand's dairy sector.
     Additionally the Markets business cost base includes the IT costs specific to providing NZ capital markets services.
•    Funds Management (Smartshares Limited) – comprises the SuperLife superannuation and KiwiSaver products and Smartshares Exchange Traded Funds
•    Wealth Technologies (NZX Wealth Technologies Limited) – provides a platform that enables advisers and brokers to manage client investments
•    Regulation (NZX Regulation Limited – is the independently-governed agency which performs all of NZX’s frontline regulatory functions, this ensures structural separation of the Group's commercial and regulatory roles.
•    Corporate Services provides accommodation, legal, accounting, IT, HR and communications and marketing support to the other business units and subsidiaries. Related costs are currently not recharged to the commercial business units and subsidiaries (other than
     NZ RegCo)
•    Operating earnings is not a defined performance measure in NZ IFRS. The Group's definition of operating earnings may not be comparable with similarly titled performance measures and disclosures by other entities.

                                                                                                                                                                                                                                                                                   35
Appendix 1: Markets – Issuer Relationships
Tasked with creating a compelling and attractive proposition for our current and prospective equity, fund and debt customers

                                                                               Change
Strategic metrics                      June 2021           June 2020                       Highlights
                                                                             Fav/(unfav)
Equity market capitalisation             $179.1 billion     $158.5 billion         13.0%   • Total capital (primary and secondary) raised $7.3 billion
Funds market capitalisation                $7.0 billion       $5.0 billion         41.3%   • Listings during H1-21 were:
Debt market capitalisation                $41.4 billion      $36.7 billion         12.7%            • IPO - My Food Bag Limited (MFB),
Total Market Capitalisation              $227.5 billion     $200.2 billion         13.6%            • Direct Listings – Third Age Health Services Limited (TAH) and NZ Automotive Investments
                                                                                                        Limited (NZA)
Primary capital raised                     $3.4 billion       $2.3 billion         46.9%            • Foreign Exempt Listing – DGL Corporation (DGC)
Secondary capital raised                   $3.9 billion       $5.9 billion       (33.9%)   • Green Bonds – Mercury NZ $200 million (supporting NZ’s transition to a low emissions future), and
Total capital raised                       $7.3 billion       $8.2 billion       (10.6%)       PPNZ $150 million (to finance or refinance energy efficient buildings)
                                                                                           • Other sustainable and ethical investment capital raised included Housing New Zealand (Kāinga
                                       June 2021           June 2020           Change          Ora) issuing further 2028 Wellbeing bonds ($600m) supporting the development of good quality,
Operating Revenue
                                         $000                $000            Fav/(unfav)       affordable housing
Annual listing fees                                                                        • Team very active in terms of contacting new companies and engaging with the ecosystem across
                                                   4,981            4,888           1.9%
(net of internal revenue allocation)                                                           investment banks, law firms, accounting firms, private equity and sponsorship partners to drive
Primary listing fees                                 555              208        166.8%        new listings opportunities
Secondary issuance fees                            1,259            2,195        (42.6%)   • Planned a number of “Listing your company” and “Raising capital in New Zealand” events with
Total operating revenue                            6,795            7,291         (6.8%)       partners including NZTE, ASB, Syndex, and Angel Association New Zealand

                                                                                                                                                                                                  NZX Half Year 2021 Results
                                                                                           Operating revenue
                                                                                           • The Annual listing fee year runs from 1 July to 30 June; hence the H1-21 fees are based on market
                                                                                              capitalisation at 31 May 2020. Annual listing fees have been positively impacted by the growth in
                                                                                              equity market capitalization, and the growth in number and value of debt instruments
                                                                                           • Primary listing fees driven by increased levels of new capital listed and new retail debt listings
                                                                                           • Secondary listing fees driven by lower levels of equity and retailed debt raised

                                                                                                                                                                                                  36
Appendix 1: Markets – Secondary Markets
Tasked with driving secondary market development across all markets and managing participant relationships, and delivering on
our contracted service provider offerings

                                                                                       Change      Highlights (continued)
Strategic metrics                                 June 2021         June 2020
                                                                                     Fav/(unfav)
                                                                                                   • NZX Clearing consultation on Recovery and Resolution planning continues
Number of trades                                    8.04 million     5.89 million         36.5%
                                                                                                   • NZX Depository business continues to grow with an increased value of assets under custody (+44.3%) and
Total value traded                                  $27.1 billion    $27.9 billion        (2.8%)       value of OTC transactions (+4.9%) largely due to depository participant, BNP, and its underlying client's
Percentage of value on-market                             63.8%            62.4%            2.3%       assets increasing.
                                                                                                   • Dairy derivatives – the global partnership to grow NZX’s dairy derivatives market with the Singapore
Depository assets under custody (at period end)      $5.4 billion     $3.7 billion        44.3%        Exchange (SGX) is planned to go live in late H2-21 (subject to regulatory approvals)
                                                                                                   • Energy – successfully launched a carbon managed auction service in partnership with the European Energy
Dairy derivatives lots traded                           139,950          205,626         (31.9%)       Exchange (EEX)
                                                                                                   • Energy – the Real Time Pricing multi year project continues to achieve milestones
Number of participants                                        32                34        (5.9%)

                                                  June 2021         June 2020          Change      Operating revenue
Operating Revenue
                                                    $000              $000           Fav/(unfav)   • Participant services revenue relates to the reduced number of market participants (from 34 to 32; with the
Participant services revenue                                                                          resignation of Tiger Brokers and the amalgamation of OM Financial into Jarden), partially offset by
                                                              357             366         (2.5%)
(net of internal revenue allocation)                                                                  increased fees from 1 July 2020
Securities trading revenue                                2,640            2,863          (7.8%)   • Securities trading revenue has been adversely impacted by uncharged value traded (mainly caused by large
Securities clearing revenue                               4,190            4,466          (6.2%)      index rebalance trading days where fees on value traded exceeds the fee cap), which has increased to
Dairy derivatives revenue                                   522              773         (32.5%)      10.9% (2020: 7.9%)
Consulting and development revenue                        1,856              339         447.5%    • Securities clearing revenue has been negatively impacted by cleared value as well as lower levels of clearing

                                                                                                                                                                                                                     NZX Half Year 2021 Results
Contractual revenue                                       4,774            4,527            5.5%      margin, clearing penalties and depository registry transfer fees.
Total operating revenue                                  14,339           13,334            7.5%   • Dairy derivatives revenue has been adversely impacted by lower lots traded, which have been impacted by
                                                                                                      the low volatility of GDT prices during the period, and with ongoing COVID travel restrictions continuing to
Highlights                                                                                            inhibit global marketing and events activity.
• Value traded $27.1 billion with record on-market trading activity 63.8% and record               • Contractual revenue in line with long term contracts with the Electricity Authority, Fonterra and the carbon
    number of trades at 8.0 million for the period                                                    managed auction service for the Ministry for the Environment
• The total number of Trading, Clearing, Depository and Sponsor Participants has                   • Consulting and development revenue is being earned through enhancements to the electricity market
    reduced by 2 since December 2020. NZX saw the resignation of Tiger Brokers and the                systems, including the multi year market real time pricing project. As well as finalising the development of
    amalgamation of OM Financial into Jarden                                                          the carbon managed auction service for the Ministry for the Environment
• BNP Paribas is expected to become a General Clearing Participant in late 2021
• Trading system upgrade project went live in early August 2021, with the launch of
    NZX DARK (the midpoint order book) expected in 2022
                                                                                                                                                                                                                     37
Appendix 1: Markets – Data & Insights
Tasked with growing existing data revenues and turning raw data into insights that supports growth in all markets

                                                                               Change       Highlights
Strategic metrics                             June 2021       June 2020
                                                                             Fav/(unfav)
                                                                                            • Recurring revenue (i.e. excluding audit and back dated licenses revenue) increased 8.7%:
Terminal numbers (3 month average)                   8,580           8,909         (3.7%)
                                                                                                     • Royalty revenue growth of 8.3% is a mix of professional terminals (higher value -
Licences                                               137             124         10.5%
                                                                                                        increased 6.2%) and retail terminals (lower value - decreased 26.5% from post H1-20
Proprietary security products subscriptions            311             314         (1.0%)               COVID lockdown peak)
Dairy data products subscriptions                      464             467         (0.6%)
                                                                                                     • Subscription and licences revenue growth of 12.1% reflects continued growth in non-
                                                                                                        display applications and ability to capture licence revenue streams post audit (resulting in
                                              June 2021       June 2020      Change                     increased license numbers)
Operating Earnings
                                                $000            $000       Fav/(unfav)
                                                                                                     • Indices business growth has been driven through an increase of passive assets under
Royalties from terminals                              3,640          3,360         8.3%
                                                                                                        management across the funds management market and additional index data clients
Subscriptions and licences                            2,287          2,040        12.1%
                                                                                                     • Connectivity revenue reflects changing client connectivity requirements
Dairy data subscriptions                                328            315         4.1%
                                                                                            • Audit activity continues to be high, driving one off audit and back dated licencing revenue
Indices                                                 504            490         2.9%
                                                        606            829      (26.9%)
                                                                                            • Carbon Efficiency Indices launched, in conjunction with S&P, in May
Audit and back dated licences
Connectivity                                          1,261          1,173         7.5%     • Wide area network upgrade completed in May providing increased bandwidth and remote
                                                                                                monitoring capability
Total operating revenue                               8,626          8,207         5.1%

                                                                                            Operating revenue
                                                                                            • Royalties from terminals revenue increase relates to higher value professional terminal numbers

                                                                                                                                                                                                       NZX Half Year 2021 Results
                                                                                               increasing, partially offset by the lower value retail terminal numbers dropping post their peak
                                                                                               during the COVID lockdown period
                                                                                            • Subscriptions and licences revenue increase is driven by increased license numbers, increased
                                                                                               non-display usage, and renewing client license arrangements post audit.
                                                                                            • Dairy subscription revenue has stabilised after a churn period of dairy subscriptions post disposal
                                                                                               of the agri-businesses
                                                                                            • Indices revenue growth has been driven through an increase in funds using the indices as
                                                                                               benchmarks across the funds management market and additional index data clients
                                                                                            • Audit and back dated licencing revenue of $606k (H1-20 $829k) continues to be high due to high
                                                                                               levels of audit activity; activity levels are expected to tail off over the coming years
                                                                                            • Connectivity revenue has increased in line with ensuring market participants and data vendors are
                                                                                               connected to a higher standard of performance and resilience
                                                                                                                                                                                                       38
Appendix 1: Markets
An integrated business that supports the growth of NZ capital markets

                                                         June 2021       June 2020          Change       Operating expenses (continued)
Operating Earnings
                                                           $000            $000           Fav/(unfav)
                                                                                                         • Personnel costs have increased due to a higher average FTEs, arising from the additional roles
Operating revenue                                                                                           recruited during the period. There remain vacancies in the IT team (to address aspects of the FMA
Issuer Relationships                                            6,795            7,291          (6.8%)      Action plan from their NZX Market Operator Obligations Targeted Review) and the Energy team (to
Secondary Markets                                              14,339           13,334            7.5%      deliver increased levels of consulting and development revenue)
Data & Insights                                                 8,626            8,207            5.1%   • Capitalised labour levels have been higher as the trading system upgrade approached go-live in
Total operating revenue                                        29,760           28,832            3.2%      early August 2021
                                                                                                         • Information technology costs are higher due to:
Operating expenses                                                                                               • Energy Carbon Market – have been using third party specialist support to assist with the
Gross personnel costs                                           5,236            4,612        (13.5%)                 development and ongoing support of the carbon managed auction service for the Ministry
Less capitalised labour                                         (325)            (108)        200.9%                  for the Environment;
Personnel costs                                                 4,911            4,504         (9.0%)            • Energy Electricity Market – have been using third party specialist support to assist with the
                                                                                                                      increased level of development (which is generating additional consulting and
Information technology costs                                    2,921            1,851        (57.8%)                 development revenue);
Professional fees                                                 865              396       (118.4%)            • Trading and clearing system costs – impacted by movements in FX rates and contractual
Marketing                                                         220                64      (243.8%)                 inflation rates; and
Other expenses                                                    195              142        (37.3%)            • Data & Insights IT costs – increases in software licences associated with the delivery of
Capitalised overhead                                            (124)              (41)        202.4%                 customer management data platforms
Total operating expenses                                        8,988            6,916        (30.0%)    • Professional fees relate to:
                                                                                                                 • annual assurance program – including audit fees (e.g. Clearing House annual operations
Operating earnings                                             20,772           21,916          (5.2%)                audit), tax advice; energy audit obligations under Electricity Authority contract (e.g. Energy

                                                                                                                                                                                                                       NZX Half Year 2021 Results
                                                                                                                      Pricing Manager review and Energy Reconciliations Manager review in the current period);
FTEs (at 30 June)                                                77.1             68.1        (13.2%)            • royalty audit fees $168k (H1-20 $147k) – which are charged as a proportion of the royalty
                                                                                                                      audit receipts. Royalty audit receipts and audit fees are recognised on a gross basis; and
 Operating expenses
                                                                                                                 • EEX royalty fees relating to the carbon managed auction service
 Headcount movements, other than changes in vacancies, include additional roles:
                                                                                                         • Marketing costs – the marketing focus has increased for the Issuer Relationship team and includes
 • Issuer Relationships – an additional role focused on origination, with active pipeline                   increased membership of various industry groups to identify listing pipeline opportunities. In H1-20
    development and conversion;                                                                             the marketing costs were lower due to the COVID lockdown period
 • Secondary – a Product Manager role;                                                                   • Other costs - travel costs have been higher than H1-20 during the COVID lockdown period
 • Energy – 4 FTEs to deliver increased levels of consulting and development revenue including
    the electricity market real time pricing project and the carbon managed auction service; and
 • Securities IT – another role (additional to those hired in 2020) to deliver technology solutions
    to increase trading and clearing system capacity and resilience, and maintain market stability
                                                                                                                                                                                                                       39
You can also read