BOROUGH OF KEYPORT
2022 REASSESSMENT REPORT
←
→
Page content transcription
If your browser does not render page correctly, please read the page content below
BOROUGH OF KEYPORT 2022 REASSESSMENT REPORT
INTRODUCTION
The past two years have been an exceptional period for real estate property values. Housing
scarcity and record low mortgage interest rates have caused incredible price appreciation and
volatility throughout the entire market. The recent market changes highlight the importance of
the assessment function, which serves as the distribution mechanism of county, school, and
municipal tax levies.
The New Jersey constitution requires annual tax levies to be distributed based on market value.
Contrary to popular belief, property assessments do not generate taxes. They simply distribute
them. Despite technological advances, many municipalities in the state maintain a static
assessment environment. Meaning, assessments are set during a revaluation year where they
remain unchanged for 10 and sometimes 20 or more years. That time stamped snap shot of the
market, taken on October 1 of the revaluation year, quickly becomes outdated as the different
facets of the real estate market begin to change. Real estate sectors, neighborhoods, property
types, and so on will each appreciate and depreciate at different rates. The static assessment
environment cannot accommodate market fluidity and the resulting assessment inaccuracies
will cause the tax levy to be disproportionately divided amongst the taxpayers. By not
implementing a proactive assessment maintenance approach, tax distribution becomes less
accurate each year that passes. The built-in assumption of the static assessment environment,
that all property values within a municipal boundary appreciate or depreciate at the same rate
over time, will continue to compromise fair and equitable levy distribution. Annual assessment
maintenance is simply about tax distribution fairness (as defined by the NJ Constitution). The
annual reassessment model has the ability to adapt to the everchanging real estate market, and
by doing so, assessment accuracy and fair tax distribution are preserved.
Through the 2022 reassessment, changes to the global assessment modeling were made to
target market value. Adjustments were also made to all individual properties, neighborhoods
and submarkets to refine assessment accuracy. The goal of the reassessment is to annually
target 100% market value so that statistical measurements represent better assessment
accuracy. For the 2022 tax year, the overall aggregate value for the Borough of Keyport will be
approximately 10.83% higher than it was in 2021.

                                                                                                  2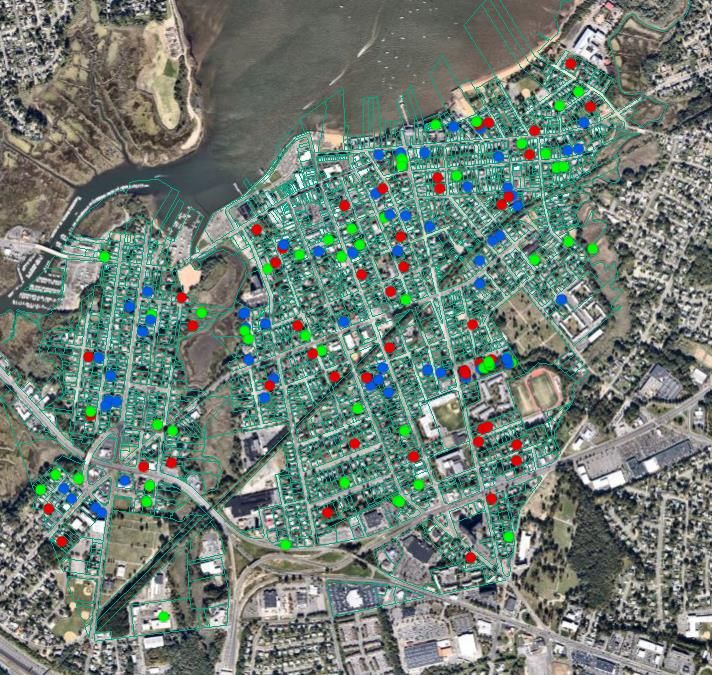
PRIOR YEAR (2021) REFLECTION
Each October, the NJ Division of Taxation conducts statistical studies which measure the
accuracy of current year assessments. These studies could be considered the “assessor’s
gradebook” for that year’s assessments and resulting tax distribution. Nevertheless, recognition
must be made that the assessments are produced the prior year based on past sales, while the
study is done the subsequent year based on future sales. Meaning that the 2022 Director’s ratio
will be published in October of 2022 and will measure the sales that took place in the January-
June 2022 sampling period. These sales of course have not taken place yet. While the
reassessment for 2022 employs October 1, 2021 as the date of value and utilizes sales that have
already taken place in 2020 and 2021. Effectively, appreciating markets would likely result in a
ratio under 100%, while depreciating markets would likely result in a ratio over 100%.
2021 has been an extraordinary year for the real estate market as property values surged to
record highs. As anticipated, the dynamic appreciation of property value has affected
assessment accuracy and market predictability statewide and beyond. It should be well
understood that when markets are more volatile (up or down), assessment to sales ratio
deviation; (known as the coefficient of deviation or COD), will be statistically higher. Market
participants tend to make decisions more erratically and emotionally. Low supply causes
bidding wars where a home could end up transacting at a price that is not supported by other
data. Most importantly, when markets move so rapidly, the dataset of sales within the January-
June sampling period will contain sales from various points in time when the market was
dramatically different (i.e. June 2021 sales are significantly higher than January 2021 sales).
Since the sampling period extends the entire timeframe (not accounting for market changes)
the COD measurements are expected to be higher.
While CODs will be higher in both reassessment and non-reassessment districts, the fact
remains that the reassessment districts are better equipped to deal with a higher level of
volatility. Coefficients in static assessment districts will continue to deteriorate each year that
maintenance is ignored. On the other hand, reassessment districts can adjust assessments
accordingly in line with the changing market. Not surprisingly, reassessment districts have
endured the volatile market conditions much better than the non-reassessment districts have.
Moreover, the prognosis for non-reassessment districts is very concerning. Hindered by the
inability to make appropriate adjustments, the accuracy of tax levy distribution will
progressively deteriorate. The reassessment vs non-reassessment statistics displayed in
“Exhibit A-C” display an alarming trend for the static assessment environment.

                                                                                                      3
Director’s Ratio
The Borough of Keyport Director’s Ratio for 2021, as calculated by the Director of the Division
of Taxation, is 92.73%. While the “Director’s Ratio” is a complex calculation, this measurement
is intended to express the typical relationship between assessments and sale prices in a given
municipality. The sampling period used for the Director’s Ratio contains sales that took place
between January and June. It is then blended with the Director’s Ratio from the prior year to
stabilize shared levy impacts. With assessments being set during the pre-tax year (based on
sales that took place during the prior two-year period), it is expected that ratios will be lower
than 100% when markets are appreciating. The opposite would hold true for declining markets.
Typically, real estate markets do not appreciate significant amounts year over year, so little
emphasis was put on this topic in prior reassessment reports. However, the recent market
changes have been exceptional so the calculation is worth noting to provide context to the
declining ratio.

                         General Coefficient of Deviation (COD)
The General Coefficient of Deviation is widely held as the best indicator in determining proper
tax distribution. It is a way to measure how tightly clustered individual assessment ratios are in
relation to the average ratio. A lower COD means more accurate and fair tax distribution. The
COD normalizes ratios to show accuracy within a municipality regardless of what the Director’s
Ratio is in any given year.

The more homogeneous the properties in a municipality are, the lower the COD should be. For
example, a municipality that is comprised of mostly townhouses would be expected to yield
better assessment accuracy than a municipality that is comprised of a complex range of
property types. Through annual reassessments, Monmouth County is showing much lower
CODs compared to historical or statewide data. The same holds true for Somerset County,
which also has reassessment districts.
Despite the complexity of the Borough, the COD has shown great accuracy in reassessment
years. The COD has also been trending to be meaningfully more accurate than historical
coefficients. The Borough’s 2021 COD is 14.35, which pronouncedly illustrates the impact of the
recent and extreme market volatility. By comparison the 2019 and 2020 COD’s were 6.72 and
8.22 respectively. Historically, the static assessment years of 2000-2014, yielded an average
general coefficient of 14.52. While the reassessment years of 2015-2021 yielded an average
COD of 10.79. While a historical comparison is an important measurement, the COD must
continue to be analyzed over time as coefficients can potentially be higher during years like
2021 where the underlying market is more volatile or suffers from lack of supply or demand.

                                                                                                 4
The below line graphs illustrate the General Coefficient of Deviation during the static assessment period
and the annual reassessment period.
2000-2014 KEYPORT General COD
Non-Reassessment Years.
20
18
16
14
12
COD
10
8
6
4
2
0
1998 2000 2002 2004 2006 2008 2010 2012 2014 2016
Year
2015-2021 KEYPORT General COD
Annual Reassessment Years
16
14
12
10
COD
8
6
4
2
0
2014 2015 2016 2017 2018 2019 2020 2021 2022
Year
52022 REASSESSMENT
The central objective of a reassessment is to uniformly produce property assessments that
represent fair market value. Accurate assessments ensure fair distribution of the tax levy. The
intent is for the property owner to pay taxes based on their proportionate share of the total
municipal value. If a home is valued at 1% of the overall municipal value, that homeowner will
be responsible for paying 1% of the total tax levy. Fair and equal distribution of the tax levy is
achieved year over year by maintaining accurate property values through the function of
annual reassessment.
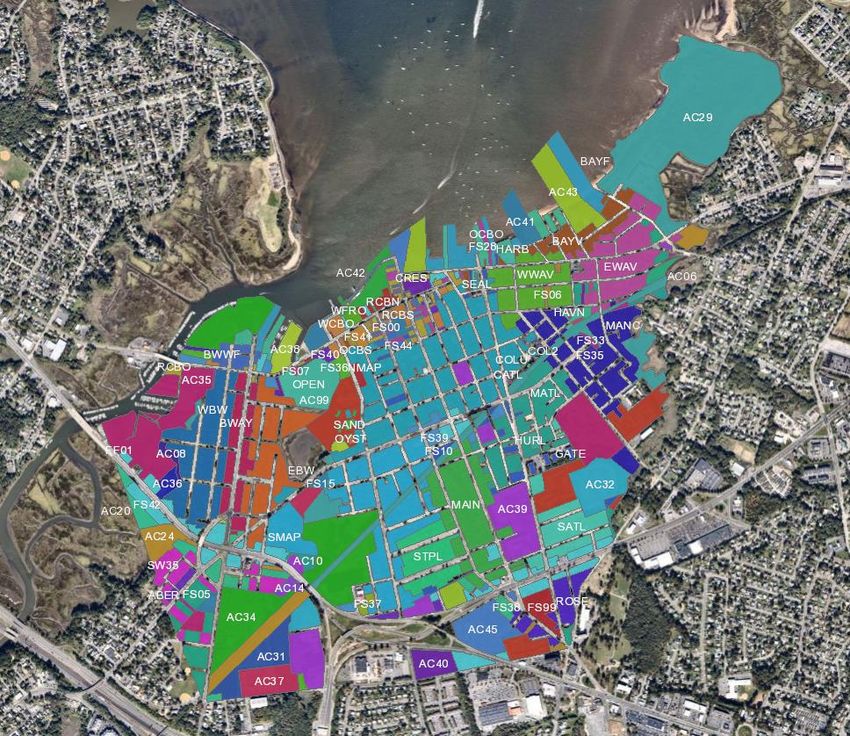
VCS (Value Control Sector) Neighborhood Mapping
6Through the 2022 reassessment, changes to global modeling were made to target market
value. Adjustments were also made to all individual properties, neighborhoods and submarkets
to refine assessment accuracy. The goal is to annually target 100% market value so that the
statistical measurements represent better assessment accuracy.
The primary driver of a reassessment is recent “arms-length transactions”. Pursuant to the NJ
Constitution, properties are assessed for what they would have sold for on October 1 st of the
pretax year. This means that the 2022 reassessment valuation date is 10/01/2021. There were
approximately 162 “usable” sales in the 2020-2021 market analysis.
Colored dot correlates with sales ratio: Red >105%, Blue 95%-105%, GreenWhile the local market has appreciated at significant rates, assessors must view sales data used
in the study in its totality when employing mass modeling techniques. While more recent sales
are certainly given more credibility in the analysis, older sales will still be a stabilizing factor
with annual reassessments. Inevitably, older sales will pull the modeling in the direction that
the market was in the past. With regard to the 2022 reassessment, current sales are much
higher than 2020 and early 2021 sales. Should this market appreciation continue through 2022,
the Division of Taxation Director’s ratio will certainly be lower than the 100% target. We must
recognize that the ratio study is being done with future sales as a part of the January-June 2022
sampling period, while the reassessment analysis is being done with prior sales that took place
during 2020 and 2021. The goal of the reassessment is to react to the market, not predict it.
Strong market trends and low mortgage rates continued to play a role in the surging real estate
prices seen nationally. The pandemic appears to have caused a housing inventory shortage
which drove prices even higher, but the pandemic has also helped usher in the age of the
remote workplace. Home buyers were no longer tethered to the geographical vicinity of their
work place and this has helped improve values in previously untapped markets.
The aggregate value for the Borough of Keyport has increased by approximately 10.83% from
2021. The below chart illustrates the percent change within the Borough of Keyport.
8TAX RATES AND BUDGETS
There are several components that comprise the tax levy. Each component has an individual
budget that must be funded through property taxes. The municipal portion is only one
component of the overall levy and the only component that the Borough of Keyport has control
over. The tax rate is derived by dividing the total amount to be raised through taxation, i.e. the
overall levy, by the total value of the municipality. The below chart shows the 2021 tax rate as
certified by the Monmouth County Board of Taxation.
Monmouth County Board of Taxation
2021 General Tax Rate Certification
Schedule
Rate per
Borough of Keyport Amount $100 Percent
County Budget $1,887,246.96 0.229 9.07%
County Library Budget (N/A)
District School Budget $11,125,227.00 1.353 53.61%
Regional School Budget (N/A)
Local Municipal Purposes $6,999,002.12 0.851 33.72%
Municipal Open Space Fund $205,590.00 0.025 0.99%
Municipal Library Fund $270,248.00 0.033 1.31%
County Health Budget $38,638.80 0.0050 0.20%
County Open Space Fund $226,844.09 0.0280 1.11%
Total Tax Levy on which Tax Rate is
Computed $20,752,796.97 2.524 100.01%
Net Valuation Taxable $822,360,027
9The tax rate and the aggregate municipal value have a semi-proportionate relationship. An
increase in the total value of a municipality can mean a reduction in the tax rate so long as the
percent increase of the overall levy does not exceed the percent increase of the municipal
aggregate value.
Looking forward, there is a realistic expectation that the tax rate will decrease. However, the
impact of assessment appeals on the Borough aggregate and the potential for levy increases
still exists. Thus, the 2022 tax rate won’t be published until after the annual certification of the
levy, which is usually sometime in July.
KP 2015-2022 Aggregate Value
$1,000,000,000
$800,000,000
$600,000,000
Value
$400,000,000
$200,000,000
$0
Year
2015 2016 2017 2018 2019 2020 2021 2022
KP Tax Rate 2015-2021
2.620
2.600
2.580
Tax Rate
2.560
2.540
2.520
2.500
2.480
Year
2015 2016 2017 2018 2019 2020 2021
10Below is the same tax rate and aggregate value data from the bar graphs, but organized into a
simple chart instead. It is important to understand the relationship between them.
Year Total Tax Levy Net Value KB Borough Tax Rate
2015 $17,243,804 $663,989,376 $2.597
2016 $17,644,830 $682,585,290 $2.585
2017 $18,155,199 $696,401,969 $2.607
2018 $18,577,918 $714,535,300 $2.600
2019 $18,883,772 $743,748,398 $2.539
2020 $20,080,290 $789,629,979 $2.543
2021 $20,756,367 $822,360,027 $2.524
2022*
(preliminary
value) TBD $905,421,100 TBD
INSPECTION & DATA COLLECTION
The Borough of Keyport completed its first five-year inspection cycle in 2019. The Borough
posted an RFP for inspection services beginning January 1, 2020 and selected the same vendor
as contracted with for the previous cycle. The current cycle entails 20 percent of the Borough to
be inspected annually from 2020 through 2024. Accurate data collection aides in maintaining
accurate property assessment records year over year. The Covid-19 pandemic was addressed
by inspectors adhering to all social distancing safety measures, mask wearing, and the inclusion
of a “virtual” inspection option via smartphone or tablet. Unfortunately, the pandemic also
delayed the inspection process for many months, resulting in a backlog of municipalities waiting
for the cycle to catch up. Project planning for the 2022 inspection cycle has not been finalized
as of this date. But information about the coming cycle will be posted on the Borough of
Keyport Tax Assessor web page listed below:
https://www.keyportonline.com/assessor
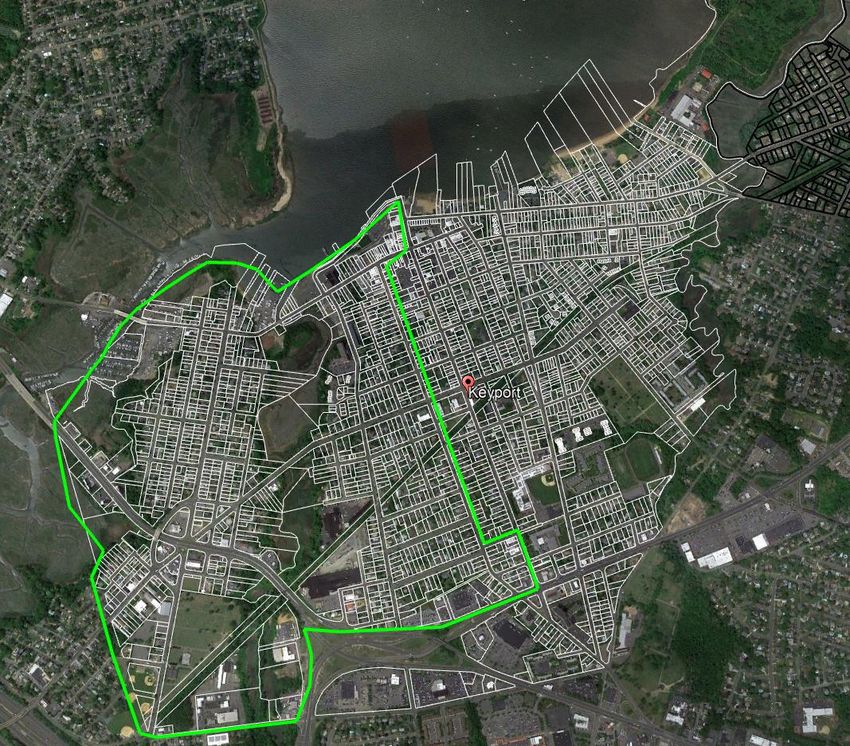
112020-2021 Inspection Zone-Keyport Borough
Properties within the green boundary were scheduled for inspection as part of the 2020 and 2021 cycles.
It is worth noting that there has also been a legislative change to the inspection process.
Previous legislation amended the inspection process to extend the cycle for up to eight years if
needed. This meant lower costs to the municipality and the potential of years where
inspections were not performed at all so long as 100% of the properties in a municipality were
inspected within the 8-year time frame. Meaning that year 6 and year 7 of a cycle could be
“idle” if the municipality has met the 100% requirement in years 1-5. However, the Division of
Taxation has amended the regulation to require all reassessment districts to conform to the
original 5-year inspection cycle.
12The primary goal of the assessment function is to distribute the tax levy fairly and
proportionately. This is achieved by maintaining accurate market-based assessments year after
year through the annual reassessment process. A reassessment is a complex and lengthy
procedure that not only requires extensive data analysis, but also the ability to communicate
that process to taxpayers and municipal officials. It is my hope that this annual publication will
serve as the information hub for reassessment data.
For questions and more information please contact the Borough Assessor Michael Del Re:
Email- mdelre@keyportonline.com
Office-732-739-5134 (Monday 3:30-5:30)
Cell- 908-675-5776 (Anytime)
(Appendix located on the following pages)
13Appendix:
EXHIBIT A
Statewide Comparison of Reassessment vs. Non-Reassessment Districts
Director's Ratio Comparison
(Average Director's Ratio Weighted by Number of Sales per District)
100.00% 94.88%
94.24% 95.82%
94.96%
95.00%
91.75%
Non-Reassessment Municipalities Reassessment Municipalities
90.00%
82.30%
85.00%
80.75%
79.68% 78.97%
80.00%
75.00%
75.52%
70.00%
2017
2018
2019
2020
2021
14EXHIBIT B
Statewide Comparison of Reassessment vs. Non-Reassessment Districts
Coefficient of Deviation (COD) Comparison
(Average COD Weighted by Number of Sales per District)
15.00%
14.31%
14.00%
13.10%
12.50% 12.67% 12.93%
13.00%
12.00%
11.00%
Non-Reassessment Municipalities Reassessment Municipalities
10.00%
9.00%
8.68% 9.50%
8.60%
8.00% 8.39%
7.89%
7.00%
2017
2018
2019
2020
2021
15EXHIBIT C
Statewide Comparison of Reassessment vs. Non-Reassessment Districts
Percent of Group with a Coefficient of Deviation (COD) Over
12%
65% 65%
51%
55%
46%
46%
39%
45%
Non-Reassessment Municipalities Reassessment Municipalities
35%
25%
19%
15% 14%
11% 14%
5%
7%
2017
2018
2019
2020
2021
16You can also read