Breaking the Screen: Interaction Across Touchscreen Boundaries in Virtual Reality for Mobile Knowledge Workers
←
→
Page content transcription
If your browser does not render page correctly, please read the page content below

Breaking the Screen: Interaction Across Touchscreen Boundaries in
                                                          Virtual Reality for Mobile Knowledge Workers
                                                  Verena Biener1      Daniel Schneider1     Travis Gesslein1     Alexander Otte1    Bastian Kuth1
                                                           Per Ola Kristensson3       Eyal Ofek 2      Michel Pahud 2      Jens Grubert1 *

                                                                                   1 Coburg   University of Applied Sciences and Arts 2 Microsoft Research
                                                                                                            3 University of Cambridge
arXiv:2008.04559v1 [cs.HC] 11 Aug 2020

                                                 Figure 1: Mobile knowledge worker applications using a touchscreen in VR implemented in this paper. a: map navigation, b: window
                                                 manager, c: code version control, d: presentation editor, e-f: medical imaging, g-h: information visualization.

                                         A BSTRACT                                                                           The vision of a spatial user interface supporting knowledge work
                                         Virtual Reality (VR) has the potential to transform knowledge work.              has been investigated for many years (e.g. [91, 93]). However, the
                                         One advantage of VR knowledge work is that it allows extending                   recent emergence of consumer VR headsets now make it feasible to
                                         2D displays into the third dimension, enabling new operations, such              explore the design of deployable user interface solutions.
                                         as selecting overlapping objects or displaying additional layers of                 However, while VR is promising for mobile office work it also
                                         information. On the other hand, mobile knowledge workers often                   brings its own additional challenges. For example, mobile workers
                                         work on established mobile devices, such as tablets, limiting interac-           often work in front of touchscreens, such as tablets or laptops. Within
                                         tion with those devices to a small input space. This challenge of a              this work, we propose to extend the limited output and input space of
                                         constrained input space is intensified in situations when VR knowl-              such configurations by utilizing VR head-mounted displays (HMDs).
                                         edge work is situated in cramped environments, such as airplanes                 Specifically, recent HMDs with inside out camera-based sensing
                                         and touchdown spaces.                                                            allow for pose tracking of the user’s head and hands. Through access
                                            In this paper, we investigate the feasibility of interacting jointly          to HMDs cameras, spatial tracking of further objects, such as screens
                                         between an immersive VR head-mounted display and a tablet within                 or keyboards become feasible.
                                         the context of knowledge work. Specifically, we 1) design, imple-                   Given these opportunities, this paper explores how to leverage
                                         ment and study how to interact with information that reaches beyond              the large display area and additional three-dimensional display vol-
                                         a single physical touchscreen in VR; 2) design and evaluate a set of             ume around the user afforded by an HMD while using established
                                         interaction concepts; and 3) build example applications and gather               capacitive touch interfaces provided with tablets and some laptops.
                                         user feedback on those applications.                                                This paper addresses this scenario with the following contribu-
                                                                                                                          tions. First, we explore and evaluate how to spatially arrange and
                                         1    I NTRODUCTION                                                               manipulate information within the joint interaction space of HMD-
                                                                                                                          tablet interaction. Second, we design, implement and evaluate six
                                         Recent progress in virtual reality (VR) technology makes it possible             applications (window manager, code version control, parallel coor-
                                         to provide knowledge workers with a portable virtual office. This                dinates exploration, map navigation, volumetric image viewer, and a
                                         office can provide many potential advantages for mobile work, such               virtual PowerPoint), see Figure 1.
                                         as 1) providing a well-illuminated, private environment with wide
                                         display areas regardless of the physical surroundings; 2) enabling a             2     R ELATED W ORK
                                         virtual recreation of a consistent spatial workspace; and 3) relieving
                                                                                                                          The work in this paper is underpinned by the following research
                                         the user of physical limitations, using large and even distant displays
                                                                                                                          areas: 1) mixed reality (MR) for knowledge work; 2) information
                                         while the user is remaining seated and the hands are resting on a
                                                                                                                          windows in spatial environments; and 3) spatial interaction.
                                         table [39].
                                             * contact
                                                                                                                          2.1    Mixed Reality for Knowledge Work
                                                         author: jens.grubert@hs-coburg.de
                                                                                                                          Recent prior work has begun exploring how to support knowledge
                                                                                                                          work using MR [39, 44, 95]. Early work investigated the use of
                                                                                                                          projection systems to extend physical office environments for inter-
                                                                                                                          action with physical documents (e.g., [54, 87, 93, 121]). VR and AR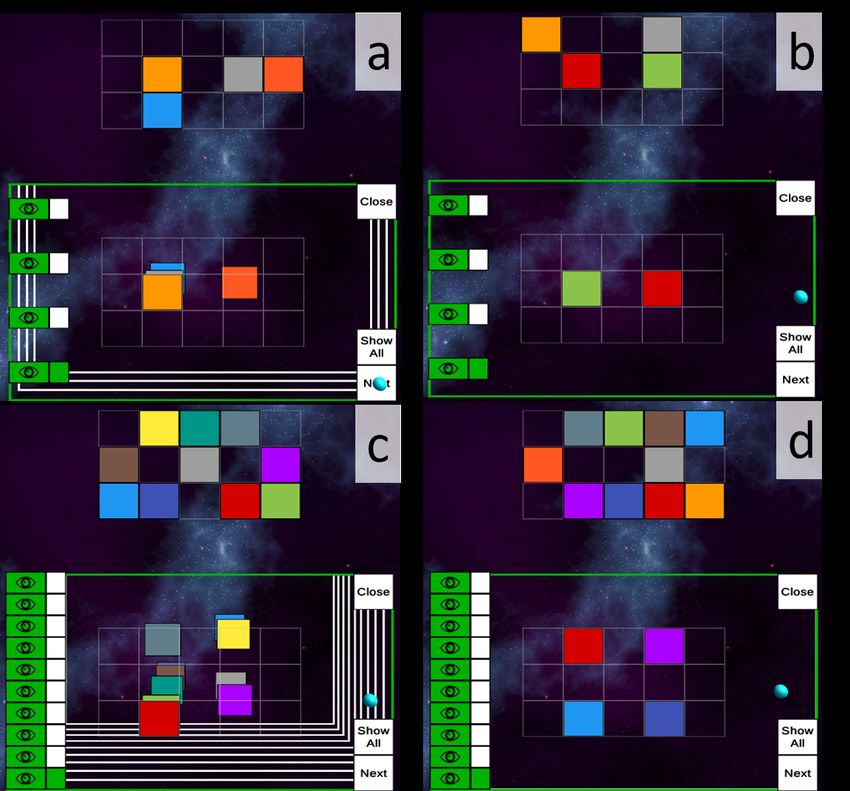
HMDs have also been explored for interacting with physical docu-            2.3    Spatial Interaction
ments (e.g., [36, 62]). Most prior work has focused on annotating
                                                                            A large number of techniques for selection, spatial manipulation,
documents displayed on a 2D surface while this work investigates
                                                                            navigation, and system control have been proposed to support spatial
the use of space surrounding a planar piece of information.
                                                                            user interfaces [57]. Regarding object selection, Argelaguet et al. [2]
    In addition to enhanced document interaction, prior work has            presented a survey on 3D selection techniques. For a recent survey
also explored remote presence applications (e.g., [82, 91]). There          on 3D virtual object manipulation, we refer to Mendes et al. [72].
is a number of publications investigating the use of VR in desktop-         Finally, recent surveys [14, 38] have extensively reviewed spatial
based environments for tasks such as text entry (e.g., [41, 53, 70]),       interaction across mobile devices, mostly in non-VR settings.
system control [131, 132] and visual analytics [119]. Büschel et              In addition to unimodal techniques the combination of touch
al. [15] surveyed a wide range of immersive interaction techniques          with mid-air has attracted attention from researchers. For example,
for visual analytics. Previous research on productivity desktop-            outside of VR, Müller et al. [75] investigated the use of touch and
based VR has concentrated on the use of physical keyboards [98],            mid-air interaction on public displays, Hilliges et al. [46] studied
controllers and hands [55, 132], and, recently, tablets [110]. The          tabletop settings. Several researchers have proposed to use handheld
closest work to this paper is by Surale et al. [110], which focuses on      touchscreens in spatial user interfaces for tasks such as sketching,
spatial manipulation and creation of 3D objects. In contrast, we use        ideation and modeling (e.g., [3, 23, 25, 33, 48, 90]), navigation of
the tablet for information management on virtual displays.                  volumetric data [105], 3D data exploration [65] and system control
    Complementary to this prior research, this paper aims to support        [10]. Spatial manipulation has mostly been studied in single-user
mobile knowledge workers by extending commonly used tools such              settings (e.g., [5, 51, 63, 68, 74, 110, 111]) but also in collaborative
as tablets and notebooks through HMDs.                                      settings [35].
                                                                               Evolving from the magic lens [7] and tangible interaction con-
                                                                            cepts [116], tangible magic lenses allow users to access and manip-
2.2   Information Windows in Spatial Environments                           ulate otherwise hidden data in interactive spatial environments. A
In 1993, Feiner et al. [31] introduced head-surrounding and world           wide variety of interaction concepts have been proposed within the
reference frames for positioning 3D windows in VR. In 1999, Mark            scope of information visualization (e.g., recent surveys [113, 114]).
Billinghurst and Thad Starner [8] introduced the spatial display            Both rigid shapes (e.g., rectangular [106]) or circular [107] and
metaphor, in which information windows are arranged on a virtual            flexible shapes (e.g., [108]) have been used, as well as various dis-
cylinder around the user.                                                   play media (e.g., projection on cardboard [17, 106]), transparent
                                                                            props [12, 97], handheld touchscreens [40, 59], or virtual lenses
    Since then, virtual information displays have been explored in          [64, 81]. In addition, the combination of eye-gaze with other modali-
various reference systems, such as world-, object-, head-, body- or         ties such as touch [84, 85], mid-air gestures [86, 96, 100] and head-
device-referenced [57]. Specifically, interacting with windows in           movements [56, 102, 103] has been recently investigated for inter-
body-centered reference systems [118] has attracted attention, for          action in spatial user interfaces. For a recent survey on gaze-based
instance to allow fast access to virtual items [19, 61], mobile multi-      interaction in AR and VR, see Hirzle et al. [47].
tasking [27, 29] and visual analytics [28]. Gugenheimer et al. [43]
                                                                               We draw on these rich sources of interaction ideas and adopt tech-
introduced face touch, which allows interacting with display-fixed
                                                                            niques in the context of VR interaction with touchscreens for mobile
user interfaces (using direct touch) and world-fixed content (using
                                                                            knowledge workers. Our work complements multimodal techniques
raycasting). Yu et al. [128] investigated the use of body motions for
                                                                            combining touch and mid-air [46, 75], gaze-based techniques [84]
switching interfaces in VR. Lee et al. [58] investigated positioning
                                                                            and ideas for combining HMDs with touchscreens [37, 80, 130]
a window in 3D space using a continuous hand gesture. Petford et
                                                                            through novel techniques for accessing virtual windows around or
al. [83] compared the selection performance of mouse and raycast
                                                                            behind a physical touchscreen.
pointing in full coverage displays (not in VR). Recently, Jetter et
al. [50] proposed to interactively design a space with various display
form factors in VR. Wagner et al. proposed a desk metaphor for              3     D ESIGN S PACE
controlling visual analytics that reappropriates a physical desk in         Currently most knowledge workers’ applications are designed for
VR [119].                                                                   2D displays, which are the vast majority of displays in the world. VR
    Prior work has also explored how to support user interaction            and AR displays enable mobile workers to take their displays with
across HMDs and mobile and wearable touch displays. Grubert et              them on the go. In addition, since HMDs are stereoscopic, they en-
al. [37] presented body-aligned, device-aligned, and side-by-side           able information presentation beyond the 2D display and the ability
modes for interacting between a touch display (smartphone or smart-         to manipulate this information by spatial manipulation. Researchers
watch) and an optical see-through HMD. Similar explorations have            have already proposed various schemes for arranging (planar) infor-
followed suit using video-see-through HMDs [80], an extended set            mation in a spatial context relative to the user. Specifically, prior
of interaction techniques [130], using smartwatches [66, 122, 125],         work has proposed various reference systems, such as world-, object-
or with a focus on understanding smartphone-driven window man-              , head-, body- or device-referenced [9], spatial window layouts in
agement techniques for HMDs [94]. In a similar vein, prior work             these reference frames, for example, scaffolding geometry such as
has studied the interaction across HMDs and stationary displays,            spheres or cylinders [27, 28], and input modalities to access and
such as tabletops [16, 92, 101].                                            manipulate information in these spaces (such as touch, gaze, mid-air
    Most prior work relate to the issue of field of view, that is, how to   interaction or multimodal interaction, c.f. [15, 47, 118]).
display and access more information by spreading it around the user            The guiding principle in this paper is that an information touch-
in multiple windows. In this research, we are additionally interested       screen display can break out of the screen in VR and transition
in extending the information display in the depth direction. Such a         from 2D to 3D—yet still be controlled by manipulating the original
display is suited for displaying different views of information (or         touchscreen. This is in part motivated by prior work reviewed in the
layers) that are semantically connected by their 2D location. On the        previous section and in part motivated by the fact that a touchscreen
other hand, we use a very limited input space: While most referred          allows the user to provide precise 2D input while displaying infor-
prior work span all the angular range of the display as an input space,     mation in an HMD provides the ability to display information in 3D.
we only use the interaction space on or near the tablet in order to         This screen-centric manipulation using touch can be complemented
support interaction in constrained physical spaces [39, 71].                with additional modalities, such as gaze tracking.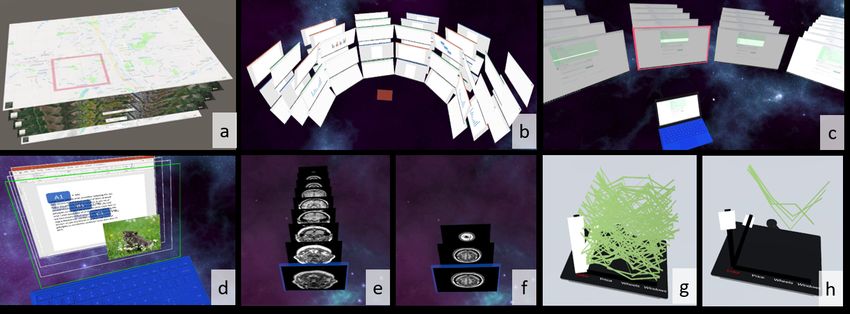
Two important aspects arising in this context are how to spatially     this CD gain along with values of 1 cm and 3 cm in an informal user
arrange information relative to the touchscreen and how to map the        study with five participants and found that 2 cm was the fastest and
input from the physical touchscreen to the information in the virtual     preferred by three participants while the other two CD gains were
world, given the joint input capabilities of 2D touch sensing (on the     only preferred by one participant each.
screen) and 3D spatial manipulation (around the screen).                     As VR headsets also support head-pointing and partially eye-gaze
                                                                          tracking we implemented a second technique: combined gaze and
3.1     Spatial Arrangement                                               touch interaction. Inspired by previous work on combining gaze
Prior work has investigated options on how to align multiple 2D           and manual pointing [84, 129], we devised a technique in which
information windows around the user (e.g., [27, 29]). One com-            the combined head and eye gaze provides the context for touch
mon approach is to arrange windows on a scaffolding geometry,             interaction, see Figure 2, d. With this technique regions of interest
such as spheres or cylinders [8](see Figure 2, b-d). In a spatially       are discrete (the individual virtual screens). Hence, when a user
unconstrained environment, accessing this information is often re-        gazes at a specific window, the cursor is transferred to that new
alized using virtual hand or raycasting techniques. While using           screen, maintaining the same absolute position in the new screen as
such extended display areas is possible, we should be aware that in       in the old screen (i.e., the same (x, y) coordinate).
constrained spaces, such as on an airplane or in touchdown spaces,           In order to avoid unwanted cursor movements it is possible to
it may not be usable for interaction as ample spatial movements can       use temporal thresholding (e.g., 200-300 ms [84, 129]), although we
be unsuitable either due to social acceptability [1, 123] or simply       did not use this in our evaluation in order to allow for faster task
due to lack of physical space to operate [39, 71].                        completion times. To allow selection of items at the screen boundary,
   An alternative display option is extending information along with      we use spatial thresholding with an empirically determined threshold
the depth of the screen, extruding it into 3D (see Figure 2, a). This     of 5% of the window size in all directions. Specifically, to switch
extrusion might be specifically suitable for additional information       from one screen to another, the user first has to move their eyes
that is directly related to the document displayed on the physical        beyond the second display boundary by that threshold. While we did
screen. This information is often semantically different and should       not evaluate this threshold parameter in a formal user study, internal
ideally be displayed separately from the main screen but with a           testing revealed that this threshold circumvents unwanted display
spatial relation (specifically with corresponding x- and y-coordinates)   switches and still allows for comfortable switching between display
to the document. For example, when reviewing a document, a                boundaries.
common task consists of inserting comments. However, there is                For both techniques, interacting with the now active virtual dis-
no natural space for the added comments within the document, and          play can either 1) happen at the original location of the display,
adding them in place can disrupt the layout of the document. Adding       essentially turning the touchscreen into an indirect input device;
the comments in a separate layer, hovering in front of the main           or 2) occur by aligning the virtual display with the physical touch-
document, maintains the contextual relevance while enabling the           screen. For example, dragging the finger on the bottom bezel of
user to focus on the layer of interest.                                   the touchscreen (or using a two-finger swipe) can rotate virtual
                                                                          windows around the x-axis of a scaffolding geometry (either display-
3.2     Input-Output Mapping                                              by-display in discrete steps or continuously).
The touchscreen allows one layer of information at a time to align
with the surface of the screen. This layer enjoys the easiest and most    3.2.2   Depth Interaction
accurate input, as the screen supports the user’s hand and enables the    Accessing virtual displays along the depth dimension of the touch-
highest positional sensing, and, sometimes, pressure sensing. Next,       screen can happen either in front, on, or behind the physical screen
we discuss, how to access layers of information that break out of the     (see Figure 2, a). For virtual displays in front of the screen, direct
bounds of the physical screen.                                            mid-air selection might be used, but this may cause occlusion of
                                                                          content at layers further away and hinder interaction on the physical
3.2.1    Around the Screen Interaction                                    screen [13]. Accessing content behind the screen has to take into
One challenge when interacting across screens is how to support           account the physical presence of the touchscreen, preventing direct
both fine-grained selection on an active screen as well as efficient      access using virtual hand techniques. Users would either need to
switching between screens. Naive implementations that use a fixed         grab behind the screen using a virtual hand or use raycasting tech-
control-to-display gain (CD gain), such as stitching or pointer warp-     niques that can handle object occlusion (e.g., [30]). Instead, we
ing for bridging the space between displays [77, 120, 126], do not        propose to use the touchscreen to select a desired virtual display.
scale well to large displays due to the required trade-off between        Depending on the number of virtual displays spread behind or in
high precision pointing in a given region of interest on a display        front of the physical screen, different mappings can be appropri-
and fast switching between multiple regions of interest [78]. Hence,      ate. We experimented with swiping along the bezel of the screen
besides raycasting, prior work has proposed multiple strategies for       and two-finger swipe gestures, commonly available on multi-touch
controlling a large output space using a small input space on a           trackpads. Depending on the number of layers an absolute mapping
touchscreen (e.g., [32, 69, 78, 79]).                                     for quick random access to layers or a relative mapping for navigat-
   Inspired by those techniques, we propose using a bimanual selec-       ing between adjacent layers might be appropriate. In an informal
tion technique for allowing both precise input and efficient switching    user study with three users, we found that swiping with two fingers
of the active window. This way, the user can move a cursor and            outperformed bezel swipes and a relative mapping outperformed
select or deselect items inside the active window by simply using         an absolute mapping for four and ten layers. Hence, we used this
the tablet as a touchpad with a suitable CD gain for single screen        input mapping for the further development of the applications. We
interaction, see Figure 2, b. If the user touches the bezel of the        used the same CD gain as for switching between individual screens
touchscreen, which has a width of 2 cm, with their non-dominant           spread around the active screen, as described above.
hand, a coarse CD gain is activated to enable fluid switching between         While the input technique allows to quickly switch between layers
multiple windows, see Figure 2, c.                                        it does not completely resolve potential occlusion issues. Occlusion
   The CD gain for single screen interaction is a one-to-one mapping      can be mitigated (but not completely resolved) utilizing parallax if
of the movement on the touchscreen. The CD gain for switching             the user moves the head. We experimented with two visualization
between multiple windows is set in such a way that the user has to        techniques to further mitigate potential occlusion. One option is
move their finger 2 cm to switch to the next screen. We evaluated         to amplify the parallax effect when moving the head to the side of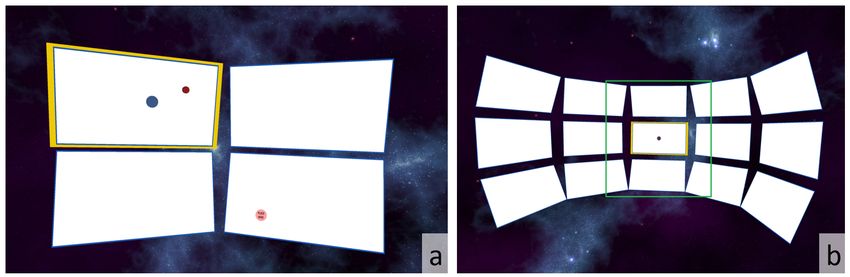
Figure 2: a: Virtual displays (grey) arranged relative to the physical screen (green): behind (1), with (2), in front of (3). b and c: Changing between
pointing on a single screen and switching between screens using a bimanual technique. b: If only a single finger is used on the touchscreen (filled
green rectangle), it controls the cursor on the active screen (green boundary) with a suitable control-display gain. c: The screens are switched
by pressing with a finger of the non-dominant hand on the bezel of the touchscreen and moving the finger of the dominant screen towards the
second screen (in this case the right screen) using a second CD-ratio. d: Changing between pointing on a single screen and switching between
screens using a combination of touch and gaze. The finger on the touch screen (filled green rectangle) controls the cursor on the active screen
(green boundary). Gaze provides the region of interest. If the user gazes to the side, up or down, the corresponding screen gets activated (with
appropriate temporal and spatial thresholds).

the screen, see Figure 7, f. Another option, inspired by explosion
diagrams, is to temporarily scatter virtual screens around the physi-
cal screen, see Figure 7, e. While the explosion diagram technique
allows the user to view all layers simultaneously and unoccluded,
the number of concurrently visible layers is constrained by the avail-
able screen space. Also for both techniques, potential dependencies
between layers are impacted (e.g., when there is a need for carefully
arranging multiple graphical elements into a composite image). An-
other limitation of the explosion diagram technique is the reduction
of the ability to associate different objects between different layers         Figure 3: Arrangements of the virtual screens for the CONTENT TRANS -
based on their common 2D locations.                                            FER TASK. a: FOUR SCREENS: the blue dot can be acquired by the red
                                                                               cursor in the upper left screen and is to be placed on the goal in the
3.2.3   Single Screen Interaction                                              lower right screen. b: FIFTEEN SCREENS: the green border indicates
                                                                               the field of view of the user.
Even an individual layer that is aligned with the physical screen does
not need to retain its physical bounds. The ability to display the
view frustum according to the rotation of the user’s head enables a            benefits of viewing multiple stacked information layers in-depth
virtual display that potentially spreads over a very large angular part        behind a touchscreen compared to only showing a single layer at a
of the user’s field of view. It enables the simulation of screens that         time as is common in many applications today. While adding depth
may be bigger than physical screens available to the user (see Figure          cues has been indicated to improve task performance in various
7, d). In this case, the mapping of the input space of the physical            settings [6, 88, 89, 104], we aimed at quantifying any performance
touchscreen can become indirect. For example, it is possible to                improvement within the scope of the joint tablet-HMD interaction.
use a different CD gain for absolute mapping of the physical finger                Hence, we investigated those two aspects in a user study. In the
position to the virtual finger position (following ideas from haptic           first part (subsequently called the C ONTENT T RANSFER TASK), we
retargeting [4, 20]), see Figure 7, or the touchscreen can be operated         compared the performance of the bimanual selection technique with
using a relative mapping. In some cases, it might be desirable to              the COMBINED GAZE AND TOUCH INTERACTION technique in a
retain a direct mapping between the input and the output space. In             content transfer task for a small and large number of screens.
this case, only the portion co-located with the physical touchscreen
                                                                                   In the second part (subsequently called the P UZZLE TASK), partic-
allows interactivity. Changing this active input area can either be
                                                                               ipants were asked to solve a puzzle task where each puzzle piece was
realized by two-finger swipes or input on the bezels of the screen
                                                                               displayed in an individual layer, mimicking tasks when composing
(analogous to implementations in desktop sharing applications, such
                                                                               presentations using multiple shapes or images using multiple layers
as TeamViewer) or by redefining the active area by gaze (again
                                                                               in an image editing application. Note that we used the baseline
requiring an appropriate clutch mechanism).
                                                                               technique described in Section Depth Interaction without amplified
                                                                               parallax or explosion diagram visualization due to the nature of
4   E VALUATION     OF   D ESIGN PARAMETERS                                    the task having strong spatial dependencies between the x- and y
While we designed the techniques following an iterative approach               position of the individual puzzle pieces.
with multiple design iterations consisting of conceptualization, im-               For the CONTENT TRANSFER TASK, we followed a 2 × 2 within-
plementation, and initial user tests (eating your own dog food)                subjects design. The first independent variable was I NTERACTION
[24, 117], we aimed to understand properties of the proposed in-               T ECHNIQUE for selecting the screens, which was done either G AZE -
teraction space in this paper in more detail. Within the proposed              BASED or B IMANUAL as described above. The second indepen-
interactive space, users can both extend the display area around the           dent variable was N UMBER OF S CREENS presented to the partici-
current display on a two-dimensional proxy geometry as well as                 pant which was either F OUR S CREENS (Figure 3, a) or F IFTEEN
in-depth in front or behind the physical touch screen. For the eval-           S CREENS (Figure 3, b). We chose these configurations to better
uation, we investigated these two properties (around and in-depth)             understand the performance of the techniques in presence of a few
separately.                                                                    or many screens while still considering the field of view that can be
   To this end, we first aimed at exploring, if using combined touch           comfortably covered when the user turns their head. This experimen-
and gaze interaction has benefits over touch-only interaction when             tal design results in four different conditions, which are depicted in
interacting across multiple virtual screens arranged on a proxy ge-            Figure 3. Dependent variables included tasks completion time (the
ometry around the touchscreen. Second, we wanted to quantify the               duration from acquiring the content in one screen to placing it at the
marked spot in another screen), accuracy (measured as Euclidean
distance between the released item and the actual target location),
usability as measured by the System Usability Scale (SUS) [11],
workload as measured by NASA TLX (unweighted version) [45],
simulator sickness (SSQ) [52] as well as user preferences. We hy-
pothesized that the G AZE - BASED would outperform B IMANUAL in
terms of task completion time, usability and workload, but not in
terms of simulator sickness or accuracy (as the final movements were
conducted with the finger of the dominant hand in both techniques).
   For the P UZZLE TASK, we also followed a 2 × 2 within subjects
design. The independent variables were V ISUALIZATION with two
levels: F LAT, a baseline condition in which all layers were displayed
at the same depth, see Figure 4, b and d, and D EPTH, where each
layer was displayed with increasing z-distance, see Figure 4, a and c.
The second independent variable was N UMBER OF L AYERS with
two levels: F OUR L AYERS with four layers displayed (Figure 4, a)
and T EN L AYERS in which ten layers were displayed (Figure 4, c).
This was done to investigate if an increasing number of layers has
an effect on the performance of the visualization techniques.
   As can be seen in Figure 4, the active layer is highlighted with a
green frame, the user’s fingertip is visualized with a turquoise sphere.
The target arrangement is shown above the puzzle’s layered display
as a flat image. To the left of the layered display there is an overview
widget, inspired by similar views in image editing applications.           Figure 4: Conditions for the P UZZLE TASK. a: D EPTH with F OUR
The eye symbol toggles the visibility of the respective layer (green:      L AYERS, b: F LAT with F OUR L AYERS, c: D EPTH with T EN L AYERS, d:
visible) and the rectangles to the right of the eye symbol allow direct    F LAT with T EN L AYERS.
selection of a layer (green: active layer, white: inactive layer). By
selecting a layer (pressing on the green square associated with it),       was used as VR HMD with built-in eyetracking. For touch input a
the system moved this layer to align with the screen depth and made        Huawei Media Pad T5 was used (screen diagonal 10.1 inches, 16:10
all layers in front of it transparent, thereby maximizing the current      aspect ratio). Velcro was attached to the left, right and bottom bezel
layer visibility. Switching between two adjacent layers can also be        of the tablet to support participants in identifying the touchscreen
achieved by swiping vertically with two fingers on the touchpad.           boundaries. The tablet was placed on a table in front of the partici-
The button “Show All” collapses all layers into a single layer and         pant in such a way that participants sitting in front of it on a chair
activates the visibility of all layers. The button “Next” switches to      could comfortably use it. The system was implemented in Unity
the next task. The button “Close” was only visible during training         2019.3 and deployed on a PC with windows 10, an AMD Ryzen
and allowed participants to end the training session when they felt        Threadripper 1950X 16-core processor with 3.4 Ghz, two Nvidia
comfortable with conducting the task.                                      GeForce RTX 2080 graphics cards and 64 GB RAM in Europe
   The dependent variables were, as in the C ONTENT T RANSFER              and on a PC with Intel Core i9-9980HK 8-core processor, Nvidia
TASK , task completion time, usability (SUS), workload (TLX) as            GeForce RTX 2080 graphics card, 16 GB RAM in the US.
well as simulator sickness (SSQ). In addition, the system logged the          An OptiTrack V120 Trio tracking system was used for spatial
number of incorrectly placed puzzle items. While we hypothesized           tracking of index finger tips by using two rigid bodies with retro-
that D EPTH would outperform F LAT in terms of task completion             reflective markers attached to them. Note that motion trajectories
time due to the added depth cues, we were specifically interested in       of the fingers were logged for comparative analysis in future ex-
quantifying this difference. We also hypothesized that D EPTH would        periments only, they were not analyzed within the scope of this
lead to significantly higher usability rating and lower workload           paper. The Vive Lighthouse tracking system was used to track the
compared to F LAT with no difference in simulator sickness. We still       VR HMD and the tablet. However, while the position of the tablet
included SSQ to check if severe symptoms would occur.                      could have been changed by the participants during the experiment,
                                                                           no participant chose to do so. The study setup is shown in Figure 5.
4.1   Participants                                                            For the C ONTENT T RANSFER TASK, multiple screens were
                                                                           placed around the participant’s head as shown in Figure 3, a and b.
We recruited 14 participants (5 female, 9 male, mean age 30.07             The virtual screen size was 24 inches and virtual screens were ini-
years, sd = 10.59, mean height 176.57 cm, sd = 8.54). All of them          tially placed at a distance of 90 cm around the participant’s head (if
indicated prior VR experience. Four participants used head mounted         the participant moved their head forwards or backwards this distance
VR devices very frequently, two often, four sometimes, three rarely        changed). The horizontal angle spanned by the screens was at most
and one only once. One participant indicated she does not play video       190 degrees and the vertical angle less than 30 degrees upwards and
games, two rarely, four participants sometimes, three participants         less than 35 degrees downwards. This allowed the participant to
often and four participants very frequently. Seven participants wore       comfortably look at all screens. The cursor position was indicated as
contact lenses or glasses with corrected to normal vision. Eleven          a disc with a diameter of 2.5 cm. For the present study, we chose to
participants were right handed while three were left handed. All           use no temporal threshold in order to obtain a comparable switching
but one used their dominant hand to control the cursor and their           effect between both techniques.
non-dominant hand on the bezel. Thirteen participants used their              The P UZZLE TASK used the same screen size and the same dis-
index finger on the touchscreen and one used her middle finger.            tance to the participant. The individual layers were placed 2.5 cm
                                                                           apart (this parameter was determined empirically).
4.2   Apparatus
The experiment took place in two locations: a laboratory environ-          4.3 Tasks
ment in Europe and a home in the US. The study setup (except the           For the C ONTENT T RANSFER TASK several windows were placed
PC) was replicated in both environments. A HTC Vive Pro Eye                in a circle around the participant’s head. Then they had to select a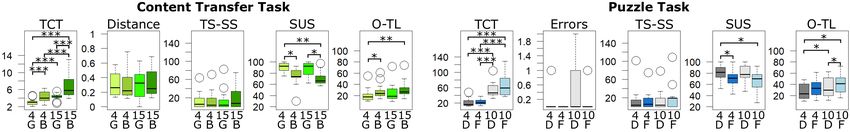
4.5     Results
                                                                           Statistical significance tests for log-transformed target acquisition
                                                                           time was carried out using general linear model repeated mea-
                                                                           sures analysis of variance (RM-ANOVA) with Holm-Bonferroni
                                                                           adjustments for multiple comparisons at an initial significance level
                                                                           α = 0.05. We indicate effect sizes whenever feasible (η p2 ).
                                                                              For subjective feedback, or data that did not follow a normal
                                                                           distribution or could not be transformed to a normal distribution
Figure 5: The study setup. a: setup with motion tracked tablet,            using the log-transform (such as errors), we employed the Aligned
fiducials for the fingers and HTC Vive Pro Eye to the right. The           Rank Transform [124] before applying RM-ANOVAs.
lighthouse systems were placed on the ceiling around the table and            The analysis of results did not reveal significant differences be-
the Optitrack system on a bar above the table. The monitor, keyboard       tween the participant pool in the US and the one in Europe. Hence,
and mouse to the left were operated by the experimenter to start           we will solely report the joint results.
individual conditions. b: Participant during the study.
                                                                              Due to logging errors in the C ONTENT T RANSFER TASK, we only
disk with a diameter of about 4 cm on one screen to a target area          obtained data from 31 instead of 32 tasks. For one participant we
with the same diameter on another screen as shown in Figure 3 a.           only received about half of the data in one G AZE - BASED condition
The window with the next target area was randomly selected while           due to technical problems. Four values for the distance between
making sure that both small and longer distances were included             goal and disc were excluded, because they were much higher than
during the condition. The disk and the target area appeared at one         should be possible when successfully placing the disc. Note that
of eight randomly selected places around the center of a window.           slightly fewer values for some participants should not affect the
Both INTERACTION TECHNIQUEs used the tablet as a touch pad to              overall results as we always used the mean performance for each
control the cursor within the active screen and to grab and release        participant in each condition.
the dot via long-press. After successful placement of the disk onto           The results in the following sections can be summarized as fol-
the target area (with at least a partial overlap of the two), the task     lows: For the C ONTENT T RANSFER TASK, participants acquired
was repeated with a different arrangement of start and target areas.       targets significantly faster with the G AZE - BASED method compared
   For the PUZZLE TASK, participants were asked to arrange puzzle          to B IMANUAL (ca. 30%) and the GAZE - BASED resulted in signif-
pieces (5 × 5 cm) as indicated by a template image, see Figure 4.          icantly higher SUS ratings. No significant differences regarding
Each puzzle piece was placed on a separate layer. The puzzle pieces        accuracy, number of errors or simulator sickness ratings were de-
snapped into a predefined 5 × 3 grid to facilitate accurate placement.     tected between conditions. All but one participant preferred the
                                                                           GAZE - BASED technique.
   Participants were asked to advance to the next puzzle if they felt         For the P UZZLE TASK, participants performed the task signifi-
they had completed the task. The task was then repeated with a             cantly faster with D EPTH visualization compared to F LAT (approxi-
different template.                                                        mately 15 %) but also made significantly more errors. The D EPTH
                                                                           visualization resulted in significantly lower mental demand and re-
4.4   Procedure                                                            sulted in a significantly higher usability rating compared to F LAT.

After an introduction, participants were first asked to fill out a demo-   4.5.1    Performance
graphic questionnaire. Then the HTC Vive Pro Eye eye-calibration           For the C ONTENT T RANSFER TASK there was a significant main
procedure was performed to ensure a working eye-tracking calibra-          effect of I NTERACTION T ECHNIQUE for task completion time, such
tion for each participant. Thereafter the participants either started      that the G AZE - BASED method (M = 3.70 s, SD = 0.98) resulted
with the C ONTENT T RANSFER TASK or the P UZZLE TASK (coun-                in a shorter task completion time than the B IMANUAL method
terbalanced). For both tasks, the conditions were ordered using a          (M = 5.49 s, SD = 2.33). As expected, the main effect of the
balanced Latin square. This resulted in four permutations which            N UMBER OF S CREENS on the task completion time was also sig-
could not be equally distributed among 14 participants. However,           nificant such that F OUR S CREENS (M = 3.66 s, SD = 1.20) re-
no significant order effects were detected. For each condition in          sulted in a shorter task completion time than F IFTEEN S CREENS
the C ONTENT T RANSFER TASK, participants performed a train-               (M = 5.52 s, SD = 2.20). This was predictable because moving the
ing phase where they completed ten content transfers. After that,          target across multiple columns and rows takes longer than moving it
they performed the actual task 32 times. The number of repetitions         only across two columns and rows. There was no significant interac-
was chosen so that each distance and orientation in the F IFTEEN           tion effect between I NTERACTION T ECHNIQUE and N UMBER OF
S CREENS condition appeared once (1–4 screens horizontally × 1–2           S CREENS with respect to task completion time. There was no sig-
screens vertically × two directions each = 8 × 2 × 2 = 32). For            nificant differences between the conditions for accuracy in placing
each condition in the P UZZLE TASK, participants also performed            the target on the goal. The performance results for the C ONTENT
a training phase where they completed puzzle tasks until they felt         T RANSFER TASK can be seen in Figure 6 and the results of the
comfortable (most users only conducted one practice task). There-          RM-ANOVA in Table 1.
after, they performed the actual puzzle task ten times per condition.         For the P UZZLE TASK there was a significant main effect of V I -
In both tasks, after each condition, participants completed the SSQ,       SUALIZATION for task completion time such that the D EPTH method
SUS and NASA TLX questionnaires. At the end of each block they             (M = 37.17 s, SD = 22.79) resulted in a shorter task completion time
also answered a questionnaire about their preferences and partici-         than the F LAT method (M = 43.31 s, SD = 29.52). As expected, the
pated in a semi-structured interview. Finally, the participants were       main effect of N UMBER OF L AYERS for task completion time was
thanked and compensated with voucher worth 10 Euro.                        significant such that the F OUR L AYERS (M = 21.28 s, SD = 8.87)
   For the C ONTENT T RANSFER TASK, we collected 32 repetitions            resulted in a shorter task completion time than T EN L AYERS
× 4 conditions × 14 users = 1792 data points for the performance           (M = 59.19 s, SD = 24.23). No significant interactions have been
data and 4 conditions × 14 users = 56 data points for the subjective       found between N UMBER OF L AYERS and V ISUALIZATION. Analy-
feedback. For the P UZZLE TASK, we collected 10 repetitions × 4            sis of the error data (using the total number of errors across all ten
conditions × 14 users = 560 data points for the performance data and       repetitions) indicated that both the N UMBER OF L AYERS and the
4 conditions × 14 users = 56 data points for the subjective feedback.      V ISUALIZATION method had a significant impact on the number of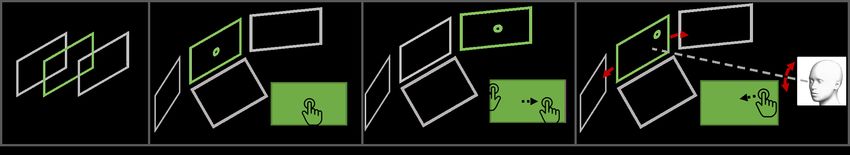
errors made. The conditions using the D EPTH method (M = 0.29,            also liked G AZE - BASED more for F IFTEEN screens. When asked
SD = 0.6) had significantly more errors than the conditions using the     which interaction method the participants perceived as faster, all
F LAT method (M = 0.07, 0.26). Furthermore, conditions with F OUR         participants chose G AZE - BASED. When asked which method they
L AYERS (M = 0.04, SD = 0.19) resulted in significantly fewer errors      could interact with more precisely, all participants chose G AZE -
than conditions with T EN L AYERS (M = 0.32, 0.61).                       BASED for the conditions with F IFTEEN S CREENS . However, in
4.5.2 Simulator Sickness, Workload, Usability                             the condition with F OUR S CREENS, only four participants thought
For the C ONTENT T RANSFER TASK we found that the Total Severity          that G AZE - BASED allowed for a more precise interaction and three
aspect of the Simulator Sickness Questionnaire was significantly          participants felt that B IMANUAL was more precise. This is also
influenced by the I NTERACTION T ECHNIQUE such that BIMANUAL              supported by the objective measurements shown in Figure 6, even
(M = 14.43, SD = 20.73) resulted in a higher total severity than          though no significant difference between conditions was indicated
GAZE - BASED (M = 13.35, 20.57). Also the Oculo-motor aspect was
                                                                          for distance to the target. We conjecture that these differences are
lower for the GAZE - BASED than for the BIMANUAL. However, the            due to the fact that in the GAZE - BASED method the selection of
values are very low and pairwise comparisons showed no significant        the target screen, and moving to the target within the screen, can
differences. There was a significant difference for the overall TLX       happen concurrently. In contrast, in the B IMANUAL condition the
results, such that B IMANUAL resulted in a higher taskload than           selection of the target screen is always separated by an explicit mode
G AZE - BASED. Also the mental, physical, effort and frustration          switch (raising the finger of the non-dominant hand from the bezel)
results of the TLX were significantly higher for the B IMANUAL            from the subsequent phase of moving towards the target within that
conditions than for the GAZE - BASED conditions. The perceived            screen. The lower precision in the B IMANUAL condition with F IF -
                                                                          TEEN S CREENS compared to F OUR SCREENS might also be due
performance of the participants, however, was significantly higher
for the B IMANUAL method (M = 27.14, SD = 19.31) compared                 to higher fatigue when moving the item across more screens. The
to the G AZE - BASED method (M = 21.79, SD = 21.65). This is in           participant who preferred B IMANUAL explained that it reminds him
contrast to the findings of the task completion time and distance to      of the keyboard (alt+tab). Most other participants explained their
goal shown above, where task completion time was significantly            preference for G AZE - BASED due to it being faster. One participant
shorter for G AZE - BASED, and no significant difference was found in     found G AZE - BASED more intuitive, and another participant found
distance to the goal. Furthermore, I NTERACTION T ECHNIQUE had a          it less fatiguing. One participant suggested a hybrid solution where
significant impact on the SUS score in such a way that the usability of   G AZE - BASED is only enabled when touching the bezel.
the G AZE - BASED method (M = 88.75, SD = 10.26) was higher than              For the P UZZLE TASK, all but one participant preferred the
the usability of the B IMANUAL method (M = 72.59, SD = 13.63).            D EPTH condition. However, one participant preferred F LAT. This
The main results of the three questionnaires are shown in Figure          participant later mentioned having trouble focusing the right eye
6. Plots and detailed results on the further dimensions of simulator      and therefore found it more difficult to match the 3D state with the
sickness and task load can be found in the supplementary material.        2D target. Two participants thought the F LAT visualization was
   For the P UZZLE TASK, the results of the simulator sickness ques-      faster for F OUR L AYERS than the D EPTH visualization. All other
tionnaire indicated that VISUALIZATION had a significant impact           participants felt that D EPTH was faster. Regarding the D EPTH visu-
on the Total Severity such that it was significantly lower for DEPTH      alization, participants also mentioned that “If you make a mistake it
(M = 14.29, SD = 23.85) than for FLAT (M = 16.7, SD = 24.76).             is easier to find the layer with the wrong element” (Participant P01),
This was also true for the Oculo-motor and disorientation aspect.         “I can better see which puzzle piece is where” (P02), “you directly
Also, the NUMBER OF LAYERS significantly influenced the disorien-         see where the puzzle piece is” (P04) and that D EPTH “provides more
tation aspect, such that the FOUR LAYER had a significantly lower         information” (P06).
value than TEN LAYER. However, the values are again very low and              Participants used different strategies to solve the puzzle task for
no significant differences were found in pairwise comparisons. The        the F LAT conditions. Three participants mainly identified the ele-
NASA TLX results indicated that the VISUALIZATION significantly           ment belonging to the current layer by trial and error. They tried
influenced the overall task load such that it was significantly higher    to move the element and if it was not possible they tested the next
for the FLAT visualization (M = 38.3, SD = 16.06) than for the            element until they found the element of that layer. Four participants
DEPTH visualization (M = 30.92, SD = 15.92). This was also the            started using this strategy but then switched to a more efficient one.
case for the mental and physical task load, as well as the frustration    One participant used it sporadically in the condition with F OUR
perceived by the participants. The perceived performance, however,        L AYERS.
was significantly higher for FLAT (M = 29.64, SD = 21.73) than for            Some participants moved to the last layer (furthest away) at the
DEPTH (M = 22.86, SD = 22.17) which again, is in contrast to the          start of each puzzle and continued to the front. In the last layer, only
results of the task completion time. In addition, we found that the       one element (the element of that layer) was visible, therefore the
number of layers had a significant impact on the overall task load        participant did not have to guess the correct element. When moving
such that it was lower for FOUR LAYERS (M = 30.83, SD = 14.67)            one layer, a new element appeared on the screen, and the participant
than for TEN LAYERS (M = 38.39, SD = 17.17). The same was                 could identify the next element with ease. Nine participants mainly
observed for frustration, physical task load and the temporal aspect.     used this strategy.
Also, we found that V ISUALIZATION had a significant impact on the            There were also participants who started from the front layer but
SUS results, in such a way that D EPTH (M = 80.09, SD = 14.05)            shortly switched to the next layer and back in order to detect the
resulted in a higher usability than F LAT (M = 68.48, SD = 17.00).        active element as this element will then disappear and reappear. Two
The main results of the three questionnaires is shown in Figure 6         participants switched to this strategy after first using another strategy.
and Table 1. Plots and detailed results on the further dimensions of      Also, this strategy was basically always used when participants
simulator sickness and task load can be found in the supplementary        wanted to correct a mistake.
material.                                                                     The fourth strategy observed was to click on the eye-symbols
                                                                          in the menu at the left to deactivate and activate the current layer.
4.5.3   Preference, Open Comments and Observations                        This would also show the user which element would disappear and
For the C ONTENT T RANSFER TASK, all but one participant pre-             reappear and therefore was the element of the active layer. This
ferred the G AZE - BASED method over the B IMANUAL, regardless            strategy was only used by one participant in his first F LAT condition.
of the number of screens. However, when asked about their pref-           Thereafter he switched strategy. Two people also tried this strategy
erence for each N UMBER OF S CREENS separately this participant           during the training phase.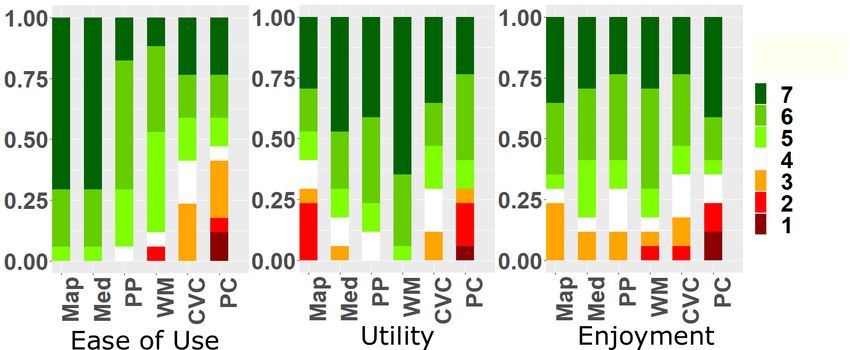
Content Transfer Task
              Task Completion Time                                           Accuracy                                               TS-SS                                                              SUS                                   Overall Taskload
         d f1    d f2    F          p       η p2          d f1          d f2    F      p          η p2          d f1      d f2        F        p           η p2          d f1          d f2            F          p     η p2   d f1   d f2        F           p       η p2
   I      1      13    63.66     < .001    70.83           1            13     .79    .39         .06            1        13        11.11    .005          .46            1             13           38.42     < .001   .75     1     13       29.81       < .001      .7
   S      1      13    99.41     < .001     .88            1            13     .53    .48         .04            1        13         .60      .45          .04            1             13           3.79       .07     .23     1     13        3.02        .11       .19
  I×S     1      13     .86        .37      .06            1            13     1.2    .29         .08            1        13         2.0      .18          .13            1             13            .87       .37     .06     1     13         .14        .72       .01
                                                                                                                          Puzzle Task
                 Task Completion Time                                             Errors                                                TS-SS                                                           SUS                               Overall Taskload
            d f1    d f2      F          p         η p2          d f1      d f2     F        p           η p2          d f1      d f2     F            p          η p2          d f1          d f2       F         p    η p2   d f1   d f2      F          p        η p2
    V        1      13       5.32      .04         .29            1        13     8.97      .04          .28            1        13     12.45       .004          .49            1            13       10.39     .007   .44     1     13      12.34      .004       .49
    L        1      13    1574.78     < .001       .99            1        13     5.14      .04          .28            1        13     4.04         .07          .24            1            13        .61       .45   .04     1     13       15.4      .002       .54
   V×L       1      13       1.23      .29         .09            1        13      4.7      .05          .03            1        13     1.86          .2          .13            1            13        .08       .78    .0     1     13       .03        .86        .0
Table 1: RM-ANOVA results for both tasks. Gray rows show significant findings. I = I NTERACTION T ECHNIQUE, S = N UMBER OF S CREENS, V =
V ISUALIZATION, L = N UMBER OF L AYERS. TS-SS: Total Severity Dimension of the Simulator Sickness Questionnaire. SUS: System Usability Scale
d f1 = d fe f f ect and d f2 = d ferror .

Figure 6: Results of the task completion time (TCT), the Total Severity aspect of the Simulator Sickenss Questionnaire (TS-SS), the System
Usability Scale (SUS) and the overall taskload (O-TL) for the C ONTENT T RANSFER TASK and the P UZZLE TASK. Also for the C ONTENT T RANSFER
TASK the distance between disc and goal in cm upon task completion is shown and for the P UZZLE TASK the mean number of total errors. On the
x-axis the digits indicates the N UMBER OF S CREENS (4 or 15) or the N UMBER OF L AYERS (4 or 10) as well as the I NTERACTION T ECHNIQUE G =
G AZE - BASED, B = B IMANUAL and the V ISUALIZATION F = F LAT, D = D EPTH. The number of stars indicates the level of significance between the
conditions (*** < 0.001 ** < 0.01 * < 0.05).
5 A PPLICATIONS                                                                                                                          of the variable range. Individual variables are selected by touch.
Based on the insights presented in the previous sections, we imple-                                                                      Switching between coordinate axes (z, protruding the display, for the
mented six applications that we envision are applicable in mobile                                                                        variable range, y, along the height of the tablet, for the data items)
knowledge worker scenarios.                                                                                                              can be achieved explicitly using a mode switch (e.g., pressing a soft
   Window Manager: We implemented a window manager that                                                                                  button) or by mapping the swipe and drag along the x- and y-axis of
allows the arrangement of multiple windows around the user (see                                                                          the touchscreen.
Figure 1, b). Interaction with those windows is supported by joint                                                                          Map: In the map application, users can navigate on a single layer
spatial and touch interaction. For example, the active window is                                                                         without the map being cropped at the boundaries of the physical
selected by head gaze (indicated by a red border around the window                                                                       screen, see Figure 1, a . Available alternative map layers can be
in Figure 7 a and b). The input space of the physical touchscreen                                                                        previewed by tilting the physical screen and be selected by swiping
(depicted as a red rectangle in Figure 7, b) is then mapped to the                                                                       along the bezel of the screen.
output space of the virtual window. Contrary to the content transfer                                                                        Medical Imaging: In the medical imaging application, users can
task in the evaluation of design parameters, for the window man-                                                                         also swipe through different layers of information, see Figure 1,
ager, the selected window stays selected even if the user’s gaze is                                                                      e–f. Additionally, the image slices can be previewed when the user
switching to another window for as long as the user is touching                                                                          moves their head to the side of the screen to look behind it.
the physical touchscreen. This design lets the user glance at other                                                                         PowerPoint: In the VR PowerPoint application users can arrange
windows without losing the context of the task. Other clutching                                                                          graphical items on a canvas, see Figure 1, d. Each item is associated
mechanisms are also feasible, such as locking the gaze-selected                                                                          with a separate layer. In the cases when items are occluded, they can
window on touch-down but then delaying the release on touch-up to                                                                        be quickly accessed by swiping through the layers.
let the user interact with the touchscreen.
   To switch depth layers, the user can either swipe along the bezel                                                                     6      M OBILE I MPLEMENTATION
or use a two-finger swipe, as described in the Section “Depth Interac-                                                                   The system was implemented using Unity 2019.3. We used a HTC
tion”. Alternatively, to retrieve a temporary preview of the otherwise                                                                   Vive Pro Eye as the HMD, which also enables hand tracking1 as
hidden layers, the user can lean towards the virtual screen to peak                                                                      well as access to the camera streams2 . While we used external
through (Figure 7, c). For interaction with virtual windows that                                                                         OptiTrack outside-in tracking systems due to superior hand tracking
are larger than the physical touchscreen, retargeting can be used, as                                                                    accuracy compared to HMD-based inside out tracking [99] for our
described in the Section “Single Screen Interaction” (Figure 7, d).                                                                      evaluations, we also implemented a system to track the user’s screen
   Code Version Control: We implemented an interface for code                                                                            using the HMD cameras, see Figure 7, g-h. While it is possible to
version control (Figure 1, c) that uses a spatial layout around the                                                                      build a computer vision algorithm to track the specific laptop model
physical screen, see Figure 1, c. Using on-screen pinches the user                                                                       used by users, we used a model-independent approach. Since the
can select different scopes of code changes (line, block, function,                                                                      laptop or tablet display screen is hidden from the user, wearing an
class, file), swipe through the commits using the selected scope, and                                                                    HMD, we can use the screen to display a standard tracking pattern,
swipe the desired commit down to the physical screen for further                                                                         such as ARUCO markers [76]. Displaying the pattern enables a
editing.                                                                                                                                 robust detection and orientation using multiple wide-field-of view
   Parallel Coordinates: Inspired by recent research in immersive
analytics [21, 22, 67, 112], we built a parallel coordinates plot that                                                                       1 https://developer.vive.com/resources/knowledgebase/vive-hand-
is grounded on the tangible physical screen, see Figure 1, g, and h.                                                                     tracking-sdk/ Last accessed April 24th, 2020.
Subranges of variables can be selected using on-surface swipes for                                                                           2 https://developer.vive.com/resources/knowledgebase/intro-vive-

the extent of the variable range and on-surface drags for the center                                                                     srworks-sdk/ Last accessed April 24th, 2020.
Figure 7: a-d: Window Manager. a: An image is selected for movement to another window by head-gaze (selecting the window) + touch (selecting
the image inside the window). b: The image is released on a different window at a different layer. The grey sphere on the red rectangle indicates
the physical finger position. The blue sphere on the image depicts the projected finger position on the current window. c: The input on and above
the physical touchscreen (red transparent rectangle, fingertip on touchscreen indicated by a white sphere) is retargeted to the virtual display
(indicated by a blue sphere). d: A user previews windows in a hidden layer by leaning forward. e-f: Options to temporarily rearrange information
layers. e: Virtual displays are temporarily arranged around the physical screen. f: If a user peeks behind the physical screen, virtual displays are
extruded to that side. g-h mobile implementation: g: user wearing an HTC Vive Eye Pro looking on a tablet PC, which displays an Aruco marker. h:
the user’s fingers are spatially tracked with the HTC Vive Hand tracking SDK
cameras of the screen and information about the laptop dimension
are sufficient to display a virtual model that can guide the user touch
gestures (see accompanying video). Other solutions, such as using
an external camera, such as a laptop camera, to track the HMD are
feasible but require additional instrumentation of the HMD [73].
To facilitate the community in further research and
development of joint interactions between touchscreens
and VR headsets, we make our code available under
https://gitlab.com/mixedrealitylab/breakingthescreen.
7 U SER F EEDBACK ON A PPLICATIONS Figure 8: Ease of Use, Utility and Enjoyment ratings for the evalu-
The purpose of this user study was to learn from initial user reactions ated applications on a range of 1 (strongly disagree) to 7 (strongly
agree). M AP: Map Interaction, M ED: M EDICAL, PP: P OWER P OINT,
on the applications we previously introduced. To this end we demon-
WM: W INDOW M ANAGER, CVC: C ODE V ERSION C ONTROL, PC: PAR -
strated individual experiences to the user instead of carrying out
ALLEL C OORDINATES. The y-axis depcits the number of participants in
task-based evaluations (following the approaches used in prior work, percent (1.0 = 100% of participants).
e.g., [18, 98]). We recruited 17 participants (8 female, 9 male, mean
age 31.9 years, sd = 9.2, mean height 173.9 cm, sd = 6.8) from a top-down qualitative coding and structuring procedures to identify
university campus with diverse study backgrounds. All participants the benefits and drawbacks of the individual applications [109]. For
were familiar with touch-sensitive screens. W INDOW M ANAGER the participants appreciated that the need for
multiple physical monitors was mitigated (“Avoids the need of a
7.1 Apparatus, Procedure, and Task monitor wall.” participant P13) but also the layered view of the
The same apparatus as in the evaluation of the design space param- virtual displays (“You can view dozens of documents.” P03) and it’s
eters were used with the following change: instead of the Android ease of use (“It was easy to understand even for non-experts.” P04).
tablet, a motion-tracked Surface Pro 4 tablet was used. Regarding C ODE V ERSION C ONTROL, one participant mentioned
After an introduction, participants were asked to fill out a demo- that she had an “overview like in a airport control tower.” P13 and
graphic questionnaire. Thereafter, we fixated OptiTrack trackers another one saw applicability to another domain: “I would like that
on the index finger of the dominant hand and the thumb of the for functional subunits in engineering” P17. Similarly, for P OWER -
other hand. Then individual applications were presented (counter- P OINT the participants saw a transfer to other domains with one
balanced). After trying out the applications the users rated them mentioning that “these layers could also be used in drawing tools like
using a short three-item questionnaire capturing the user experience Gimp or Photoshop” P14. Regarding, PARALLEL C OORDINATES a
dimensions of ease of use, utility, and enjoyment (in line with similar participant mentioned that “it is a more entertaining way to present
approaches in prior work [18, 60]). After trying out the applications, boring data” P06 and another participant, “The new visualization
participants were asked to participate in a semi-structured interview. was nice” P13. Regarding M AP a participant mentioned that “I could
Finally, the participants were compensated with a 10 Euro voucher. need that for driving.” P09 and regarding M EDICAL participants
The order of the applications was balanced across participants, mentioned that “a 3D Model from the layers would be awesome”
insofar as possible (a full permutation was not possible due to the P14 but also that “It would be cool to pick the layers directly” P04.
number of applications).
7.3 Discussion
7.2 Results
Figure 8 shows user ratings on seven-item Likert scales for questions Using immersive HMDs enables mobile knowledge workers to bring
on ease of use (“I found the application easy to use”), utility (“I found their working environment with them everywhere they go [39]. Rela-
the application to be useful”) and enjoyment (“I had fun interacting tive to the compact input and output space of today’s mobile devices,
with the application”). Note that we did not run null hypothesis sig- the large field of view of HMDs allows to substantially extend the
nificance tests on these ratings as they should serve as a descriptive available display and increase privacy. Our design explorations and
indication of these user experience dimensions only. Participants evaluations, explored different dimensions of this extended display
were asked to comment on individual applications. We followed space while focusing the input to the small area of a tablet screen.You can also read