British Columbia's Montney play - More growth on the way Mark Oberstoetter, Generate 2017 - Clean Energy BC
←
→
Page content transcription
If your browser does not render page correctly, please read the page content below
British Columbia’s Montney play
More growth on the way
Mark Oberstoetter, Generate 2017

Trusted commercial intelligence    woodmac.com

Building a competitive advantage
 on strong foundations
Over the last 40 years, Wood Mackenzie has
evolved naturally along the energy value chain to
capture all the key components affecting global
markets. We are now a part of Verisk Analytics
(NASDAQ:VRSK).

                                                    Our integrated approach allows us to
                                                    spot trends and forecast future dynamics
                                                    before anyone else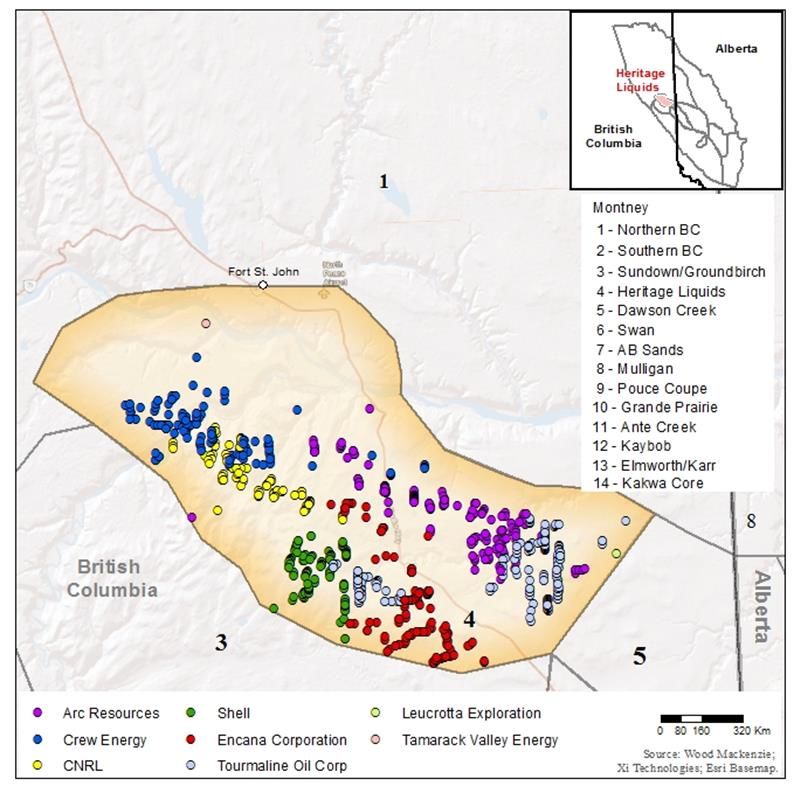
Agenda

 1 The high-level. Does the world even want gas anymore?

 2 Trends and activity levels in the Montney

 3 Forecasting activity by sub-play and operator
Wood Mackenzie’s base case outlook                                                                                                    woodmac.com           4

Province-level forecast

BC Montney production surpasses 4.5 bcfd in 2025 and 5.4 bcfd in 2030

British Columbia gas production

                       6.0                 British Columbia - conventional     British Columbia - other          British Columbia - Montney

                       5.0
 Gas production bcfd

                       4.0

                       3.0

                       2.0

                       1.0

                        -
                             2011   2012     2013     2014    2015     2016   2017    2018    2019        2020     2021    2022    2023       2024   2025

Source: Wood Mackenzie – North America Gas Service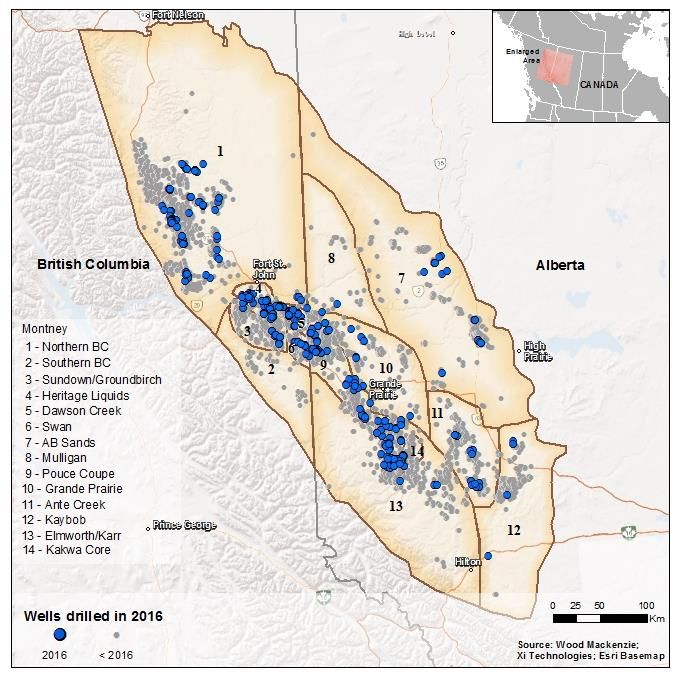
Wood Mackenzie’s base case outlook                                                                                                    woodmac.com          5

Country-level forecast

Alberta’s Montney, Deep Basin and Duvernay contributions add to British Columbia’s
growth
Canada’s gas production

                       20.0                 British Columbia - conventional     British Columbia - other          Alberta - conventional
                                            Alberta - other                     Rest of Canada                    Alberta - Montney
                       18.0
                                            British Columbia - Montney
                       16.0

                       14.0
 Gas production bcfd

                       12.0

                       10.0

                        8.0

                        6.0

                        4.0

                        2.0

                         -
                              2011   2012      2013     2014    2015     2016     2017    2018     2019    2020   2021     2022    2023    2024     2025

Source: Wood Mackenzie – North America Gas Service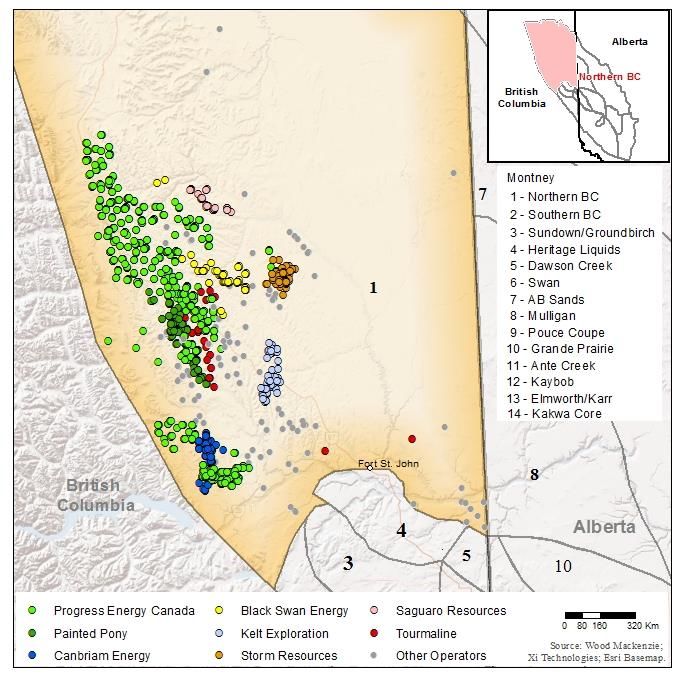
Wood Mackenzie’s base case outlook                                                                                              woodmac.com          6

North America-level forecast

Lots of competition!

North America gas production

            120.0                    Other US Lower 48      Marcellus / Utica    Haynesville    Permian      Rest of Canada     BC Montney

            100.0
 Gas production bcfd

                       80.0

                       60.0

                       40.0

                       20.0

                         -
                              2011    2012   2013    2014     2015     2016     2017   2018    2019   2020    2021   2022     2023   2024     2025

Source: Wood Mackenzie – North America Gas Service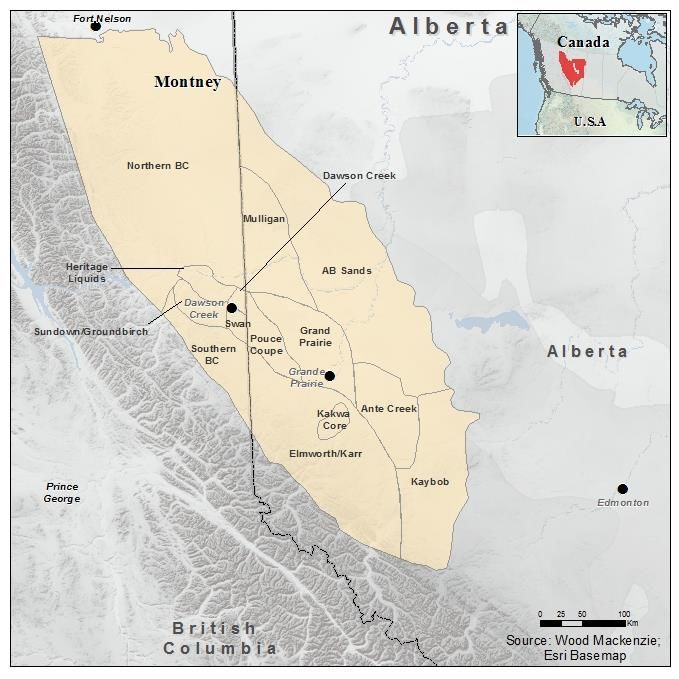
Wood Mackenzie’s base case outlook                                                                       woodmac.com              7

 Together, wind and solar grow more than threefold to 2035

 Emerging markets, led by China & India, will see greatest capacity build

 World power output by fuel, 2017 – 2035                     Global wind & solar capacity growth, 2017 – 35
      35,000                                                      2,500

      30,000
                                                                  2,000
      25,000

                                                                                                                           Solar
                                                                  1,500
      20,000
TWh

                                                             GW
      15,000
                                                                  1,000

      10,000

                                                                                                                           Wind
                                                                   500
        5,000

             0                                                       0
              2017           2021     2025    2029    2033                2017       2021      2025     2029       2033
                                                                                 South America        South America
                          Other Renewables     Geothermal
                                                                                 Russia and Caspian   Russia and Caspian
                          Solar                Wind
                                                                                 North America        North America
                          Other Solid Fuels    Hydro
                                                                                 Middle East          Middle East
                          Nuclear              Gas
                                                                                 Europe               Europe
                          Oil                  Coal
                                                                                 Asia Pacific         Asia Pacific
 Source: Wood Mackenzie                                                          Africa               Africa
Wood Mackenzie’s base case outlook                                                                                                      woodmac.com         8

Renewable costs are falling fast & surprising to the downside

Growth in China’s manufacturing capacity is the critical factor for solar markets

World PV bid prices vs. project size, 2009 – 2017                                      World solar module production, 2008 - 2016

                                  450                                                                    50,000
                                                                                                                                                         2008
                                  400                      Auctioned capacity (MWdc)

                                                                                                                                                         2009
                                                                                                         40,000
  Average bid price (USD / MWh)

                                  350                                                                              China 2016 panel manufacture 50%
                                                                                                                   greater than rest of world combined   2010
                                  300

                                                                                        Nameplate MWdc
                                                                                                                  2016 capacity approaching 90,000 MW
                                                                                                         30,000                                          2011
                                                                                                                       (vs. 50,000 MW production)
                                  250
                                                                                                                                                         2012
                                  200
                                                                                                         20,000                                          2013
                                  150
                                                                                                                                                         2014
                                  100                                                                    10,000
                                                                                                                                                         2015
                                  50
                                                                                                                                                         2016
                                   0                                                                         0
                                   Jul-09 Nov-10 Apr-12 Aug-13 Dec-14 May-16 Sep-17

Source: GTM Research
woodmac.com 9 Agenda 1 The high-level. Does the world even want gas anymore? 2 Trends and activity levels in the Montney 3 Forecasting activity by sub-play and operator
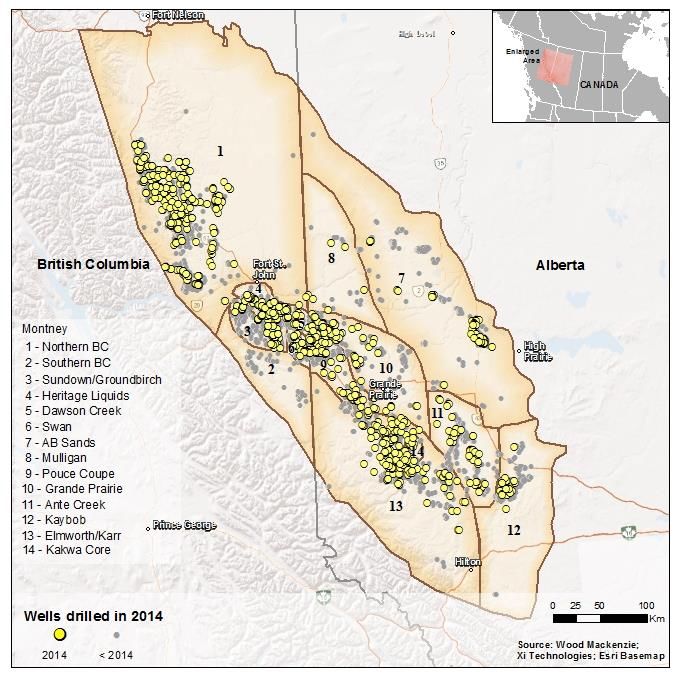
Trends and activity levels in the Montney                                 woodmac.com      10

Montney by vintage year: 2014 vs. 2016

2014 marked the peak of drilling activity thus far, led by Northern BC LNG-aspirants and
increased activity due to strong commodity prices
2014 well locations                           2016 well locations

Source: Wood Mackenzie
Trends and activity levels in the Montney                                woodmac.com    11

Operators have refined drilling and completion techniques

All or a combination of increased proppant placement, longer laterals and a greater number
of more targeted frac stages has resulted in significantly improved recoveries
Trends and activity levels in the Montney                                                                                                                                                                                                                                 woodmac.com                                            12

The trend of longer laterals

Operator preference and geology is responsible for the varying lengths of laterals

Lateral lengths by year

                                                                                                                       2011               2012              2013                      2014                   2015                 2016
                           3,500

                           3,000
 Lateral length (metres)

                           2,500

                           2,000

                           1,500

                           1,000

                            500
                                                                                                                               Montney                                                                                                                                    Duvernay
                              0

                                                                                                                                                                                                                                                                                                                       Pembina
                                                                                                                                                                                                                                             Dry Gas
                                                                                                                                                                                                                                Kakwa Core
                                                                                                        Dawson Creek

                                                                                                                                             Mulligan
                                                                                                                        Swan

                                                                                                                               AB Sands
                                   Northern BC

                                                 Southern BC

                                                                                                                                                        Pouce Coupe

                                                                                                                                                                                                                                                                          Kaybob Simonette

                                                                                                                                                                                                                                                                                                                 Oil
                                                                                                                                                                                       Ante Creek
                                                                                                                                                                      Grand Prairie

                                                                                                                                                                                                    Kaybob

                                                                                                                                                                                                                Elmworth/Karr
                                                               Sundown Groundbirch

                                                                                     Heritage Liquids

                                                                                                                                                                                                                                                                                             Kaybob West North
                                                                                                                                                                                                                                                       Kaybob Fox Creek
Source: Wood Mackenzie
Trends and activity levels in the Montney woodmac.com 13
Frac stages, the more the better?
Refined completion techniques have seen a marked increase in frac stages per well
Operator reported frac stages per well British Columbia’s top performing wells based
on IP30 rates
2013 2017 Bottom 75% Top 25% Top 10%
100 10,000
Average number of frac stages per well
90 9,000
80 8,000
70
7,000
60
Proppant (tonnes)
6,000
50
5,000
40
30 4,000
20 3,000
10
2,000
0
1,000
-
- 20 40 60 80 100
Number of frac stages
Source: Wood Mackenzie Source: Wood Mackenzie, BCOCG, IPS ranged by mmcfeTrends and activity levels in the Montney woodmac.com 14
Fewer rigs are drilling more productive and cheaper Montney wells
Lowered costs are due to structural shifts in drilling and completion techniques, along with
depressed service costs
Rig counts versus total gas production Movements in well costs since 2012
20 Seven Generations Delphi
80 BC gas production BC rig count 5.0 Cequence Black Swan
Tourmaline Birchcliff (compl. cost only)
18
4.5 Storm Resources
70
Company cited well cost (Cdn$mm)
16
4.0
Average monthly rig count
60
Production (bcfd)
14
3.5
50 12
3.0
10
40 2.5
2.0 8
30
1.5 6
20
1.0 4
10
0.5 2
0 0.0 0
2014
2012
2013
2015
2016
2017
2017
2014
2015
2016
Source: Wood Mackenzie, Nickles RigLocatorTrends and activity levels in the Montney woodmac.com 15
Montney and Deep Basin hold significant low-cost gas resource
At a wellhead breakeven, WCSB production is competitive with the Marcellus and Utica,
but top tier areas lack in repeatability
4.00 Montney Deep Basin Marcellus Utica
Bluesky AB
3.50
Northern wet gas
Local hub breakeven (US $/mmbtu)
Tioga County
3.00
Ohio
Southern wet gas
Southern BC
Lycoming Area Northern BC
2.50
Falher AB
Greene Dry Gas Area Lean Gas SWPA
Dawson Creek BC
WV Rich Gas Northeast PA
2.00 Notikewin AB Sundown Groundbirch BC Lean gas core
Swan BC
Spirit River Tier 1
Kaybob AB Southwest Rich Gas
1.50
Pouce Coupe AB
Bradford Area
Susquehanna Core
1.00
Heritage Liquids BC
Kakwa Core AB
0.50 Grande Prairie AB
Dunvegan AB
Elmworth/Karr AB
0.00
-1,000 1,000 Ante Creek AB 3,000 5,000 7,000 9,000 11,000 13,000
-0.50 Remaining well locations
Source: Wood Mackenziewoodmac.com 16 Agenda 1 The high-level. Does the world even want gas anymore? 2 Trends and activity levels in the Montney 3 Forecasting activity by sub-play and operator
Forecasting activity by sub-play and operator woodmac.com 17
Wood Mackenzie’s Montney sub-plays
NPV split by sub-play
Remaining value split 50/50 between AB and BC
Liquids-rich gas areas including Kakwa Core, Heritage
Liquids and Pouce Coupe hold 53% of remaining value
Northern BC (1),
Kakwa Core (14), Cdn$6.72 bn
Cdn$8.34 bn
Sundown
Groundbirch (3),
Elmworth Karr (13), Cdn$3.87 bn
Cdn$4.54 bn
Kaybob (12),
Cdn$1.14 bn
Ante Creek (11),
Cdn$2.43 bn
Grande Prairie (10), Heritage Liquids
Cdn$2.54 bn (4), Cdn$13.32 bn
Pouce Coupe (9),
Cdn$6.29 bn Dawson Creek (5),
Cdn$0.71 bn
Swan (6),
AB Sands (7),
Cdn$2.48 bn
Cdn$0.49 bn
Southern BC (2), Cdn$0
Mulligan (8), Cdn$0
Source: Wood MackenzieForecasting activity by sub-play and operator woodmac.com 18
Sub-play area 1 – Northern BC
Activity has shifted from LNG linked drilling to pure-play producers
» Near-term growth driven by investments in processing infrastructure
Gas
Gas Oil/condensate
Oil/condensate NGLs Wells
Wellsdrilled
drilled
5,000
3,000 300
350
(mmcfe/d)
production(mmcfe/d)
4,500
year
2,500 300
250
year
4,000
per
3,500 250
per
2,000 200
drilled
Sub-playproduction
3,000 200
drilled
1,500
2,500 150
Wells
2,000 150
Wells
1,000 100
Sub-play
1,500 100
1,000
500 50
50
500
0 0
2010 2014 2018 2022 2026 2030 2034
mmcfe/d IP Average gas well IP
16 boe/d IP Average oil well IP 1,800
IP30 rate (boe/d)
IP30 rate (mmcfe/d)
14 1,600
12 1,400
10 1,165 1,200
1,000
8
6.5 6.1 800
6 5.9 5.9 5.2 600
4 4.7 4.7 4.5 4.3 4.3 3.5
3.2 400
2
2.8 200
0 0
CNRL
Suncor
Progress
Canbriam
Painted Pony
Crew
Kelt Exploration
Saguaro Res.
Todd Energy
Black Swan
Storm Res.
Chinook Energy
Unconventional
Energy
Res.
Source: Wood Mackenzie, XI TechnologiesForecasting activity by sub-play and operator woodmac.com 19
Sub-play area 4 – Heritage Liquids
High value British Columbia acreage given condensate and NGL yields
» Highest IRR (post-tax) of British Columbia sub-plays at 62%
Gas Oil/condensate NGLs Wells drilled
5,000 300
Sub-play production (mmcfe/d)
4,500
250
Wells drilled per year
4,000
3,500
200
3,000
2,500 150
2,000
100
1,500
1,000
50
500
0 0
2010 2014 2018 2022 2026 2030 2034
86
$4.3
295
EUR (mmboe) Oil
NGL
$21.5
$14.6 Gas
Revenue (C$M))
1,094
Source: Wood Mackenzie, XI TechnologiesForecasting activity by sub-play and operator woodmac.com 20
Over 6,790 wells have been drilled in the Montney since 2013
We forecast over 10,000 more will be drilled in 2018-2026. Four areas stand out –
Northern BC, Heritage Liquids, Kakwa and Pouce Coupe
Sub-play drilling history and forecast
Northern BC (1) Southern BC (2) Sundown Groundbirch (3) Heritage Liquids (4)
Dawson Creek (5) Swan (6) AB Sands (7) Mulligan (8)
1,400 Pouce Coupe (9) Grande Prairie (10) Ante Creek (11) Kaybob (12)
Elmworth Karr (13) Kakwa Core (14)
1,200
1,000
Wells drilled
800
600
400
200
0
2008
2009
2010
2011
2012
2013
2014
2015
2016
2017
2018
2019
2020
2021
2022
2023
2024
2025
2026
Source: Wood Mackenzie, XI Technologies. Note this is our Canada Upstream unconstrained outlook, our markets teams take a risked view on these development levels.woodmac.com 21 Disclaimer Strictly Private & Confidential This report has been prepared by Wood Mackenzie Limited. The report is intended solely for the benefit of its subscribers and its contents and conclusions are confidential and may not be disclosed to any other persons or companies without Wood Mackenzie’s prior written permission. The information upon which this report is based has either been supplied to us by public sources or comes from our own experience, knowledge and databases. The opinions expressed in this report are those of Wood Mackenzie. They have been arrived at following careful consideration and enquiry but we do not guarantee their fairness, completeness or accuracy. The opinions, as of this date, are subject to change. We do not accept any liability for your reliance upon them.
Europe                   +44 131 243 4400
Americas                 +1 713 470 1600
Asia Pacific             +65 6518 0800
Email                    contactus@woodmac.com
Website                  www.woodmac.com

Wood Mackenzie™, a Verisk Analytics business, is a trusted source of commercial intelligence for the world's
natural resources sector. We empower clients to make better strategic decisions, providing objective analysis
and advice on assets, companies and markets. For more information visit: www.woodmac.com

WOOD MACKENZIE is a trade mark of Wood Mackenzie Limited and is the subject of trade mark registrations
and/or applications in the European Community, the USA and other countries around the world.
You can also read


