Broker Presentation
   24 June, 2010
←
→
Page content transcription
If your browser does not render page correctly, please read the page content below
Broker Presentation 24 June, 2010
Disclaimer
BrisConnections Investment Trust (ARSN 131 124 813) and BrisConnections Holding Trust (ARSN 131 125
025) (BrisConnections). BrisConnections’ stapled units are traded on the Australian Securities Exchange
This presentation has been prepared by BrisConnections based on information available. No
representation or warranty, express or implied, is made as to the fairness, accuracy or completeness of
the information, opinions and conclusions contained in this presentation. To the maximum extent
permitted by law, none of BrisConnections, BrisConnections Management Company Limited (BCMC),
their directors, officers, employees and agents, nor any other person accepts any liability for any loss
arising from the use of this presentation or its contents or otherwise arising in connection with it, including
without limitation, any liability arising from fault or negligence on the part of BCMC, BrisConnections, or
their directors, officers, employees or agents
General securities warning
Information, including forecast financial information, in this presentation should not be considered as an
offer or invitation for subscription or purchase of or a recommendation with respect to holding,
purchasing or selling securities or other instruments in BrisConnections. This presentation does not take
into account the objectives, financial situation or needs of any person. Before making any decision
about an investment in BrisConnections, a person should consider whether such an investment is
appropriate to their particular objectives, financial situation and needs and consult an investment
adviser if necessary
Due care and attention has been used in the preparation of forecast information in this presentation.
However, actual results may vary from forecasts and any variation may be materially positive or
negative. Forecasts by their very nature are subject to uncertainty and contingencies that are outside
the control of BrisConnections. Past performance is not a reliable indication of future performance
2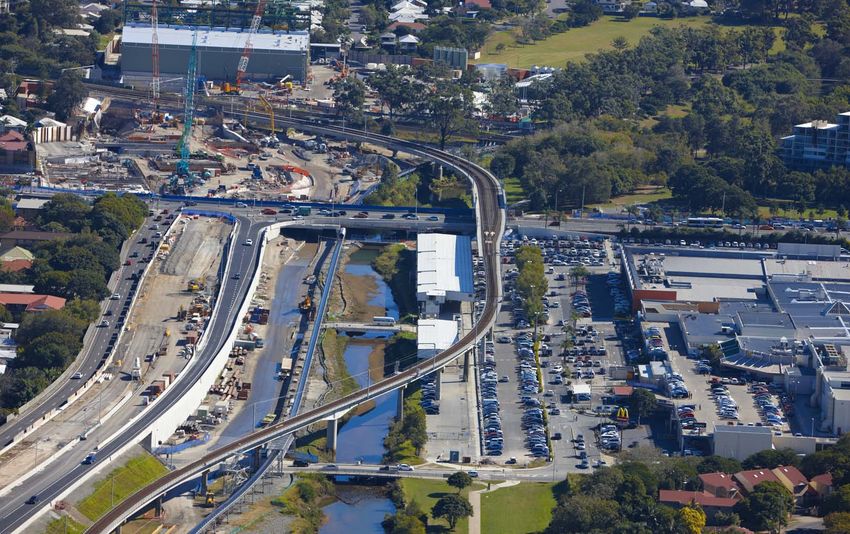
Brisbane’s Missing Link
           NORTHERN
            SUBURBS

                          3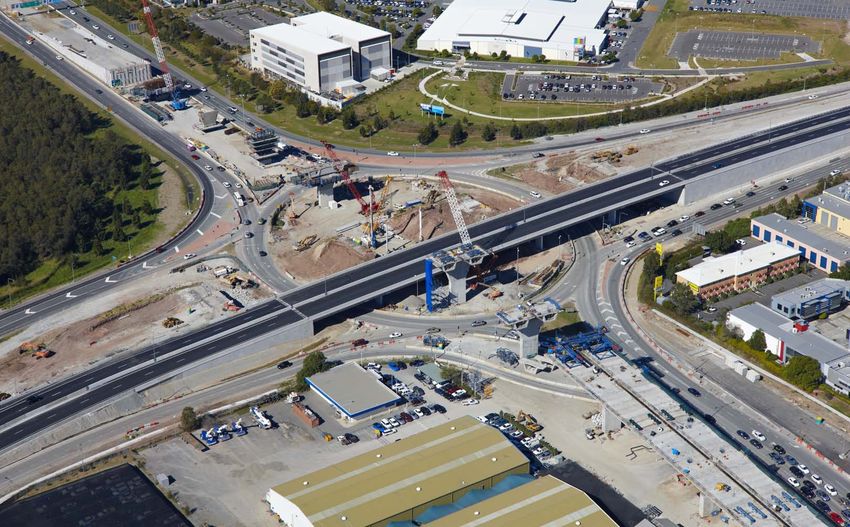
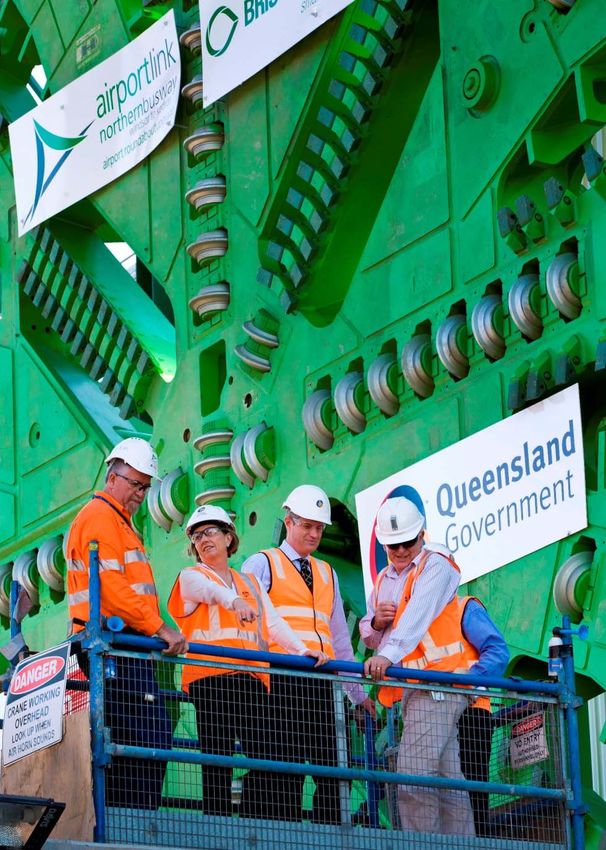
Breakthrough – Truro
   Street and Bowen Hills

                            Kedron

Bowen Hills and Kedron               4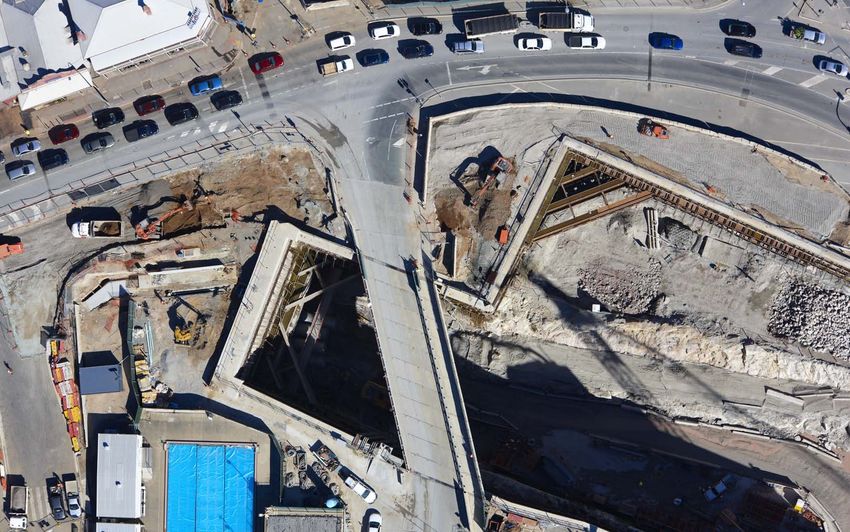
Project
• 45 year concession to build and operate Australia’s
   largest privately funded infrastructure project -
   $5.6bn in total (inc Gov contribution, finance costs
   and interest)
• Key road in economic heart of highest growth city
   and State in Australia
• Links Brisbane CBD with north/north west Brisbane,
   Brisbane Airport and TradeCoast
Effectively 3 tollroads in a single concession

                                                          5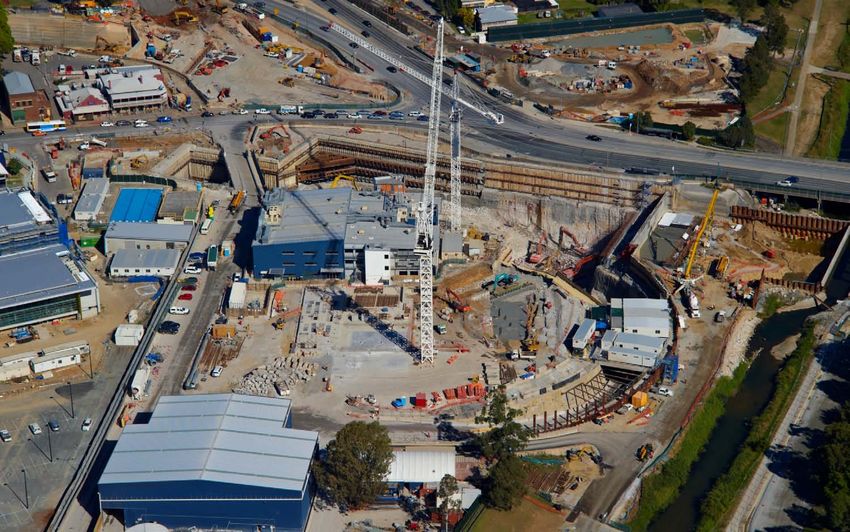
Toombul / Kalinga Park 6
TBM main drive

                 Kalinga Park – Cutter
                       head lowering

                                         7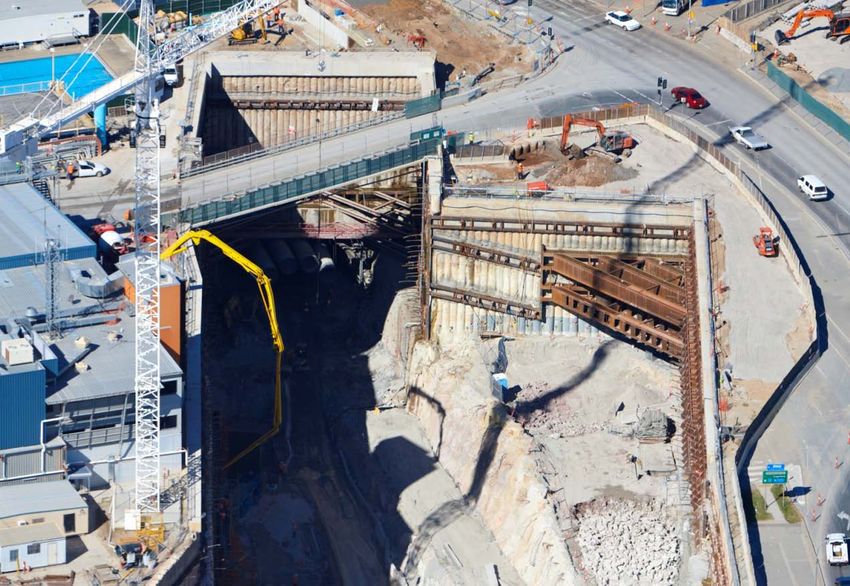
Capital Base Secure - Equity
• GFC
   – highly unusual circumstances for both unitholders and
     underwriters
   – Issues now largely behind us
• Robust structure
   – capital base of the Trusts
   – value of the project
• All instalments received. Underwriters to convert
  final loan to circa @ 1.3 million units
• Refocus
   – quality of asset
   – re-appraisal of value

                                                             8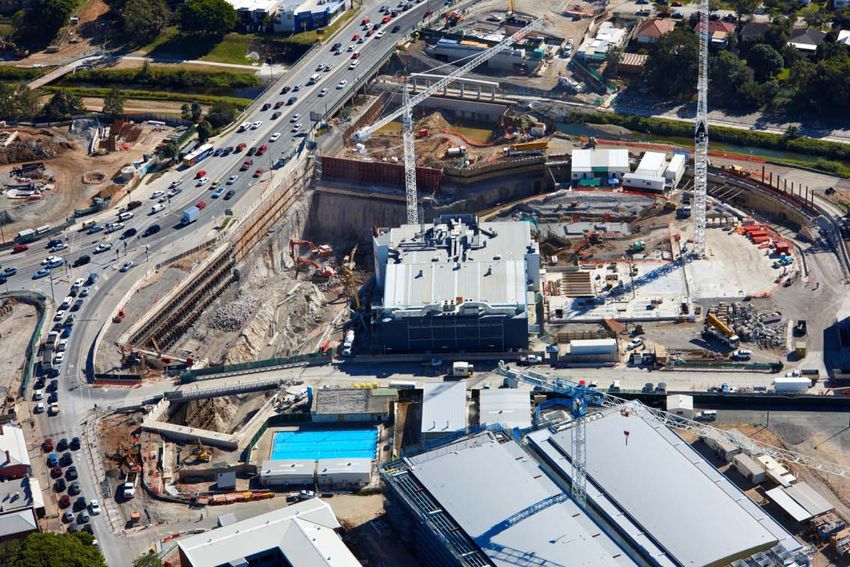
Kedron – June 2010

Kedron                        9
Kedron 10
Equity
• 390,264,895 BCSCB securities on issue (after
  underwriters convert)
• Over 180 holders
• Top 20 hold 99%
   –   Macquarie 45.48%
   –   Deutsche 35.42%
   –   QIC 9.95% (includes Q Super)
   –   Capital 7.00%
• Deferred equity of $200m – LHL group
• Current market cap c.$420m

                                                 11
Kedron 12
Toombul / Kalinga Park 13
Capital Base Secure - Debt
• Funding for entire construction in place
• Construction facility now drawn to over $730m
• Current debt outstanding >$1,167m
   – SBF = 267m
   – EBF = 170m
   – CF = 730m
• No refinance obligations until mid 2018, six years
  after opening
• Interest rate fully hedged for construction period
  (then 80% to mid 2018)

                                                       14
Toombul /Kalinga Park 15
Bowen Hills

                   Airport
              Roundabout
                 Upgrade

                             16
Asset value drivers
• Brisbane / SEQ population growth
• Brisbane Airport growth
• Industrial /Commercial demand growth (Australia
TradeCoast)
• Alternative transport modes becoming less
attractive
• Brisbane CPI – toll price escalation
• Asset class being re-rated
• Qld consolidation – BCS well positioned
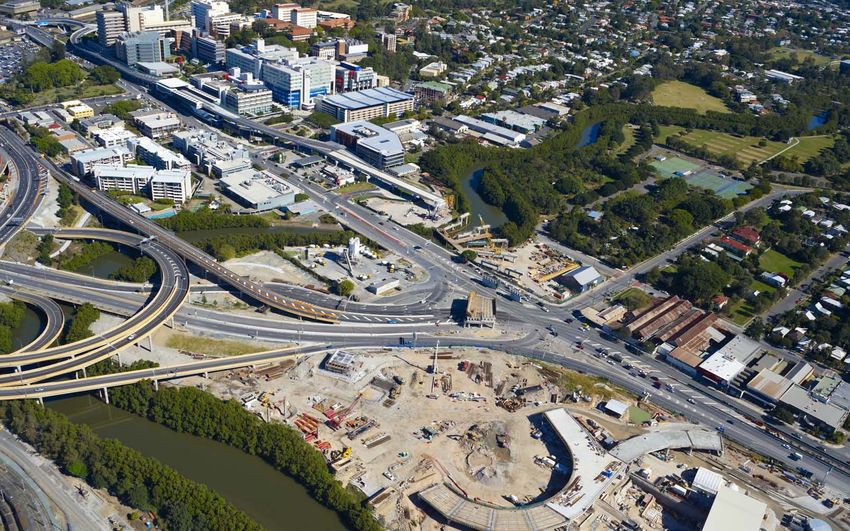
17Busway works 18
Bowen Hills 19
Project
• Construction now nearly 50% complete by $
  spend = over $2 billion spent on D&C
  – Over 8.5million hours worked to date, 3200 plus workers
• Scheduled opening
  mid 2012
• ON BUDGET and ON
  PROGRAM

                                                              20
Kedron 21
Project … so far
• 9 major construction sites
• 4.5 kilometres of excavated tunnel
• 43,490 m2 asphalt laid
• 15 of 17 roadheaders currently operating
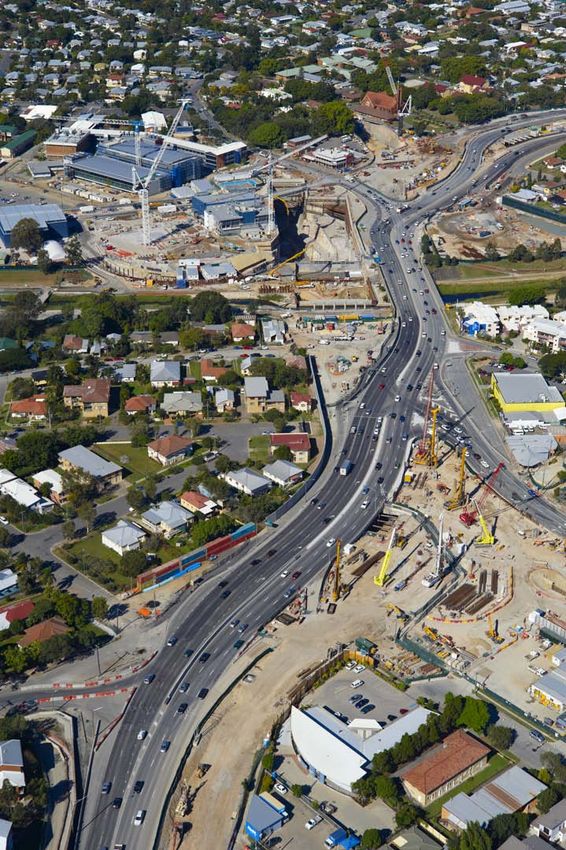
22Airport Roundabout Upgrade 23
Airport
             Roundabout
             Upgrade

Bald Hills
 Precast

                          24
Key Attractions
• Unique, irreplaceable asset supporting key urban
and regional economic drivers
• High growth region within a high growth nation
• 45-year concession
• Positive reappraisal of asset class in Australia and
globally
• Capital base secure
25Kedron 26
TBMs 27
Airport Link Specifications

                              28
Brisbane’s missing link
• Serves multiple markets
- Time sensitive and commercially driven users
- Highest employment and trip generators in the greater Brisbane
region
- Airport Link catchment contains majority Brisbane population
• Three toll roads under one concession
- Commuter road linking northern suburbs to CBD
- Links CBD to one of Australia's fastest growing major airports
- Link to Australia TradeCoast, a major jobs growth hub for SE Qld
29 29Traffic
• PDS Traffic Forecasts show strong traffic ramp up
Section Traffic (ADT) Traffic (AADT) Traffic (AADT)
July 2012 (1 Sept 2013 (15 June 2016 (4
mth) mths) years)
1. Bowen Hills 67,948 91,089 98,464
to Kedron
2. Bowen Hills to 48,749 68,536 80,285
Toombul
3. Kedron to 21,188 35,753 42,338
Toombul
• Robust Cover Ratio’s are quickly reached as traffic ramps up
DSCR Year 1 Year 2 Year 3 Year 4 Year 5 Year 6
Min 0.46 1.22 1.37 1.49 1.61 1.74
Reserve 2.29 1.68* 1.40** 1.49 1.61 1.74***
Supported
• *Ramp Up Reserve repaid ** Liquidity Reserve Repaid *** 1.81 at
refinancing
30Traffic Factors Update
Key factors to traffic:
Factor Comment
• Population Growth Remains strong – running at 2.7%
• Employment Recovering strongly 2.75% 3.25% 2010-
2012
• Economic Growth Recovering – 3.75% 4.50% 2010-2012
• Inner City and CBD Development Patchy, CBD weak, inner city
remains good (e.g. Hamilton/Bowen
Hills)
• Brisbane Airport air travel demand Strong growth forecast, actuals up this
calendar year
• Commercial Development at Brisbane Significantly improved forecast
Airport/TradeCoast 80,000 106,000 jobs
• Road Network Capacity Enhancement Positive: Northern Link announced, Hale St
opens July 2010, Clem7 opened 6 mths
early, Stafford and Gympie Roads
enhancement
31Queensland Economic Outlook
• Population projections remain highest in Australia
• Brisbane Airport continues to grow; second busiest entry point for
internationals
• Australia TradeCoast fastest growing trade and industry region
• Public transport costs anticipated to rise over the next 5 years
• Employment growing strongly. (10 successive months of growth;
58,000 people added to workforce over last 12 months)
• Average weekly earnings running well ahead of forecasts – up 6.7%
in year to February
The overall status of the Queensland economy
appears to be improving
32Qld Population Growth
SE Qld SE Qld
• 2.7% pa growth to March 10
• 2.3% p.a. growth over last 20 years
• 1.2 million people forecast to settle in
S.E. Queensland in the next 20 years
Sources:
• Department of Infrastructure and Planning Information and
Forecasting Unit, South East Qld Population and Housing Data
• ABS, Australian Demographic Statistics Cat. No. 3105.0 and
3101.0
33Brisbane Airport Growth
Average Annual Daily Airline Passenger Airport Development Related Employment
Forecasts * Forecasts by Precinct *
2014 2019 2024 2029 Precinct 2014 2019 2024 2029
Domestic Passengers 50,170 60,170 72,650 91,320 Airport Village 2,500 2,920 3,090 5,020
International Passengers 14,930 19,130 24,360 32,430 Banksia Place 1,300 2,130 3,780 5,990
* Forecasts are subject to market fluctuations Brisbane Domestic 3,780 4,930 6,300 7,310
Future Aviation Facilities Area 100 100 400 400
Aerotech Park North & South 1,500 2,710 3,730 4,760
Brisbane International 4,210 5,560 7,130 8,830
Airport Industrial Park 30 550 550 550
Da Vinci 1,960 2,370 2,370 2,370
Export Park (inc. Viola Place &
3,060 4,420 5,120 6,820
Export Park West)
Total 18,440 25,690 32,470 42,050
* Forecasts are subject to market fluctuations. Represent average weekday workforce
Source: BAC 2009 Master Plan
34Brisbane Airport Growth
2029 Peak Period Demand and Capacity for Airport Roads
• • 267,000
vehicles/day in
2029 against
87,000 vehicles in
2009
• 60% will access
airport through
ARU
2029 Peak Period Demand & Capacity for Off-Airport Feed Roads
• Forecasts rely on
substantial mode
shift to public
transport,
therefore upside
if mode shift not
met
Source: BAC 2009 Master Plan
35Australia TradeCoast Update
• Recent study commissioned by Australia TradeCoast found 97%
increase in road freight movements to the Port of Brisbane by 2026
• More than threefold increase in international airfreight through
Brisbane Airport
• Employment forecast to increase by 26,000 to 106,000 positions by
2026 (previous estimate was 80,000 by 2031)
• Australia TradeCoast remains the fastest growing trade and industry
region in Australia
36Australia’s Future
• Budget economic and fiscal outlook economic forecast significantly
upgraded
Key Forecasts 2010/2011 2011/2012
% chg on prev yr.
(prev in brackets)
GDP 3.25 4.00
Non-farm GDP 3.50 4.00
CPI 2.50 2.50
Unemployment 5.00 4.75
• Moody’s Global predicting Australian toll road traffic growth will
gradually improve, with low single digit growth likely in 2010
• Strong recovery of the Australian economy (GDP growth of 2% in
year ended Dec ’09 and growing as above) and stabilisation of
consumer markets
37Truro St tunneling (North)
38Truro St tunneling (South)
39Kedron
40Bowen Hills
41Recent Announcement
• “It's a simple formula - more people means more cars on the
road“
• "Every hour of every day 12 more people call Queensland home”
• "Every day there are 920,000 trips to the inner city - in 20 years,
that will spike to more than two million trips a day and if you
consider that today 80 per cent of all travel is by car, these are
figures we cannot ignore”
• "By 2016 our passenger rail network will be at capacity”
Premier and Minister for the Arts
The Honourable Anna Bligh 19/11/2009
42You can also read