Brookfield India Real Estate Trust
←
→
Page content transcription
If your browser does not render page correctly, please read the page content below
Brookfield India Real Estate Trust
F I N AN C I AL Y E AR 2 0 2 1 – I N V E S T O R U P D AT E
M AY 2 0 , 2 0 2 1

                                                              CANDOR TECHSPACE K1, KOLKATA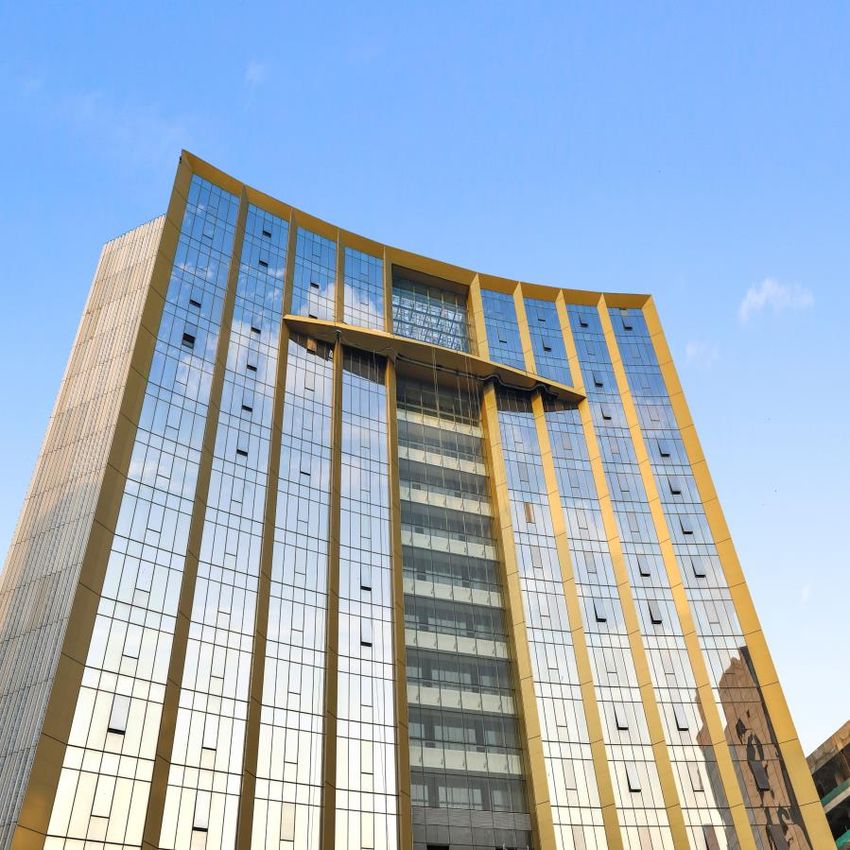
Disclaimer
By reading this presentation (the “Presentation”), you agree to be bound by the following limitations:

This Presentation is for information purposes only without regards to specific objectives, financial situations or needs of any particular person, and should not be disclosed, reproduced, retransmitted, summarized, distributed or
furnished, in whole or in part, to any other person or persons. The material that follows is a Presentation on the information pertaining to key updates of Brookfield India Real Estate Trust (“Brookfield REIT”). We don't assume
responsibility to publicly amend, modify or revise any statements in the Presentation on the basis of any subsequent development, information or events, or otherwise. This Presentation comprises information given in summary
form and does not purport to be complete and it cannot be guaranteed that such information is true and accurate. For ease and simplicity of representation, certain figures may have been rounded. No representation, warranty or
undertaking, express or implied, is made or assurance given that such statements, views, projections or forecasts, if any, are correct or that any objectives specified herein will be achieved. Neither we, nor any of our affiliates,
as such, make any representation or warranty, express or implied, as to, and do not accept any responsibility or liability with respect to, any loss, howsoever, arising from any use or reliance on this Presentation or its content or
otherwise arising in connection therewith. Unless otherwise stated in this Presentation, the information contained herein is based on management information as they exist as of date/date indicated in this Presentation and
estimates. The information contained herein is subject to change without notice and past performance is not indicative of future results.

Certain information contained herein constitutes forward-looking statements. Due to various risks and uncertainties, actual events or results or the actual performance of Brookfield REIT may differ materially from those reflected
or contemplated in such forward-looking statements. Although Brookfield REIT believes that the anticipated future results, performance or achievements expressed or implied by the forward-looking statements and information
are based upon reasonable assumptions and expectations in light of the information presently available, you should not place undue reliance on forward-looking statements and information because they involve known and
unknown risks, uncertainties and other factors which may cause the actual results, performance or achievements of Brookfield REIT to differ materially from anticipated future results, performance or achievement expressed or
implied by such forward-looking statements and information. Factors that could cause actual results to differ materially from those set forward in the forward-looking statements or information include but are not limited to:
general economic conditions, changes in interest and exchange rates, availability of equity and debt financing and risks particular to underlying portfolio company investments. There is no guarantee that Brookfield REIT will be
able to successfully execute on all or any future deals, projects or exit strategies, achieve leasing plans, secure debt or receive development approvals as set forth herein including but not limited to in slides 6, 10, 11, 13, 20, 24,
25, 26, 32, 35, 36, 39 of this Presentation. Projected results reflected herein have been prepared based on various estimations and assumptions made by management, including estimations and assumptions about events that
have not yet occurred. Projected results are based on underwriting. Due to various risks, uncertainties and changes beyond the control of Brookfield, the actual performance of the Brookfield REIT could differ materially from the
projected results set forth herein including but not limited to in slides 12, 13 and 25. There is no assurance, representation or warranty being made by any person that any of the projected results set forth herein including but not
limited to in slides 12, 13 and 25 will be achieved and undue reliance should not be put on them. Industry experts may disagree with the assumptions used in presenting the projected results.

Any changes to assumptions could have a material impact on projections and actual returns. Actual returns on unrealized investments will depend on, among other factors, future operating results, the value of the assets and
market conditions at the time of disposition, legal and contractual restrictions on transfer that may limit liquidity, any related transaction costs and the timing and manner of sale, all of which may differ from the assumptions and
circumstances on which the valuations used in the prior performance data contained herein are based. Accordingly, the actual realized returns on unrealized investments may differ materially from the returns indicated herein.

In considering investment performance information contained herein, you should bear in mind that past performance is not necessarily indicative of future results and there can be no assurance that comparable results will be
achieved, that an investment will be similar to the historic investments presented herein (because of economic conditions, the availability of investment opportunities or otherwise), that targeted returns, diversification or asset
allocations will be met or that an investment strategy or investment objectives will be achieved. Any information regarding prior investment activities and returns contained herein has not been calculated using generally accepted
accounting principles and has not been audited or verified by an auditor or any independent party. Nothing contained herein should be deemed to be a prediction or projection of future performance.

Certain of the information contained herein is based on or derived from information provided by independent third party sources. While Brookfield REIT believes that such information is accurate as of the date it was produced
and that the sources from which such information has been obtained are reliable, Brookfield REIT does not guarantee the accuracy or completeness of such information, and has not independently verified such information or
the assumptions on which such information is based. This document is subject to the assumptions (if any) and notes contained herein.

The information in this Presentation does not take into account your investment objectives, financial situation or particular needs and nothing contained herein should be construed as legal, business or tax advice. Each
prospective investor should consult its own attorney, business adviser and tax advisor as to legal, business, tax and related matters concerning the information contained herein.

This document is just a Presentation and is not intended to be a “prospectus” or “draft offer document” or “offer document” or “final offer document” or “offer letter” or “offering memorandum” (as defined or referred to, as the
case may be, under the Companies Act, 2013 and the rules notified thereunder, and the Securities and Exchange Board of India (Real Estate Investment Trusts) Regulations, 2014, Securities and Exchange Board of India
(Issue and Listing of Debt Securities) Regulations, 2008, as amended, or any other applicable law). This Presentation has not been and will not be reviewed or approved by a regulatory authority in India or elsewhere or by any
stock exchange in India or elsewhere. None of the information contained herein (or in any future communication (written or oral) regarding an investment) is intended to be investment advice with respect to a proposed
investment.

If we should at any time commence an offering of units, debentures, bonds or any other securities/ instruments of Brookfield REIT, any decision to invest in any such offer to subscribe for or acquire units, debentures, bonds or
any other securities/ instruments of Brookfield REIT, must be based wholly on the information contained in an offer document or offering circular (including the risk factors mentioned therein) issued or to be issued in connection
with any such offer and not on the contents hereof. Any prospective investor investing in such invitation, offer or sale of securities by Brookfield REIT should consult its own advisors before taking any decision in relation thereto.

The securities of Brookfield REIT have not been and will not be registered under the U.S. Securities Act, 1933, as amended (“U.S. Securities Act”), or the securities laws of any applicable jurisdiction and these materials do not
constitute or form a part of any offer to sell or solicitation of an offer to purchase or subscribe for any securities in the United States of America or elsewhere in which such offer, solicitation or sale would be unlawful prior to
registration under the U.S. Securities Act or the securities laws of any such jurisdiction.

                                                                                                                                                                                                                                              2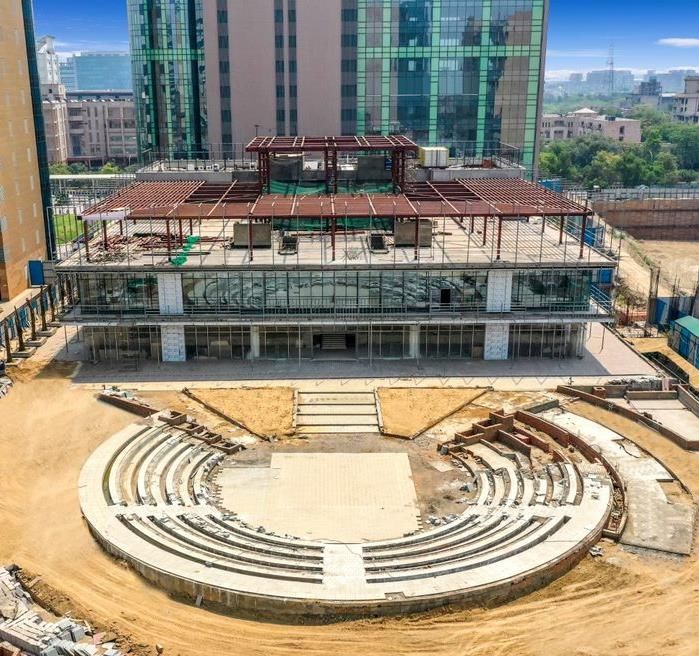
Table of Contents

Overview and Highlights     4

Market Trends               14

Business Updates            19

Financial Updates           29

Inorganic Growth Pipeline   33

Appendix                    37

                                 3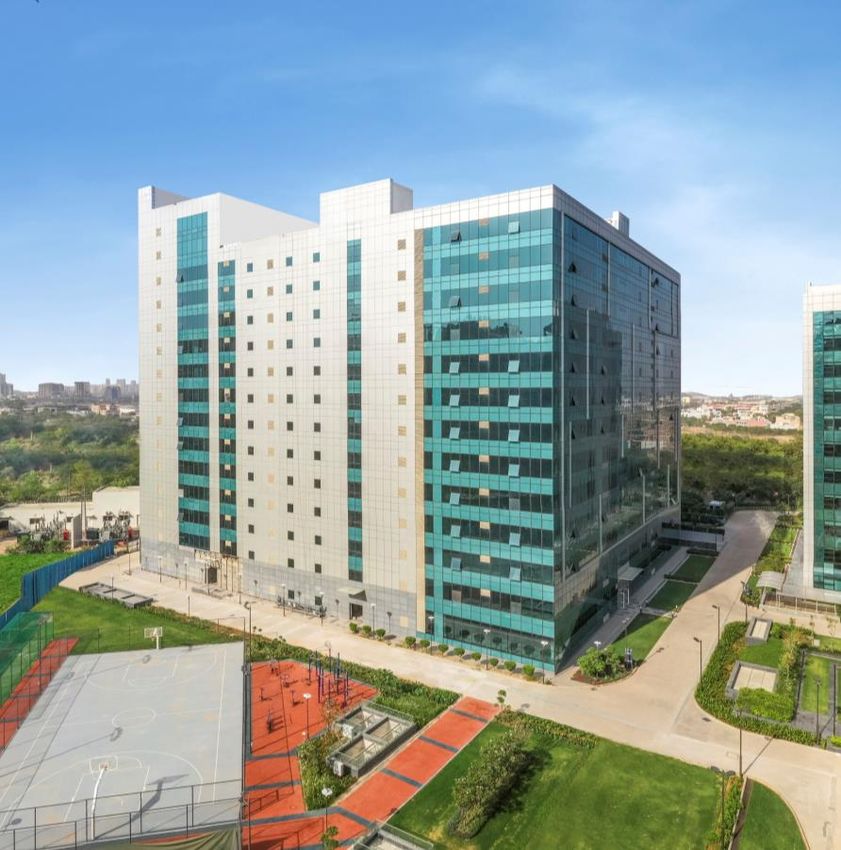
Overview and Highlights

                          CANDOR TECHSPACE G2, GURUGRAM
Brookfield India Real Estate Trust

India’s first and only 100% institutionally managed REIT

14.0 MSF                                10.3 MSF
TOTAL AREA                              COMPLETED AREA                                  Gurugram (4.0 MSF)                              Noida (2.8 MSF)
                                                                                            3.9           0.1                             1.9          0.9

                                                                                                                              18%
                                                                                                                     38%

                                                                                                                                            22%
 4                                      91%                                                                                                                  Kolkata (5.7 MSF)
 OFFICE PARKS IN                        SAME-STORE OCCUPANCY(1)                                                                                               3.1        2.7
 GATEWAY MARKETS
                                                                                                                     22%
                                                                                         Mumbai (1.5 MSF)
                                                                                           1.5            -

 6.5 Yrs.                               Rs 115B
 WALE                                   GROSS ASSET VALUE
                                                                                                      Total REIT Portfolio (14.0 MSF)
                                                                                                          10.3                   3.7                     %GAV
                                                                                                       Operational           Future Dev.

                                                                                                                                                                                 5
(1)   Same-store Occupancy excludes areas developed during the year (481 KSF delivered in N1 Sep ‘20). Overall Committed Occupancy is 87% including such areas.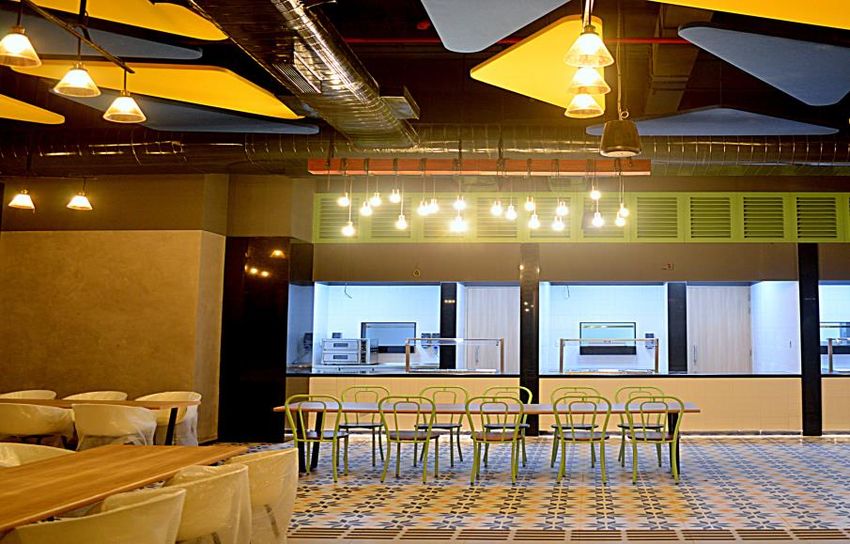
Brookfield India Real Estate Trust (Cont’d.)

Strong inorganic growth pipeline through Identified Assets and ROFO Properties within the
Brookfield Group

IDENTIFIED ASSETS                       ROFO(1) PROPERTIES

                                                                                           Gurugram (3.7 MSF)                       Noida (4.5 MSF)
8.3 MSF                                 6.7 MSF                                                3.7          0.1                         2.9    1.6
LEASABLE AREA                           LEASABLE AREA

Rs 86B                                   Rs 104B
GROSS ASSET           VALUE(2)           GROSS ASSET VALUE(3)

                                                                                          Mumbai (6.7 MSF)
                                                                                             4.2           2.5

15.0 MSF                                 Rs 190B
TOTAL LEASABLE                           TOTAL GROSS ASSET
AREA                                     VALUE

                                                                                                            Total Pipeline (15.0 MSF)
                                                                                                            10.8               4.2
                                                                                                         Operational       Future Dev.

(1)   Right of First Offer.
(2)   As on March 31, 2021, based on the floor price per the Agreements to Purchase signed with the Brookfield Group.                                 6
(3)   As on March 31, 2021, based on Manager’s estimates.
IPO Highlights

                                                                         STRONG SPONSOR COMMITMENT

                                              BSE: 543261 | NSE: BIRET             54.4%                15.0 MSF / Rs 190B
                                                                                Post-IPO Stake            Acquisition Pipeline

LISTING DATE                                          Feb 16, 2021
                                                                         USE OF PROCEEDS(1)                          MILLIONS

FRESH ISSUE SIZE                                     Rs 38.0 Billion     Repayment of Debt                             Rs 35,750

                                                                         Issue Expenses and General
                                                                                                                        Rs 2,250
                                                                         Corporate Purposes
MAIN BOOK SUBSCRIPTION                                         8.0x

ISSUE PRICE / UNIT                                            Rs 275     INITIATION OF COVERAGE SINCE IPO

                                                                         Bank of America              JM Financial
UNITS OUTSTANDING                                     302.8 Million      HSBC                         JP Morgan
                                                                         ICICI Securities             Morgan Stanley
MARKET CAPITALIZATION                                                    IIFL
                                                     Rs 83.3 Billion
AT IPO PRICE

                We executed a successful IPO with strong participation from a diverse mix of
                                           marquee investors

                                                                                                                                   7
(1)   Based on Final Offer Document dated February 9, 2021.
High Quality Properties in Gateway Cities

Our portfolio is at the centre of the technology growth story in India, with our occupiers running
business-critical operations

  Mumbai’s only Private SEZ located in Powai (a walk-to-work modern township)                         Largest Office SEZ in CBD Gurugram

                                          KENSINGTON, POWAI, MUMBAI              CANDOR TECHSPACE, SECTOR 21, GURUGRAM (G2)
                                                    1.5 MSF | 9 ACRES                                      4.0 MSF | 29 ACRES

                     Largest IT Park in an established technology hub of Noida    Largest Office SEZ in Eastern India with a modern campus

                         CANDOR TECHSPACE, SECTOR 62, NOIDA (N1)                   CANDOR TECHSPACE, NEWTOWN, KOLKATA (K1)
                                              2.8 MSF | 19 ACRES                                          5.7 MSF | 48 ACRES
                                                                                                                                             8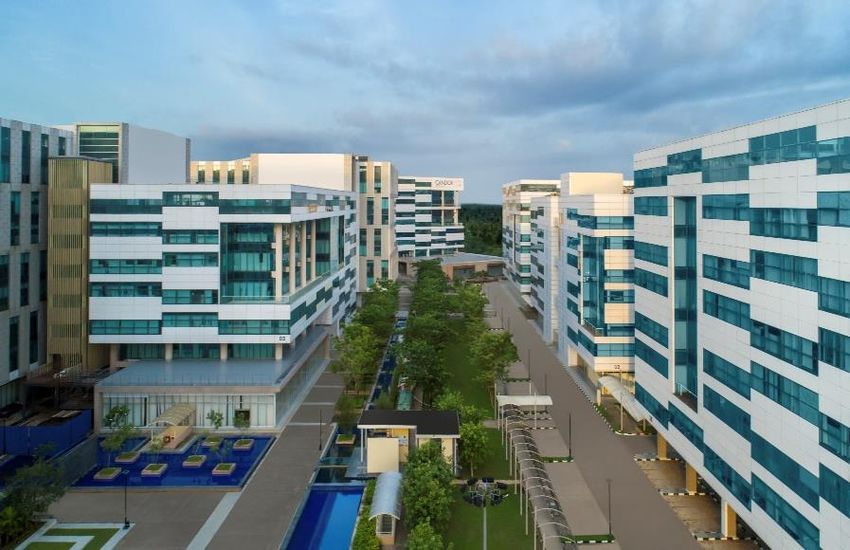
Operating Resilience through COVID-19

While new leasing decisions have been delayed, existing occupiers continue to see value in
retaining their spaces

      99%+                                                   9%                                            78%                                            31%
       COLLECTIONS (1)                                AVG ESCALATION                                        OCCUPIER                                   MARK TO MARKET
                                                    ACHIEVED ON 3.7 MSF                                    RETENTION (3)                                 HEADROOM
                                                          AREA (2)

              Low density                                                                                                           Implemented multiple health
                                                                     Properties kept operational
      developments with favorable                                                                                                     & safety measures and
                                                                         during lockdown
             infrastructure                                                                                                                 initiatives

(1)
FY2021 Business Highlights

Portfolio remained resilient in FY2021, maintaining a 91% Same-store Occupancy(1) and
99%+ rental collections

                                                                                            • Collections of operating lease rentals remained robust at 99%+
                                    99%+                            ~9%
Collections                    Operating Lease               Avg Escalation on              • ~9% average escalation on 3.7 MSF leased area
                               Rentals Collected               3.7 MSF area                 • Minimal rental pressure due to 31% spread to market rents

                                                                                            • Leased 673,000 SF in FY21
                                                                                              ‒ 122,000 SF new leasing
                             673,000 SF                            17%
Leasing                                                       Avg Re-leasing                  ‒ 551,000 SF renewals with 17% average re-leasing spreads
                           Leased and Renewed
                                                                 Spread                     • Retained 1.7 MSF of tenancy (which had typical break options)
                                                                                            • 87% Committed Occupancy and 91% Same-store Occupancy (1)

                                                                                            • Despite labour disruptions, 481,000 SF in N1 was delivered in
                                                                                               September 2020
Development                  481,000 SF                      ~Rs 400M                       • On track to deliver 80,000 SF Amenity Block in N1 in Q2 FY22
                                   New Area
 and Capex                                                Upgrade Capex Spent               • Revamped the occupier amenities in K1
                                   Delivered
                                                                                            • Commencing planned upgrades in Kensington with best-in-class
                                                                                               amenities

(1)   Same-store Occupancy excludes areas developed during the year (481 KSF delivered in N1 Sep ‘20). Overall Committed Occupancy is 87% including such areas.   10
FY2021 Business Highlights (Cont’d.)
Identified Assets achieved significant development progress. Our properties remained open
to ensure business continuity for our occupiers, with elevated health and safety standards
Identified 908,000 SF • Leased 102,000 SF in FY21; ~400,000 SF under advanced stages
New Area
Assets • Delivered 908,000 SF in G1; Additional 673,000 SF delivered in N2 in Q1 FY22
Delivered
• Properties kept operational during lockdown with tenants running critical business
(1)
COVID-19
6 continuity operations
Campuses BV • Implemented elevated health & safety standards and protocols to provide a safe
Response Safeguard Certified working environment for our tenants and their employees
• Working with authorities to implement vaccination drives on our premises
COMMITTED TO HEALTH AND SAFETY
Received the prestigious ‘SAFEGUARD’ Properties kept operational during lockdown with
certification from Bureau Veritas elevated health & safety standards and protocols
11
(1) Including REIT Portfolio (4 campuses) and the Identified Assets (2 campuses).FY2021 Financial Highlights
Financial metrics stayed resilient, backed by contractual arrangements with creditworthy
counterparties
OPERATING LEASE RENTALS NET OPERATING INCOME NDCF GUIDANCE(1)
Rs 6.1 Billion Rs 6.5 Billion Rs 12.75 per unit
2.5% increase vs FY20 constant vs FY20 due to post- total over next 2 quarterly
COVID reduction in CAM profits distributions(1)
GROSS ASSET VALUE(2) NET ASSET VALUE(2) GROSS DEBT (2)
Rs 115 Billion Rs 317 per unit 18% LTV
0.6% increase since 2% increase since with 50bps+ reduction
Sep 30, 2020 Sep 30, 2020 headroom in borrowing costs
KEY PROPERTY INCOME METRICS
MILLIONS FY21 FY20 VAR. % KEY DRIVERS
Income from Operating • Driven by contractual escalations, partially offset by new
Rs 6,100 Rs 5,954 2.5% vacancies
Lease Rentals (OLR)
• Increase in OLR, offset by reduction in CAM profits due to
Comparable NOI(3) 6,548 6,557 (0.1%) COVID-19 outbreak
% Margin on OLR 107% 110% • Driven by reduction in CAM profits
(1) For the period from IPO to Sep 30, 2021.
(2) As on March 31, 2021. 12
(3) Net Operating Income attributable to the REIT Portfolio. Refer to Appendix for details.Doubling Tax-free Distributions
In line with our thinking, we have taken steps to enhance the tax efficiency of our distributions
and make it more appealing for a wider variety of investors
FY22 NDCF FY22 NDCF
G2+K1 OWNERSHIP AT IPO % TAX FREE, AT IPO % TAX FREE, POST CONVERSION
15% 30%+
12% Compulsorily
Convertible Debentures; Doubling the tax-free
Rs 10,100M face value component
(converted to shares
effective April 1, 2021)
100%
CCDs
Shares
Key highlights of the conversion
Candor Kolkata • Effective April 1, 2021
(G2+K1 SPV) • Neutral to corporate tax outflow for the medium term (~4 yrs)
• Interest of Rs 1,212M p.a. (taxed at marginal rate), will be reclassified to
repayment of capital going forward (tax-free)
We estimate > 30% of NDCF being tax free in the hands of investors starting April 1, 2021.
Further, future growth in distributions will further enhance the tax-free percentage
13Market Trends
CANDOR TECHSPACE N1, NOIDASolid Services and Technology Sector Fundamentals in India
Significant cost and manpower advantages, coupled with accelerated digital transformation,
will further propel the growth of technology sector in India
INDIA’s IT-BPM REVENUE DIGITAL REVENUES # EMPLOYEES
(USD BILLIONS) (% OF TOTAL) (MILLIONS)
FY2010 $78B 0% 2.3
FY2017 $154B 14% 3.9
FY2021 $194B 29% 4.5
+80% +30%
FY2025 (E) $350B 38%
Key Drivers Global Capability with Cost Advantage Accelerated Digital Transformation Unparalleled Human Capital
• 45% share in global off-shoring • Companies across the globe building • Abundant young human capital,
future readiness with wide global acceptance
• ~4x employee cost arbitrage vs US
Tier-II markets • Tech adoption driven by new trends • 2+ million STEM graduates p.a.
such as Cloud, AI/ML, cybersecurity •
• Attractively priced grade A real estate 2nd largest English speaking
($0.6 - $1.8 PSF / mth) population
15
Source: CW Research, Brookfield Research.Technology Hiring Resuming for Top Multinationals
Driven by strong demand and anticipation of order books, technology hiring has picked up in
the last few months. With India being a direct beneficiary, we expect occupiers to return to
office to house this growth as up-skilling and retention gain more importance
TECHNOLOGY MNCs – YOY HEADCOUNT ADDITION / % YOY GROWTH
Brookfield REIT
Top 10 Occupiers(1)
55K
Brookfield REIT
Other Occupiers(1)
40K Others
28K
19K 17K
15K 14K
(2)
Company 1 Company 2 Company 3 Company 4 Company 5 Company 6 Company 7
% YOY
+25% +9% +6% +12% +7% +8% +5%
Growth
Source: Public fillings (per latest CY2021 reporting).
(1) By area. 16
(2) Beginning number and growth for Company 7 adjusted for the lay-offs in Q1FY21.Supply Dynamics Remain Highly Favorable in our Micromarkets
Our micro-markets represent 11% of India’s office stock, but only 6% of next 3 year supply
forecast (totaling to 5 MSF)
INDIA OFFICE - STOCK (MARCH 31, 2021) INDIA OFFICE – NEXT 3 YEAR SUPPLY
TOTAL = 528 MSF TOTAL = 89 MSF
Direct Direct
Non-REIT Micromarket, Micromarket,
Non-REIT 6%
Markets, 11% Markets,
64% 65%
REIT REIT
Markets, Markets,
36% 35%
Other
Other Micromarkets,
Micromarkets, 30%
26%
Source: CW Research. 17
REIT Markets include Delhi NCR (including Delhi, Gurugram and Noida), Mumbai MMR (including Thane and Navi Mumbai), and Kolkata.Demand Recovery has been Softened by the Second Wave
After a significant pick-up in enquiries last quarter, we are beginning to experience a
slowdown in decision making post the second-wave of COVID-19
KEY THEMES IN MEDIUM TERM RECOVERY NET ABSORPTION IN REIT MARKETS
(MSF)
• Relocation: from non-institutional to
institutional properties 15
• Consolidation: from multiple locations into a 12
single large property
9
7 7
• Expansion: pent-up space demand and real 7
estate plans for next 5 years of growth
2
CY17 CY18 CY19 CY20 CY21 E CY22 E CY23 E
We expect absorption to pick-up upon significant progress in the vaccination roll-out, with
increased occupier preference towards institutionally managed properties
18
Source: CW Research.Business Updates
KENSINGTON, POWAI, MUMBAIAt the Forefront of Recovery
With our fundamentals intact, we believe our assets will be at the forefront of the post
pandemic recovery
OPERATIONAL STABILITY INSTITUTIONAL QUALITY
• Significantly Complete Portfolio
• 100% institutionally managed
• Deep Rooted Tenant Relationships
• Brookfield Group has a long history of
• Strong Balance Sheet, Low Leverage managing REITs through market cycles
and Ample Liquidity
MULTIPLE GROWTH LEVERS CONTINUED INVESTMENTS
• Organic: 4-5% contracted growth and • Enhanced progress of property
31% headroom to market rents upgrades
• Inorganic: Identified Assets and ROFO
Properties within the Brookfield Group • Significant progress in developments
20Significantly Complete and Stable Portfolio
93% of gross asset value is in operating properties, which are 91% occupied on a same-store
basis(1) with a long-dated WALE of 6.5 years
Area ( in MSF) Leased Area Metrics
In-place Asset
Dev. Area # Office Same-store WALE
Asset Operating Total Rent Value
Potential in MSF Tenants Occ.(1) % (Yrs.)
(Rs PSF) (Rs Bn)
Kensington 1.5 - 1.5 1.3 8 86% 2.5 Rs 92 Rs 25
G2 3.9 0.1 4.0 3.6 15 92% 7.0 80 44
N1 1.9 0.9 2.8 1.3 19 96% 7.3 46 20
K1 3.1 2.7 5.7 2.8 15 91% 7.3 43 26
Total 10.3 3.7 14.0 9.0 52(2) 91% 6.5 Rs 65 Rs 115
ASSET VALUE BY GEOGRAPHY ASSET VALUE BY STATUS
3.7 MSF (only 80,000 SF under production, rest
to be developed based on leasing trends)
22% 7%
NCR Operating
56% Kolkata
Development
22% Mumbai Potential
93%
(1) Excluding N1 Tower 5 (481 KSF) completed in September 2020. 21
(2) 5 tenants in total are present across more than one office park.Deep Rooted Tenant Relationships
Technology-led, high credit quality tenant roster, with an established track record of tenant
expansion as the ‘landlord of choice’ in our markets
SECTOR DIVERSIFICATION OF TENANTS TOP 10 TENANTS BY LEASED AREA
Growth
% Leased
Tenant Sector # Parks since
Area
Others, 9% Mar′15(1)
Healthcare, Technology, 50% Accenture Consulting 2 18% +143%
2%
Hardware,
3% TCS Technology 2 17% -
Cognizant Technology 2 14% +93%
Sapient Technology 1 6% +138%
RBS BFSI(2) 1 5% +7%
Consulting, Barclays BFSI 1 4% +60%
18%
BA Continuum BFSI 1 3% (52%)
Capgemini Technology 1 3% +30%
Amdocs Technology 1 2% +33%
BFSI, 19%
E&Y BFSI 1 2% (1%)
Total 75% +37%
(1) Adjusted for areas in Kensington, which were inherited in 2017 when the property management was taken over. 22
(2) Banking, Financial Services and Insurance.Institutional Quality Assets with Proven Outperformance
Our high quality properties and experienced management have consistently delivered
superior performance relative to the micro-markets
DELIVERING FASTER LEASING RENT GROWTH SUPERIOR OCCUPANCY VIS-A-VIS MICRO-MARKETS
% CAGR(1) %(2)
8.4%
98%
7.4%
7.2%
96%
95%
5.6%
4.9%
4.5%
91% 91%
2.9%
91% ~230 bps
90%
89% 89% 89%
0.6%
Kensington G2 N1 K1 Dec'17 Dec'18 Dec'19 Dec'20 Mar'21
Micro-market Property REIT Portfolio Micro-market Average
Source: CW Research.
(1) The CAGRs for all properties are for the period between December 2015 to March 2021, except Kensington, which is from December 2017 to March 2021.
(2) Same-store Occupancy for the micro-markets as well as REIT Portfolio (excluding new supply delivered in 2020), weighed on Leasable Area of the properties as of the dates 23
indicated.New Leasing and Renewals
Aggregate 673,000 SF leased and renewed in FY21, achieving 17% re-leasing spreads
TRACK RECORD IN NEW LEASING (MSF) FY21 LEASING SUMMARY
Area (‘000 SF)
New Leasing 122
2.3 Renewals / % of term expiries 551 / 54%
Total Leasing / Renewals 673
Avg Re-leasing Spread(1) 17%
NEW LEASES SIGNED
Tenant / Industry Industry Assets / Area
0.8
0.6 Saxo Bank BFSI G2
0.4 Moody’s BFSI G2
0.2 Existing Tenants 57,000 SF
0.1
Salmon Commerce E-Comm N1
FY16 FY17 FY18 FY19 FY20 FY21 Indorama Services K1
New Tenants 65,000 SF
Total 122,000 SF
Ongoing Discussions 515,000 SF
24
(1) For office areas.New Leasing and Renewals (Cont’d.)
Portfolio has a well staggered lease expiry profile and provides an opportunity to capture an
attractive mark-to-market spread
KEY HIGHLIGHTS LEASE EXPIRY SCHEDULE
Area Expiring (MSF) Cumulative Expiry (% of Rentals)
• Extended expiries: 401,000 SF of
FY21 expiries extended to FY22
1.1
1.0 1.0
• Same-store increase: 415,000 SF
estimated increase in FY22
expiries(1) (excluding extensions)
0.6 0.6
• Renewal Success: Achieved 54% 44%
renewals on term expiries in FY21; 36%
Expecting 40%-50%(2) for FY22 23%
14%
FY21 FY22E FY23E FY24E FY25E
Rent at expiry (Rs PSF)(2) Rs 65 Rs 75 Rs 95 Rs 79 Rs 87
MTM Spread %(2) 17%(3) 24% 34% 62% 23%
(1) Based on on-going discussions with occupiers. We will provided updated renewal guidance as and when we conclude our ongoing discussions.
(2) Excludes amenity areas. 25
(3) Re-leasing spread on renewed area.Development and Capex | N1 Amenity Block
Development work of N1 Amenity Block expected to complete by September 2021
CURRENT PROGRESS POST COMPLETION (RENDERING)
26Development and Capex | K1 Amenities
Revamped the occupier amenities in Candor Techspace K1
RENOVATION OF LOBBY AREA REVAMPED HEALTH CLUB
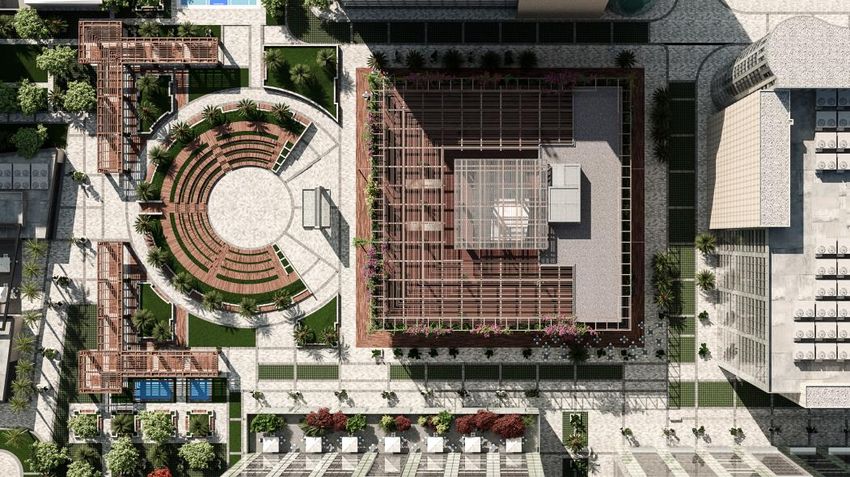
UPGRADED BANQUET HALL EXPANDED FOOD COURT 27Development and Capex | Kensington Upgrades
Commencing planned upgrades in Kensington with best-in-class amenities
LOBBY RENOVATION PODIUM LANDSCAPING
NEW FOODCOURT RECREATIONAL AREA 28Financial Updates
CANDOR TECHSPACE K1, KOLKATAValue, Structure and Unitholding
UNITHOLDING PATTERN
AS OF MARCH 31, 2021 MILLIONS PER UNIT
MARCH 31, 2021
Gross Asset Value(1) Rs 114,808 Rs 379
Non-
Less: Gross Debt(2) (21,015) (69)
institutions,
Add: Other Net Assets 2,071 7 16%
Net Asset Value Rs 95,864 Rs 317
Sponsor
Institutions, Group,
30% 54%
Manager
(BMSPL)
100% 100% 100% 100%
SPV DEBT SUMMARY(3) (MILLIONS) FPPL CKOHSPL SPPL CIOPL
ASSETS KENSINGTON G2 + K1 N1 CIOP TOTAL
Shareholder Debt by REIT (12.5% papq) Rs 7,900 Rs 24,050 Rs 4,150 - Rs 36,100
External Debt (7.15% papq) 6,500 12,600 2,100 - 21,200
Total SPV Debt (Gross) Rs 14,400 Rs 36,650 Rs 6,250 - Rs 57,300
Less: Shareholder Debt by REIT (36,100)
Consolidated REIT Debt (Gross) Rs 21,200
(1) Based on independent third-party valuation.
(2) Outstanding borrowings of Rs 21,200M adjusted for processing fee of Rs 185M which has been capitalized.
30
(3) Post conversion of the REIT owned CCDs in G2+K1 SPV (CKOHSPL) effective April 1, 2021.Summary Balance Sheet
Our business is well-capitalized, backed by a strong balance sheet
MILLIONS MARCH 31, 2021
Liabilities and Equity
Total Equity Rs 82,028
Borrowings(1) 21,015
Security Deposits 3,730
Other Liabilities 3,017
Total Rs 109,790
Assets
Investment Property Rs 100,180
Investment Property Under Development 792
Cash & Bank 3,155
Other Assets 5,663
Total Rs 109,790
NOTES:
1. SPV financials are consolidated starting February 8, 2021
2. Other Liabilities include trade & other payables, capital creditors, deferred income & provisions
3. Other Assets include income tax advances, security deposits, restricted cash balances, trade & other receivables
31
(1) Outstanding borrowings of Rs 21,200M adjusted for processing fee of Rs 185M which has been capitalized.Capital Structure and Liquidity
Low leverage, long interest only period and undrawn credit lines provide us with ample
liquidity. We are also evaluating the available 50bps+ headroom in borrowing costs
HEADROOM IN BORROWING COSTS
Rs 21.2B Rs 2.8B
GROSS DEBT UNDRAWN COMMITTED
FACILITY 7.15%
6.45%
4.9Yrs. AAA Stable
BALANCE INTEREST CREDIT RATING (CRISIL)
ONLY PERIOD Brookfield REIT Recent Comparable
Financings
OPPORTUNITIES HEADROOM IN LTV
• Potential optimization of finance costs by 50bps+ (equating to 49%
~Rs 100M p.a.) in line with comparable financings
• Favorable announcements on opening new pockets for REIT
debt will create favorable dynamics (insurance cos, FPI, etc.) 18%
• Low cost of debt shall help enable accretive acquisitions
Brookfield REIT Regulatory Cap
32Inorganic Growth Pipeline
CANDOR TECHSPACE G2, GURUGRAMBrookfield Group’s Footprint in India
Brookfield owns a 100% interest in a high quality pan-India office portfolio spanning 33 MSF
CANDOR G1, GURUGRAM POWAI DISTRICT, MUMBAI ECOWORLD, BANGALORE
CANDOR N2, NOIDA EQUINOX, MUMBAI ECOSPACE, BANGALORE
CATEGORY IDENTIFIED ASSETS ROFO PROPERTIES OTHER BROOKFIELD ASSETS
Total Area 8.3 MSF 6.7 MSF 18 MSF
Operating Area 7.3 MSF 4.2 MSF 12 MSF
Markets Gurugram, Noida Mumbai Bangalore, Chennai, Pune
REIT has the sole option to REIT has a right of first offer when
Details NA
purchase existing shareholders trigger sale
Validity Aug 2022 Feb 2026 NA
34Identified Assets Update
We have rights to acquire two complementary properties in Delhi NCR before Aug 2022. The
ongoing construction program in both assets has achieved completion over the last year
ON APR 30, 2021 G1 N2 ASSET VALUE BY STATUS
(% OPERATING)
Operating Area (MSF) 3.7 3.6(1) Mar 31, 2021(4)
Area Leased (MSF) 2.7 2.5
Same-store Occupancy (%) 97%(2) 86% 91%
WALE (Years) 7.9 8.3
In-place Rent (Rs PSF) Rs 70 Rs 51
Floor Asset Value (Rs Bn)(3) Rs 48B Rs 38B Sep 30, 2021 (Estimate)
908,000 SF 828,000 SF(1) ~400,000 SF 97%
New Area Delivered Delivery in H1FY22 Leasing Discussions
(1) Occupancy certificate for additional 673 KSF (Tower 11) in N2 was received in April 2021. Another 155 KSF of area in N2 to be delivered by September 2021.
(2) Same-store Occupancy excludes areas developed during the year (908 KSF delivered in G1).
(3) As on March 31, 2021, based on the Agreements to Purchase signed with the Brookfield Group. 35
(4) Based on draft valuation reports dated March 31, 2021. We do not expect any material changes to the metric.Identified Assets Update (Cont’d.)
New area of 908,000 SF was delivered in FY21 and another 673,000 SF was delivered in
April 2021. Balance 155,000 SF on track to be delivered by September 2021
N2 – TOWER 11 (673,000 SF) G1 – TOWER 8 & 8A (769,000 SF)
36Appendix
CANDOR TECHSPACE N1, NOIDADetailed Lease Expiry Schedule
IN-PLACE IN-PLACE
AREA AREA
% OF GROSS RENT AT % OF GROSS RENT AT
YEAR / ASSET EXPIRING YEAR / ASSET EXPIRING
RENTALS(1) EXPIRY(1) (RS RENTALS(1) EXPIRY (RS
(‘000 SF) (‘000 SF)
PSF) PSF)(1)
FY21 Actuals FY24E
Kensington 138 - Rs 79 Kensington 745 55% Rs 91
G2 544 - 74 G2 6 0% -
N1 90 - 44 N1 233 16% 40
K1 252 - 48 K1 1 0% -
Total 1,024 - Rs 65 Total 986 13% Rs 79
FY22E FY25E
Kensington 72 6% Rs 98 Kensington 145 18% Rs 148
G2 692 21% 88 G2 230 6% 96
N1 58 5% 40 N1 245 16% 43
K1 293 11% 44 K1 3 0% -
Total 1,115 14% Rs 75 Total 623 8% Rs 87
FY23E
Kensington 373 32% Rs 104
G2 90 3% 90
N1 0 0% -
K1 106 3% 50
Total 569 8% Rs 95
38
(1) Excludes amenity areas.Ongoing Capex and Upgrades
Rs 2,961M of capex projects underway across new tower developments and upgrades to
existing towers. Capex including interest during construction to be financed through debt
ESTIMATED PENDING COSTS
ONGOING PROJECTS COMPLETION DATE (MILLIONS)
Asset Upgrades/Tenant Improvements
Kensington Q4 FY23 Rs 133
G2 Q1 FY23 50
N1 Q3 FY22 156
K1 Q3 FY22 163
Sub Total Rs 502
New Development
K1 – Mixed Use Development Q3 FY25 Rs 2,207
N1 – Amenity Block III Q2 FY22 252
Sub Total Rs 2,459
Total Rs 2,961
39Property Income | Walkdown
MILLIONS FY21 FY20 KEY DRIVERS
Income from Operating Lease • Rs 146 million / 2.5% YOY increase driven by contractual
Rs 6,100 Rs 5,954 escalations, partially offset by new vacancies
Rentals (OLR)
• Rs 879 million decrease in CAM revenue (cost-plus
contracts), driven as a result of reduction in CAM expenses
(+) CAM / Other Revenue 2,528 3,613
• Rs. 206 million decrease due to mid-year termination of
CIOP’s operating services arrangement with Identified Assets
Revenue from Operations Rs 8,628 Rs 9,567
• Rs 724 million reduction in CAM expenses due to reduced
utilization due to COVID-19 outbreak
(-) CAM / Other Direct Expenses (2,028) (2,804)
• Rs. 52 million decrease due to mid-year termination of CIOP’s
operating services arrangement with Identified Assets
Net Operating Income (NOI) Rs 6,600 Rs 6,763
(-) Net income in CIOP • Mid-year termination of CIOP’s operating services
(52) (206) arrangement with Identified Assets
attributable from Identified Assets
Comparable NOI Rs 6,548 Rs 6,557
% Margin on OLR 107% 110%
40Property Income | Consolidation Details
INCOME FROM
REVENUE FROM
MILLIONS OPERATING LEASE NET OPERATING INCOME (NOI)(1)
OPERATIONS
RENTALS (OLR)
FY21 FY20 FY21 FY20 FY21 % OLR FY20 % OLR
Kensington Rs 1,464 Rs 1,488 Rs 1,592 Rs 1,616 Rs 1,333 91% Rs 1,313 88%
G2 2,518 2,478 3,657 4,084 2,725 108% 2,699 109%
N1 718 663 1,191 1,318 807 112% 780 118%
K1 1,400 1,325 2,092 2,247 1,480 106% 1,457 110%
CIOP 420 719 255 514
Intercompany
(324) (417)
Eliminations(2)
Total Rs 6,100 Rs 5,954 Rs 8,628 Rs 9,567 Rs 6,600 108% Rs 6,763 114%
Less: amount
attributable from (96) (302) (52) (206)
Identified Assets(3)
Comparable
Rs 6,100 Rs 5,954 Rs 8,532 Rs 9,265 Rs 6,548 107% Rs 6,557 110%
Total
(1) The NOI at SPV level is presented without intercompany eliminations.
(2) Revenue earned by CIOP gets eliminated with corresponding operating and maintenance expenses at SPV level. 41
(3) CIOP captures the revenue and NOI attributable from Identified Assets until termination of contract on August 31, 2020.Research Coverage
RESEARCH HOUSE ANALYST EMAIL ID
Bank of America Kunal Tayal Kunal.Tayal@bofa.com
HSBC Bank Puneet Gulati PuneetGulati@hsbc.co.in
ICICI Securities Adhidev Chattopadhyay Adhidev.Chattopadhyay@icicisecurities.com
IIFL Mohit Agarwal Mohit.Agrawal@iiflcap.com
JM Financial Manish Agrawal Manish.Agrawal@jmfl.com
JP Morgan Saurabh Kumar Saurabh.S.Kumar@jpmorgan.com
Morgan Stanley Sameer Baisiwala Sameer.Baisiwala@morganstanley.com
42Glossary
Gross Asset Value / Asset Value The market value as determined by the Valuer as of March 31, 2021
(Occupied Area + Completed Area under Letters of Intent)
Committed Occupancy In %
Completed Area
Represents Committed Occupancy for areas where the occupancy certificate was received on
Same-store Occupancy
or before March 31, 2020
Weighted Average Lease Expiry based on area. Calculated assuming tenants exercise all their
WALE
renewal options post expiry of their initial lock-in period
Rental income from leased area for the month excluding fit-out and car parking income on a per
In-place Rent
square foot basis
Assets comprising four office parks (Kensington, Mumbai; G2, Gurugram; N1, Noida; K1,
REIT Portfolio
Kolkata)
Two office parks (G1, Gurugram; N2, Noida) for which Brookfield India REIT has entered into
Identified Assets
Agreements to Purchase
Office assets for which Brookfield India REIT has entered into a right-of-first-offer (ROFO)
ROFO Properties
agreement
Refers to the realized change in base rent between the leases signed and leases expiring at in-
Re-leasing Spread
place rents, reflected as a % change
Refers to the potential change in base rent between new leases signed at market rates and
Mark-to-market Headroom / Spread
leases expiring at in-place rents, reflected as a % change
Revenue from leasing of premises including Warm Shell rent, fit-out rent and car parking
Operating Lease Rentals (OLR)
Income
Net Operating Income calculated by subtracting Direct Operating Expenses from Revenue
Net Operating Income (NOI)
from Operations
Net distributable cash flows (non-GAAP measure). Please refer to pg. 285-287 of the Offer
NDCF
Document for calculation methodology
43You can also read