CAPITALAND INTEGRATED COMMERCIAL TRUST - BofA 2021 Global Real Estate Conference 21 and 22 September 2021
←
→
Page content transcription
If your browser does not render page correctly, please read the page content below
CAPITALAND INTEGRATED COMMERCIAL TRUST
BofA 2021 Global Real Estate Conference
21 and 22 September 2021
Disclaimer
This presentation may contain forward-looking statements. Actual future performance, outcomes and results may differ materially from those
expressed in forward-looking statements as a result of a number of risks, uncertainties and assumptions. Representative examples of these factors
include (without limitation) general industry and economic conditions, interest rate trends, cost of capital and capital availability, availability of real
estate properties, competition from other developments or companies, shifts in customer demands, shifts in expected levels of occupancy rate,
property rental income, charge out collections, changes in operating expenses (including employee wages, benefits and training, property
operating expenses), governmental and public policy changes and the continued availability of financing in the amounts and the terms necessary
to support future business.

You are cautioned not to place undue reliance on these forward-looking statements, which are based on the current view of management
regarding future events. No representation or warranty expressed or implied is made as to, and no reliance should be placed on, the fairness,
accuracy, completeness or correctness of the information or opinions contained in this presentation. Neither CapitaLand Integrated Commercial
Trust Management Limited (“Manager”) nor any of its affiliates, advisers or representatives shall have any liability whatsoever (in negligence or
otherwise) for any loss howsoever arising, whether directly or indirectly, from any use, reliance or distribution of this presentation or its contents or
otherwise arising in connection with this presentation.

The past performance of CapitaLand Integrated Commercial Trust (“CICT”) is not indicative of future performance. The listing of the units in the CICT
(“Units”) on the Singapore Exchange Securities Trading Limited (the “SGX-ST”) does not guarantee a liquid market for the Units. The value of the Units
and the income derived from them may fall as well as rise. Units are not obligations of, deposits in, or guaranteed by, the Manager or any of its
affiliates. An investment in the Units is subject to investment risks, including the possible loss of the principal amount invested. Investors have no right
to request that the Manager redeem or purchase their Units while the Units are listed on the SGX-ST. It is intended that holders of Units may only deal
in their Units through trading on the SGX-ST.

This presentation is for information only and does not constitute an invitation or offer to acquire, purchase or subscribe for the Units.

                                                                                                                                                               2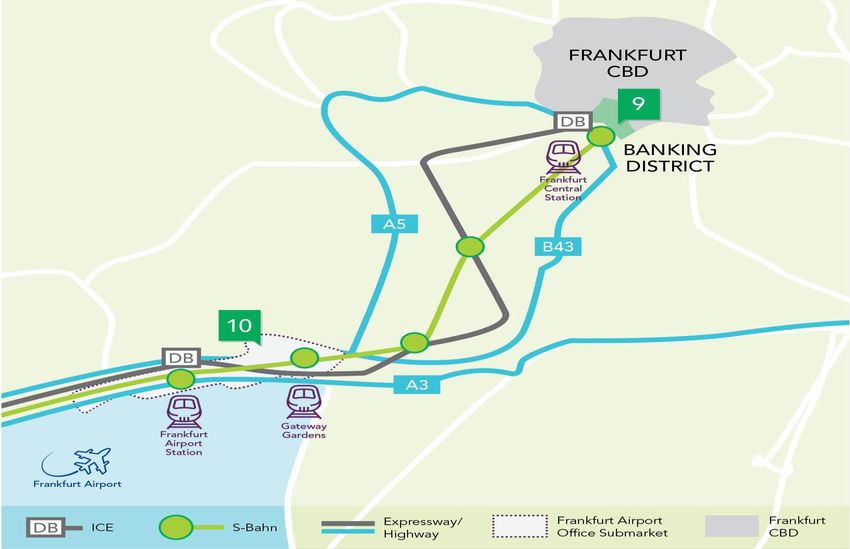
Contents
                                                                                                                                               Slide No.
1.      Highlights                                                                                                                              05
2.      1H 2021 Financial Performance                                                                                                           11
3.      Portfolio Performance                                                                                                                   19
4.      Performance by Asset Type                                                                                                               23
5.      Creating Value                                                                                                                          38
6.      Ensuring Sustainability                                                                                                                 42
7.      Looking Forward                                                                                                                         45
8.      Market Information                                                                                                                      48
9.      Additional Information                                                                                                                  62

Note: Any discrepancies in the tables and charts between the listed figures and totals thereof within this presentation are due to rounding.

                                                                                                                                                           3
CapitaLand Integrated Commercial Trust
Largest proxy for Singapore’s commercial real estate market

     Market Capitalisation                        S$13.3 billion    (1)
                                                                             Portfolio Property Value   S$22.3 billion         (2)

    Total Net Lettable Area                       10.4 million sq ft   (3)
                                                                                       NAV per Unit     S$2.00        (4)

 Leading integrated commercial REIT underpinned by                                    Predominantly Singapore-focused
 resilience and growth
                                                                                            Singapore
                                                                                               96%
                                                                                                         Portfolio
                                                                                                         property
                                                                                                        value(2) by
                                                                                                        geography
              Retail                Office         Integrated Developments                                                  Germany
               11                     8                        5                                                              4%
Notes:
(1) Based on closing price of S$2.06 as at 31 August 2021.
(2) Based on valuations as at 31 December 2020.
(3) Excludes CapitaSpring which is undergoing redevelopment.
(4) As at 30 June 2021and excludes distributable income.
                                                                                                                                      4
Highlights

             Bugis Junction
1H 2021 operating metrics highlights
Operations impacted by Phase 2 (Heightened Alert) restrictions

                                                                                                                   Recovery
                                                                                                                     level

                                                                                                                 86.3%
                                                                                                                                (1)

Portfolio Committed                                                 Retail Tenants’ Sales                                                                  Sustainability
                                                                                (average monthly                                                • Main Airport Center obtained
                                                                                                               105.3%
                                                                                                                                  (2)
         Occupancy                                                                                                                                BREEAM Good on 28 April 2021
        (as at 30 June 2021)                 94.9%                                    of 1H 2021)
                                                                                                                                                • Portfolio is 100% green-rated

                                                                                Return of                                                       Most Honoured Company
                                                                       Office Community                                                               (Rest of Asia)
        Portfolio WALE(3)                                           (average for week ended                                                        Conferred by Institutional Investor
        (as at 30 June 2021)              3.1       years(4)                    16 July 2021)                       20.6%                           All-Asia Executive Team 2021

Notes:
(1) Comparison against FY 2019 average monthly tenants sales psf and adjusted for non-trading days.
(2) Comparison against 1H 2020 average monthly tenants sales psf and adjusted for non-trading days.
(3) Portfolio weighted average lease expiry (WALE) is based on gross rental income for the month of June 2021 and excludes gross turnover rent.
(4) Based on 50.0% interest in One George Street, Singapore, 94.9% interest in Gallileo and Main Airport Center, Frankfurt; and WeWork’s 7-year lease at 21 Collyer Quay.
                                                                                                                                                                                         6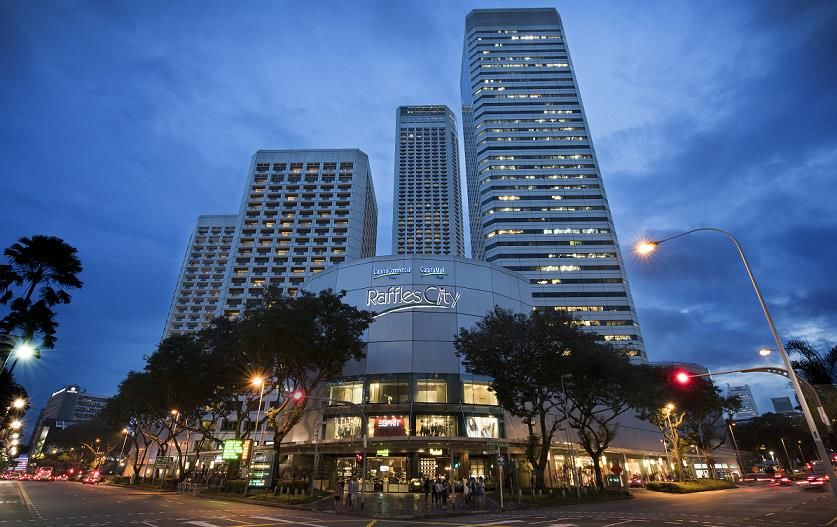
CapitaSpring TOP to be phased; on track to
complete in 4Q 2021
View from Market Street                       View from Church Street      ► Achieved a committed occupancy of 61.8% as at
                                                                             22 July 2021, with another 15% under advance
                                                                             negotiation
                                                                           ► Committed       leases   to                       contribute      income
                                                                             progressively from 1H 2022

                                                                               Leasing Breakdown by Sectors based on committed NLA

                                                                                                         Legal, 2%   F&B, 2%

                                                                                   Financial Services,
                                                                                          17%

                                                                                   Real Estate
                                                                                  and Property                                        Banking, 56%
                                                                                  Services, 23% (1)
 CapitaSpring under development and on track to complete in 4Q 2021

Note:
(1) Includes enterprise workspace solutions managed by The Work Project.
                                                                                                                                                        7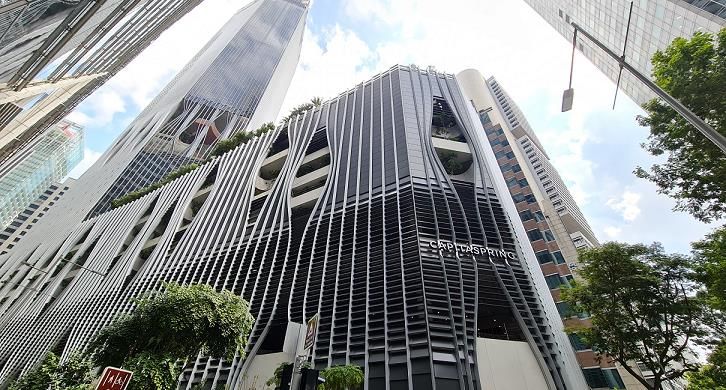
Singapore’s 2-step easing measures from 10 Aug to
transit to endemic COVID-19
                                                                                                Two-step Easing Measures
                                                                       From 10 Aug                                                                  From 19 Aug

                                                                                          All vaccinated: Up to 5 persons
Dining-in                                                                     Unvaccinated: No dining-in without pre-event testing (PET).
                                                                    Coffeeshops and hawker centres: Up to 2 persons regardless of vaccination status

Capacity Limit(1)                                                     16m 2 per person                                                             10m 2 per person

Social Gathering                                                                                            Up to 5 persons

                                                                                                                               Up to 50% of employees who can work from home may
Working Mode                                                   Work-from-home as default
                                                                                                                                              return to the workplace.
                                      • Indoor mask-off high-intensity activities and classes resumed but                    • Temperature screening no longer be a requirement in
                                        capped at 30 persons in groups of up to 5, provided all in the                         public places.
                                        group are fully vaccinated(2).
                                                                                                                             • Cinemas: Up to 1,000 persons if they are all vaccinated. If
                                      • Cinemas: Up to 500 persons if they are all vaccinated. If not, limit                   not, limit reduced to 50.
                                        reduced to 50. Food and drink may be served in groups of up to 5
                                                                                                                             • From 20 August 2021, 2359 hours, all fully vaccinated
                                        if all are vaccinated.
                                                                                                                               travellers from Australia, Austria, Canada, Germany, Italy,
Other Easing Measures                 • Services which requires masks to be removed (e.g., facial, saunas)                     Norway, the Republic of Korea, and Switzerland can
                                        resumed for the vaccinated.                                                            apply to opt out of dedicated stay-home notice (SHN)
                                                                                                                               facilities and serve their 14-day SHN at their respective
                                      • Hotels: Up to 5 persons a room, except if they are all from the
                                                                                                                               places of residence or other suitable accommodation if
                                        same household.
                                                                                                                               they fulfil certain criteria.
                                      • Wedding receptions: Up to 250 persons if all vaccinated, capped
                                        at 5 persons per table.

Notes:
(1) Capacity limit in malls and large standalone store based on per person of GFA.
(2) Participants can gather in groups of up to 5 for mask-on indoor activities and all outdoor activities, even if they are unvaccinated.
Above information is as at 10 August 2021 and not exhaustive. Please visit Ministry of Health’s website for full details.                                                                    8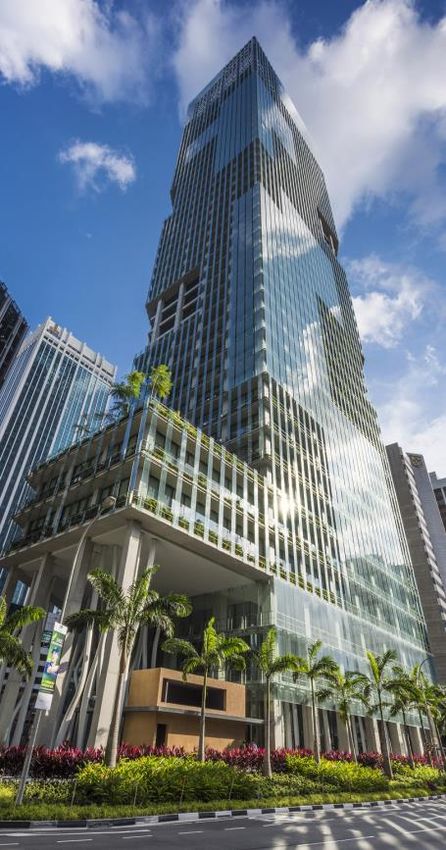
Key market environment update: COVID-19
Government support for businesses and workers to tide through operational challenges
while Singapore aims to transition to new normal with higher vaccination target
                             ► Government’s S$1.2 billion support provided targeted assistance from 16 May to 12 July:
                                    •     Affected gyms, fitness studios and performing arts and arts education centres will get 50% of salary
                                          support (16 May to 12 July) for local employees under the Job Support Scheme (JSS)(1)
                                    •     Sectors that do not have to suspend operations but are significantly affected by the measures will
                                          get 30% of JSS subsidies for (16 May to 12 July) salaries(1)
                                    •     0.5-month rental relief cash payout directly to qualifying SME tenants as part of a new Rental Support
                                          Scheme
                             ► Additional S$1.1 billion Government support providing targeted assistance from 22 July to 18 August for:
                                    •     Sectors that are required to suspend many or all of their activities, including F&B businesses, gyms,
                                          fitness studios and arts education centres(2) will receive 60% of salary support under JSS
                                    •     Other significantly affected sectors will receive 40% wage support, including, but not limited to, retail,
                                          affected personal care services, licensed hotels, cinema operators and other family entertainment
                                          centres(2)
                                    •     0.5-month rental relief cash payout directly to qualifying SME tenants as part of the Rental Support
                                          Scheme
                             ► As at 18 September 2021, 82% of Singapore’s population has completed their full regimen/ received two
                               doses of COVID-19 vaccines(3)

Notes:
(1) JSS support tapered down to 10% for two weeks after 12 July 2021.
(2) JSS support will taper down to 10 % from 19 August to 31 August 2021.
(3) For updates on the vaccination progress, please visit Ministry of Health’s website.
Above Government support is as at 23 July 2021 and does not cover all the support. Please visit Ministry of Finance’s website for more information.    9
CICT COVID-19 support
    Supporting tenants, ensuring the safety and well-being of stakeholders a priority
                                                              ►       Ensure the safety and well-being of our stakeholders by adopting the safe
                                                                      management measures
                                                              ►       Support retail tenants whose operations are directly or indirectly impacted by the
                                                                      COVID-19 measures:
                                                                       •      Two weeks of Government-mandated rental waivers from landlord to
                                                                              eligible SME tenants of qualifying commercial properties(1) whose (i)annual
                                                                              revenue did not exceed S$100 million in FY 2019 and (ii)average monthly
                                                                              revenues during both Phase 2 (Heightened Alert) periods (16 May to 13 Jun
                                                                              2021 and 22 Jul to 18 Aug 2021) fell at least 20% compared to the Phase 3
                                                                              period (28 Dec 2020 to 7 May 2021). Landlords allowed to offset any rental
                                                                              waivers provided to tenants from 16 May 2021.
                                                                       •      S$18.9 million of rental waivers were granted by CICT in 1H 2021 to tenants
                                                                              affected by COVID-19, excluding rental restructuring and marketing support
                                                                       •      Providing targeted assistance which may include relevant rental
                                                                              restructuring or waivers, as well as marketing support for tenants to continue
                                                                              sales through our digital platforms, eCapitaMall and Capita3Eats
                                                                       •      Waived the platform and commission fees for existing and new F&B
                                                                              operators who sign up with Capita3Eats during the Phase 2 (Heightened
                                                                              Alert) periods
Note:
(1) Qualifying commercial properties include retail, F&B, hotels and serviced apartments.                                                                      10
1H 2021
Financial
Performance
Plaza SingapuraAchieved 1H 2021 DPU of 5.18 cents
Distributable Income
Distributable Income
1H 2021 Distributable Income
(1)
335.9
S$335.9
(1)
(2)
109.7
million
1H 2020 1H 2021
DPU (cents)
1H 2021 Distribution Per Unit (DPU)
5.18
5.18 2.96
cents
1H 2020 1H 2021
Notes:
(1) S$2.2 million was retained for general corporate and working capital purposes for 1H 2021 comprising S$0.8 million and S$1.4 million received from CapitaLand China Trust (CLCT) and Sentral REIT
respectively.
(2) For 1H 2020, in view of the challenging operating environment due to the COVID-19 pandemic, S$46.4 million of its taxable income available for distribution to Unitholders was retained. In addition,
S$4.8 million received from CLCT was retained for general corporate and working capital purposes.
121H 2021 financial performance
Better performance year-on-year driven by enlarged portfolio and 100% contribution from RCS
Gross Revenue Net Property Income
S$645.7 million S$472.2 million
Retail Asset Performance Office Asset Performance (1) Integrated Development
(S$ m) (S$ m) Performance (2)
267.7
(S$ m)
234.5
188.6 192.0 186.0
155.9 147.1 136.5
83.9
60.5
Gross Revenue NPI Gross Revenue NPI Gross Revenue NPI
1H 2020 1H 2021 1H 2021 1H 2020 1H 2021
Notes:
(1) Income contribution from office assets is from 21 October 2020 onwards. Hence, there is no data for 1H 2020. Income contribution excludes One George Street as it is a joint venture.
(2) Income contribution from Raffles City Singapore (RCS) is on a 100.0% basis for 1H 2021. Excludes income contribution from RCS for 1H 2020 as it was a joint venture of CICT on a 40.0% basis prior to
the merger.
13NPI contribution by Top 5 properties accounts
for 47.3%
Net Property Income Contribution Net Property Income Contribution
by Asset Type(1) by Top 5 properties(1)
Raffles City Singapore,
Integrated 14.8%
developments,
28.9%
Plaza Singapura & The
Retail , Atrium@Orchard,
40.0%
1H 2021 1H 2021 9.7%
NPI: Other NPI:
S$472.2 mil properties, S$472.2 mil Asia Square
52.7% Tower 2,
8.3%
Office, CapitaGreen,
31.1% 8.0%
IMM Building,
6.5%
Note:
(1) Excludes One George Street, a joint venture.
14Healthy balance sheet
As at 30 June 2021
S$’000
Non-current Assets 22,199,056 Net Asset Value/Unit S$2.05
Current Assets 429,164 Adjusted Net Asset Value/Unit
S$2.00
Total Assets 22,628,220 (excluding distributable income)
Current Liabilities 1,024,271
Non-current Liabilities 8,257,089
Total Liabilities 9,281,360
Unitholders’ Funds 13,316,464
Non-controlling interests 30,396
Net Assets 13,346,860
Units in Issue (’000 units) 6,475,996
15CICT debt maturity profile as at 30 June 2021
Facilities in place to refinance debt maturing in 2021 and 2022 (1)
S$ million
1,800 17%
17%
1,606
1,583
1,600
14%
1,400 1,347
11% 11%
1,200 11%
870
1,072 900 1,066
1,004
1,000
265 832
299 418
800
6%
187 580
600
486
4%
290
400 215
736 683 460 3%
2% 518 2%
1%
200 358 407 1%
321 300 250
175 120 150 125
75
0
2021 2022 2023 2024 2025 2026 2027 2028 2029 2030 2031 2032 2033
Medium Term Notes (“MTN”) Secured Bank Loans Unsecured Bank Loans
Notes:
(1) Excluding debt under JVs due in 2022.
Please visit CICT website for details of the respective MTN. 16Key financial indicators
As at As at
30 June 2021 31 March 2021
Unencumbered Assets as % of Total Assets 95.8% 95.8%
Aggregate Leverage(1) 40.5% 40.8%
Net Debt / EBITDA(2) N.M. N.M.
Interest Coverage(3) 4.0x 3.7x
Average Term to Maturity (years) 4.3 4.4
Average Cost of Debt(4) 2.4% 2.4%
CICT’s Issuer Rating(5) ‘A3’ by Moody’s ‘A3’ by Moody’s
‘A-’ by S&P ‘A-’ by S&P
Notes:
(1) In accordance with Property Funds Appendix, CICT’s proportionate share of its joint ventures’ borrowings and deposited property values are included when computing aggregate leverage.
Correspondingly, the ratio of total gross borrowings to total net assets is 70.8%.
(2) Net Debt comprises Gross Debt less total cash and EBITDA refers to earnings of CICT Group, before interest, tax, depreciation and amortisation (excluding effects of any fair value changes of
derivatives and investment properties, foreign exchange translation and non-operational gain/loss), on a trailing 12-month basis.
(3) Ratio of earnings of CICT Group, before interest, tax, depreciation and amortisation (excluding effects of any fair value changes of derivatives and investment properties, foreign exchange
translation and non-operational gain/loss) over interest expense and borrowing-related costs, on a trailing 12-month basis.
(4) Ratio of interest expense over weighted average borrowings.
(5) Moody’s Investors Service downgraded CICT’s issuer rating to ‘A3’ on 1 October 2020. S&P Global Ratings assigned ‘A-’ issuer rating to CICT on 30 September 2020.
N.M.: Not meaningful
17Diversified sources of funding and certainty of
interest expense
Floating Rate
Unsecured 15% Assuming +0.1% p.a.
Proforma impact on:
Bank Loans increase in interest rate
32%
Funding Sources Borrowings Estimated additional (2)
as at as at +S$1.4 million p.a.
30 June 2021
(1)
MTN (1) annual Interest (3)
55%
30 June 2021 -0.02 cents per Unit
expense and DPU
Secured
Bank Loans Fixed Rate
13% 85%
Notes:
(1) Based on CICT Group’s borrowings, including proportionate share of joint ventures’ borrowings.
(2) Computed on full year basis on floating rate borrowings of CICT Group (including proportionate share of joint ventures’ borrowings) as at 30 June 2021.
(3) Based on the number of units in issue as at 30 June 2021.
18Portfolio
Performance
IMM BuildingPortfolio
Portfolio lease expiry profile(1)(2) as at
30 June 2021
Portfolio Weighted Average Lease Expiry by Monthly Gross Rental Income
3.1 Years
19.8%
13.6%
11.6%
9.9% 9.3%
7.2% 7.0%
5.2% 4.7%
3.9%
2.7% 2.6% 2.5%
(3)
2021 2022 2023 2024 2025 2026 and
beyond
Retail Office Hospitality
Notes:
(1) Excludes gross turnover rents.
(2) Based on 50.0% interest in One George Street, Singapore and 94.9% interest in Gallileo and Main Airport Center, Frankfurt; and WeWork’s 7-year lease at 21 Collyer Quay.
(3) The existing lease with Commerzbank is due to expire in January 2029 but there is an option for the bank to terminate the lease in 2024 with a 24-month notice. Commerzbank has exercised
its rights to terminate the existing lease by January 2024. The CICT manager is exploring plans for the building to commence in 2024 after the departure of the bank.
20Portfolio
No single tenant contributes more than 5% of CICT’s
total gross rental income(1)
% of Total
Ranking Top 10 Tenants for June 2021 Trade Sector
Gross Rent
1 RC Hotel (Pte) Ltd 4.8 Hotel
2 WeWork Singapore Pte. Ltd.(2) 2.8 Real Estate and Property Services
Supermarket / Beauty & Health / Services /
3 NTUC Enterprise Co-operative Limited 2.2
Food & Beverage / Education / Warehouse
4 Temasek Holdings (Private) Limited 2.0 Financial Services
5 Commerzbank AG(3) 1.9 Banking
6 GIC Private Limited 1.6 Financial Services
Supermarket / Beauty & Health / Services /
7 Cold Storage Singapore(1983) Pte Ltd 1.6
Warehouse
8 Mizuho Bank, Ltd 1.6 Banking
9 BreadTalk Group Limited 1.5 Food & Beverage
10 JPMorgan Chase Bank, N.A. 1.2 Banking
Total top 10 tenants’ contribution 21.2
Notes:
(1) For month of June 2021 and excludes gross turnover rent.
(2) Income contribution comprised of the tenant’s ongoing lease at Funan and expected start of 7-year lease at 21 Collyer Quay from late 2021.
(3) Based on 94.9% interest in Gallileo, Frankfurt. The existing lease with Commerzbank is due to expire in January 2029 but there is an option for the bank to terminate the lease in 2024 with a 24-month
notice. Commerzbank has exercised its rights to terminate the existing lease by January 2024. The CICT manager is exploring plans for the building to commence in 2024 after the departure of the
bank. 21Portfolio
Diversified tenants’ business trade mix
Food & Beverage, Banking, Insurance and Financial Services and Beauty & Health
remain as the top 3 portfolio trade mix
IT, Media and Other Retail and Product Trades
Travel and Hospitality, Telecommunications, 3.7% Gifts & Souvenirs / Toy & Hobbies
5.6% / Books & Stationery /
Sporting goods 2.8%
Real Estate and Services 2.7%
Property Services, Other Retail and Supermarket 2.6%
6.6% Product Trades, 23.8%
Department Store 2.2%
IT & Telecommunications 2.2%
Leisure & Entertainment / Music &
Fashion, 5.9%
Video 2.1%
Home Furnishing 2.1%
Shoes & Bags 2.0%
% of gross rental
Electrical & Electronics 1.6%
Beauty & Health,
7.5%
income(1) for June Jewellery & Watches 1.3%
2021 Other Office Trades, Others 1.2%
10.3%
Education 1.0%
Other Office Trades
Energy and Commodities 2.2%
Banking, Insurance Manufacturing and
and Financial Services, Distribution 2.1%
18.0% Government 2.1%
Food & Beverage,
18.6% Legal 1.4%
Business Consultancy 1.1%
Maritime and Logistics 1.0%
Note: Services 0.3%
(1) Based on monthly gross rental income and excludes gross turnover rent.
Others 0.1% 22Performance by
Asset Type
Please note:
The retail and office asset information
included the respective retail and
office components of integrated
developments unless stated
otherwise, in order to show the
operating metrics and trends
FunanRetail
Retail performance overview
Compared against FY 2019 Compared against 1H 2020 2Q 2021 New Retail Openings
monthly average monthly average
by NLA
1H 2021 Tenants’ Sales psf
Retail
Others, 8.4%
Occupancy(1) Recovered to Recovered to Shoes &
86.3% 105.3%
Bags, 4.5%
97.0% Home
Furnishing,
as at 30 June 2021 1H 2021 Shopper Traffic
7.6%
Recovered to Food &
Recovered to
61.3% 104.2%
Services,
7.7%
Beverage,
44.7%
1H 2021 Rental Reversion
Fashion /
1H 2021 Year 1 rents vs Incoming average rents vs Fashion
Retention Rate(2) outgoing average rents Accessories,
outgoing final rents(3)
27.1%
82.5% q9.1% q4.5%
1H 2021 Gross Turnover Rent
(4)
Within range of 5% to 7%
Notes:
(1) Retail occupancy includes retail only properties and the retail components within integrated developments.
(2) Based on number of renewed vs expiring leases.
(3) Typically includes annual step-ups.
(4) Based on retail gross revenue. 24Retail
Retail committed occupancy at 97.0%(1)
Above Singapore retail occupancy rate of 91.5%(2) for 2Q 2021 based on URA’s island-
wide retail space vacancy rate
99.9%99.9% 99.4%100.0% 98.4% 97.3% 99.9% 99.9% 99.0% 97.9% 99.3% 99.1% 99.2% 99.7% 98.2% 96.9% 97.1%98.0% 98.7% 98.0% 96.9% 97.3%
94.2% 94.2%
90.9%92.3%
84.7% 82.9%
As at 31 March 2021 As at 30 June 2021
Notes:
(1) Retail occupancy includes retail only properties and the retail components within integrated developments.
(2) Singapore retail occupancy rate was 91.5% for 1Q 2021 based on URA’s island-wide retail space vacancy rate.
(3) Clarke Quay’s occupancy was due to leases affected by government-stipulated restrictions on trading hours and sales of alcohol at nightlife venues like clubs, karaoke joints and bars without food licenses.
(4) Comprises JCube and Bukit Panjang Plaza. 25Retail
1H 2021 rental reversion decline rate eased
compared to 2H 2020
From 1 January to 30 June 2021 (Excluding Newly Created and Reconfigured Units)(1)
Net Lettable Area
Change in Incoming Year 1 Rents vs
No. of Renewals / Retention Rate
Properties Percentage of retail Outgoing Final Rents (typically
New Leases (%) Area (sq ft)
portfolio (%) includes annual step-ups) (%)(2)
Suburban(3) 233 82.4 324,298 14.8 (4.6)
Downtown(4) 156 82.7 218,840 9.8 (15.5)
CICT Portfolio 389 82.5 543,138 12.1 (9.1)
From 1 January to 30 June 2021 (Excluding Newly Created and Reconfigured Units)(1)
Net Lettable Area
No. of Renewals / New Retention Rate Change in Incoming Average Rents
Properties Percentage of retail
Leases (%) Area (sq ft) vs Outgoing Average Rents (%)(2)
portfolio (%)
Suburban(3) 233 82.4 324,298 14.8 (1.4)
(4)
Downtown 156 82.7 218,840 9.8 (8.8)
CICT Portfolio 389 82.5 543,138 12.1 (4.5)
Notes:
(1) Based on retail leases only.
(2) Exclude gross turnover rents, which typically made up 5-7% of retail gross rental revenue.
(3) Suburban properties comprise Tampines Mall, Bedok Mall, Junction 8, Lot One Shoppers’ Mall, Bukit Panjang Plaza, IMM Building, Westgate and JCube.
(4) Downtown properties comprise Plaza Singapura, The Atrium@Orchard, Bugis Junction, Bugis+, Clarke Quay, Raffles City Singapore and Funan.
26Retail
Retail lease expiry profile(1)
Weighted Average Lease Expiry
By Monthly Gross Rental Income 1.9 Years
Total Retail Portfolio Lease Expiry Profile as at 30 June 2021
34.5%
6.9%
23.7%
20.2%
16.2%
12.6% 4.7% 4.3%
2021 2022 2023 2024 2025 2026 and beyond
Completed Under Negotiation Gross Rental Income
Note:
(1) Based on committed leases in retail properties and retail components in Integrated Development.
27Retail
Tenants’ sales continues to outpace shopper
traffic in 1H 2021
Update: Shopper traffic continued to witness a week-on-week improvement in shopper traffic as at 5
September since the start of the two-step easing measures on 10 August
Recovery levels for tenants’ sales and shopper traffic Recovery Progress
at CICT retail portfolio vs average for 2019
Comparing 1H 2021
150% Suburban Downtown
Start of Circuit Start of Phase 3 information with (1) 2019 Portfolio
Breaker average and (2) year-on- Mall Mall
Average
2019 average monthly year basis Average Average
shopper traffic / Start of Phase Start of
tenants sales psf 1 and 2 Phase 2 (HA)
2019
100% 86.3% 94.1% 75.7%
1H 2021 Average
Tenants’
Sales
Year-on-
psf(1)
year 105.3% 104.3% 106.8%
50% (1H 2020)
2019
61.3% 65.1% 56.9%
Average
1H 2021
0% Shopper
1Q 2Q 3Q 4Q 1Q 2Q Traffic Year-on-
2020 2020 2020 2020 2021 2021 year 104.2% 101.6% 107.7%
(1H 2020)
Tenant Sales $psf/month Shopper Traffic
Note:
(1) Adjusted for non-trading days.
28Retail
1H 2021 tenants’ sales improved Y-o-Y on low
base effect
Top five trade categories(1) : 1H 2021 tenants’ sales $ psf / month(2) 4.3% Y-o-Y
(by gross rental income for retail segment)
Percentage of total retail gross rental income(3) > 68%
46.6% 1H 2021 Tenants’ Sales by Trade Categories
Y-o-Y Variance of Tenants’ Sales $ psf/month (%)
27.5% 25.6%
20.5%
15.6% 13.0%
5.7% 5.6% 5.4% 3.1%
-2.3% -2.5% -6.0%
-19.8%
-42.0%
Services (3)
(4)
Books & Stationery
Education
Sporting Goods
Beauty & Health
Home Furnishing
Jewellery & Watches
Fashion
IT & Telecommunications
Food & Beverages
Shoes & Bags
Department Store
Leisure & Entertainment
Supermarket
Electrical & Electronics
Notes:
(1) The top five trade categories include Food & Beverage, Beauty & Health, Fashion, Supermarket and IT & Telecommunications.
(2) For the period January to June 2021. Excludes gross turnover rent.
(3) Includes convenience stores, bridal shops, optical shops, film processing shops, florists, magazine stores, pet shops, travel agencies, cobblers/locksmiths, laundromats and clinics.
(4) Leisure & Entertainment was impacted by government-stipulated restrictions on trading hours and sales of alcohol at nightlife venues like clubs, karaoke joints and bars without food licenses. 29Office
Office performance overview
Singapore and Germany office assets Increase in leasing enquiries for relocation and
consolidation Q-o-Q(4)
Office Total New and Renewal Leases (sq ft)
Occupancy(1) 6%
186,100 10%
2% 21%
93.0% 2Q 2021 42% 18%
as at 30 Jun 2021 (New leases: 25.9%(2))
55%
46%
Singapore office assets
1Q 2021 2Q2021
Office Average Return of office
Occupancy(1) SG Office Rent(3) community for week Relocation Expansion Consolidation New set-up
ended 3 Sep 2021
92.4% S$10.25psf 37.3% Top three business sectors by space requirement
1) Banking, Insurance and Financial Services
as at 30 Jun 2021 as at 30 Jun 2021 2) IT, Media and Telecommunications
(CBRE SG Core CBD 3) Hospitality
occupancy: 92.1%)
Notes:
(1) Based on committed occupancy as at 30 June 2021.
(2) NLA of new leases in 2Q 2021 is approximately 48,100 square feet, including Raffles City Tower and One George Street. Trade sectors of new committed leases in Singapore are mainly from IT, Media
and Telecommunications, Financial Services and Food and Beverage.
(3) Excludes Funan and The Atrium@Orchard. If including Funan and The Atrium@Orchard, the average Singapore office rent would be S$9.94 psf.
(4) Observation based on leasing enquiries seen in CICT’s office portfolio. Percentages were based on required space and intention indicated by prospects and does not take into account their existing
space.
30Office
Occupancy rate of office portfolio at 93.0%
Occupancy for Singapore: Occupancy for Germany:
CICT’s office portfolio: 92.4% CICT’s portfolio: 95.5%
(4)
CBRE SG Core CBD: 92.1% Frankfurt Market: 93.3%
97.4% 96.0% 96.8% 96.8% 100.0% 100.0% 97.9% 96.9% 100.0% 100.0% 100.0% 100.0% 100.0% 100.0%
95.5% 94.9% 95.1% 92.3% 92.5%
84.7%
78.2% 78.3%
(1) (2) (3)
Asia Square Tower CapitaGreen Capital Tower Six Battery Road 21 Collyer Quay One George Street Raffles City Tower Funan (Office) The Atrium@ Gallileo Main Airport
2 Orchard (Office) Center
As at 31 Mar 2021 As at 30 Jun 2021
Notes:
(1) Lower occupancy due to the lease expiry of an anchor tenant, Allianz in 2Q 2021, backfilling in progress
(2) Six Battery Road’s occupancy expected to remain as such until partial upgrading is completed in phases. Excluding AEI space, committed occupancy is at 96.0%.
(3) WeWork has leased the entire NLA of 21 Collyer Quay on a gross rent basis and the expected start date will be from late 2021.
(4) Frankfurt office market occupancy as at 2Q 2021.
31Office
Office rents committed above market levels
Market Rents of
Average Committed Comparative Sub-Market (S$)
Building Expired Rents Rents in 2Q 2021 Sub-Market
(S$) (S$) Cushman &
Knight Frank(2)
Wakefield(1)
Grade A
Asia Square Tower 2 12.01 11.10 – 13.00 9.54 9.00 – 9.50
Raffles Place
Grade A
CapitaGreen 11.41 10.50 – 13.30 9.54 9.00 – 9.50
Raffles Place
Grade A
Six Battery Road 11.91 10.85 – 12.80 9.54 9.00 – 9.50
Raffles Place
Grade A
One George Street 9.45 9.50 – 10.20 9.54 9.00 – 9.50
Raffles Place
City Hall/ Marina
Raffles City Tower 9.76 9.25 – 10.00 9.18 8.50 – 9.00
Centre
Notes:
(1) Source: Cushman & Wakefield 2Q 2021.
(2) Source: Knight Frank 2Q 2021
For reference only: CBRE Pte. Ltd.’s 2Q 2021 Grade A core CBD rent is S$10.50 psf per month and they do not publish sub-market rents.
32Office
Proactively engaged with tenants to manage
their requirements
Weighted Average Lease Expiry 2.7 Years
By Monthly Gross Rental Income
Total Office Portfolio(1) Lease Expiry Profile as at 30 June 2021
0.2% 0.1% 27.0%
24.6%
18.4% 18.0%
15.2% 15.6% 18.5% 13.7%
13.1% 26.1% 26.8% 11.5%
6.9% 7.7%
(2)
10.3% 9.0%
9.0%
(2)
10.3%
(3)
2021 2022 2023 2024 2025 2026 and beyond
Completed Under Negotiation Monthly Gross Rental Income Net Lettable Area
Notes:
(1) Includes Raffles City Tower, Funan (office), The Atrium@Orchard (office), Gallileo and Main Airport Center’s leases; and expected start date of WeWork’s 7-year lease at 21 Collyer Quay from
late 2021.
(2) Includes JPM’s lease which constitutes 3% of total office NLA.
(3) The existing lease with Commerzbank is due to expire in January 2029 but there is an option for the bank to terminate the lease in 2024 with a 24-month notice. Commerzbank has exercised its
rights to terminate the existing lease by January 2024. The CICT manager is exploring plans for the building to commence in 2024 after the departure of the bank. 33Office
Addressing tenant space and leasing
requirements with flexibility and optionality
2Q 2021 Grade A office market rent at S$10.50 psf per month (1)
2021
(2)
Average rent of leases expiring is S$10.11 psf
20% 16
13.49
11.55
15% 10.28 12
8.41
10% 8
5% 4
3.1% 3.2%
2.3%
0.8%
0% 0
Asia Square Tower Capital Tower CapitaGreen Six Battery Road
2 (3)
Average monthly gross rental rate for expiring leases (S$ psf / month)
Monthly gross rental income for leases expiring at respective properties X 100%
Monthly gross rental income for office portfolio
Notes:
(1) Source: CBRE Pte. Ltd. as at 2Q 2021.
(2) Four Grade A buildings only.
(3) Excludes ancillary retail leases.
Total percentage may not add up due to rounding.
34Office
Continue to proactively manage major leases
and backfill space
2022 2023
(1) (1)
Average rent of leases expiring is S$9.19 psf Average rent of leases expiring is S$11.03 psf
20% 16 20% 16
12.19
11.87
11.03 11.32 11.12
15% 12 15% 10.71 12
8.56
10% 8 10% 8
6.16
5.0% 4.6%
5% 4 5% 3.9% 3.7% 4
3.3% 3.3%
2.1%
0.3%
0% 0 0% (2)
0
Asia Square Tower 2 (2) Capital Tower CapitaGreen Six Battery Road Asia Square Tower 2 Capital Tower CapitaGreen Six Battery Road
Average monthly gross rental rate for expiring leases (S$ psf / month)
Monthly gross rental income for leases expiring at respective properties X 100%
Monthly gross rental income for office portfolio
Notes:
(1) Four Grade A buildings only.
(2) Excludes ancillary retail leases.
35Integrated Development
Occupancy rate of Integrated Developments
at 96.5%
99.0% 98.4% 98.5% 97.9%
92.8% 93.6%
Raffles City Singapore (1) Funan (2) Plaza Singapura & The Atrium@
Orchard(3)
As at 31 March 2021 As at 30 June 2021
Notes:
(1) Retail occupancy is 92.3% and office occupancy is 95.1% as at 30 June 2021.
(2) Retail occupancy is 97.3% and office occupancy is 100.0% as at 30 June 2021.
(3) Retail occupancy is 97.1% and office occupancy is 100.0% as at 30 June 2021.
36Integrated Development
Lease expiry profile(1) as at 30 June 2021
Weighted Average Expiry
5.0 Years
by Monthly Gross Rental Income
23.9%
3.4%
16.7%
10.1% 10.4% 10.3%
9.0%
5.3%
Retail 6.5%
3.6% 4.3%
3.3%
2.2%
0.5% 0.4%
Office
2021 2022 2023 2024 2025 2026 and
beyond
Retail Office Hospitality Under Negotiation
Note:
(1) Excluding retail turnover rents.
37Creating Value
CapitaSpring (under development)Ongoing AEIs on track to complete in 2H 2021
Work in progress for plans to reposition other assets
SIX BATTERY ROAD 21 COLLYER QUAY
✓ 7-year lease to WeWork:
✓ Space handed over to tenant
✓ Lease to commence in late 2021
✓ Achieved BCA Green Mark Platinum
LOT ONE SHOPPERS’ MALL
New retail banking hall at through-block link New retail banking hall features café and ATMs
✓ New retail banking hall opened
on 22 June 2021 in through block link
✓ Through-block link includes the new
banking hall and ATMs on one side
and new retail offerings on the other
New library expansion on Level 5 occupying part
of the existing courtyard space
✓ Target AEI completion in end-2021
Offering customers a new banking experience ✓ Cinema and library undergoing
internal fit-out works
✓ Leasing of office space to be in
tandem with phased works
✓ Target to open in 2H 2021
39Strengthening our omnichannel retail ecosystem
through phygital engagements with CapitaStar
Support tenants’ marketing channels and More than
1 Popular Malls Favourite Brands
address evolving shoppers’ preferences 1.1 Million • Bugis Junction • BHG
• CapitaStar platform enabled tenants to have CapitaStar Members
IMM • Hai Di Lao
online presence without hefty set-up cost and • Plaza Singapura • Sephora
have omnichannel outreach to a wider group of More than • Raffles City • Uniqlo
shoppers; 3,000 • Westgate • Watsons
• Tenants are engaged for joint promotions Retailers onboard
• O2O shoppers’ average monthly spend is 29% Total number of eDeals
higher than pure offline shoppers Average Monthly App Redeemed in 2020
• Higher percentage of younger shoppers aged
Traffic
> 13,755,298
20 to 45 years old > 3.5 Million
Top five product and services by 2 Leverage platform to integrate play More than
Gross Merchandise Value: and work for customers’ convenience 6x User Base
• CapitaStar@Work for the office community Since launch in July 2020
1. Food and Beverage - Capita3Eats to leverage CapitaStar platform to offer More than
2. Electronics and Technology more choices of products and services in
3. Women (Fashion, Shoes & addition to its current features 10,000 Visitor
Invited through the App
Accessories)
4. Home and Living
5. Men (Fashion, Shoes & Accessories)
> 1,500
Contactless Access Book Spaces Join Events Safety Lifestyle Features
Self-facial enrolment done
40Supporting tenants through eCapitaMall
& Capita3Eats
More than 600 brands are now onboard since launch in June 2020
• eCapitaMall & Capita3Eats reported growth in Gross Merchandise Value (GMV) by 2.5X and 2.8X
respectively during Phase 2 (Heightened Alert) from 16 May to 13 June 2021
• Waiver of platform and commission fees for existing and new F&B operators who sign up with
Capita3Eats during Phase 2 (Heightened Alert) from 16 May to 13 June 2021 and from 22 July to 18
August 2021
GROWTH SINCE PHASE 2 (HEIGHTENED ALERT)
2.5x 2.8x
Growth Growth
in Gross Merchandise Value in Gross Merchandise Value
ECAPITAVOUCHER UTILIZATION : 44% of total GMV ECAPITAVOUCHER UTILIZATION : 36% of total GMV
Most Popular • Clarins • Lego Most Popular • Nando’s • Red House Seafood
Brands • Muji • Lenovo Brands • Dian Xiao Er • Teahouse by Soup Restaurant
• Gamemartz • Grafunkt • Paris Baguette • Coco Ichibanya
Note:
Figures are as of May 2021 unless indicated otherwise. Comprised 17 CapitaLand malls of which 14 are CICT’s malls 41
41Ensuring
Sustainability
CapitaGreenCICT aligns with CapitaLand’s 2030 Sustainability Master Plan that
outlines targets and pathways for transition to a low-carbon business
CICT’s 2020 Sustainability Highlights
Environment
Build portfolio resilience & resource efficiency All CICT’s properties have green rating
Met FY 2020(1) operational efficiency targets compared to base
year of 2008
Green
Using 2008 as Base Year 2020 Targets Met(1) 2030 Certified, 8.6%
New Targets(2) LEED Gold,
4.0%
Carbon
Emission
▼52.8% Green Mark
vs target of 23% reduction
▼78%
Intensity Platinum,
47.8% Green Mark
Based on Gold, 13.2%
Energy ▼ 35.7%
Intensity vs target of 20% reduction
▼35% portfolio NLA
with green
rating: 11.0
Water ▼ 42.9% million sq ft(3)
Intensity vs target of 20% reduction
▼45%
Achieved 5-star rating in the Global Real Estate Green Mark
Sustainability Benchmark (GRESB) 2020 and ‘A’ for GoldPLUS,
public disclosure 26.4%
Notes:
(1) Overall, FY 2020 energy and water consumption levels were lower due to COVID-19 pandemic and circuit breaker.
(2) In November 2020, Science-Based Targets Initiative (SBTi) approved CapitaLand's emission reduction targets of well below 2oC scenario. CICT is aligned with CapitaLand's science based targets which forms
part of the CapitaLand’s 2030 Sustainability Master Plan.
(3) All properties in Singapore and Germany including CapitaSpring, a property under development. 43CICT aligns with CapitaLand’s 2030 Sustainability Master Plan that
outlines targets and pathways for transition to a low-carbon business
CICT’s 2020 Sustainability Highlights
Social Governance CICT’s inclusion in
sustainability indices
Enable thriving and future- Uphold high standards of corporate
adaptive communities governance • FTSE4Good Developed Index
• FTSE4Good ASEAN 5 Index
Focus on health and safety of Board Board Gender • MSCI Pacific ESG Leaders
stakeholders, high performance Independence (1) Diversity(1) Index
culture for staff and delightful Non-independent,
• iEdge ESG Leaders Index
Female,
customer experiences 30.0% 30.0% • STOXX® Global ESG Leaders
• Global ESG Governance
Leaders
Sustainable finance
Independent, Male,
70.0% 70.0%
• 15% of CICT’s portfolio
• Ranked fifth on Singapore Governance and
Transparency Index 2021(SGTI) (REIT and Business Trust borrowings are
category) green/sustainability-linked as at
• Previously, ranked fourth and seventh positions (under
CCT and CMT respectively) on the Governance Index for
30 June 2021
Trusts 2020 (GIFT) (REIT and Business Trust category)(2)
Notes:
(1) Effective 16 August 2021, with the addition of two new independent, non-executive directors to CICTML Board.
(2) The ranking for GIFT 2021 has not been published. 44Looking Forward
Capital TowerCICT to enhance its resilient ecosystem
amidst uncertainties
In persisting market uncertainties, CICT will continue to:
• Be agile and flexible in managing our portfolio
• Deepen stakeholder engagement
Focus of CICT to • Provide tenants with the appropriate targeted support
enhance the • Leverage technology
resilience of its
• Take proactive steps to adapt and reposition some of the assets
ecosystem
• For 2Q 2021, decline rate for retail rents slowed while Grade A CBD office rents registered an
uptick Q-o-Q in 2Q 2021
• Limited new supply in the retail and office markets to mitigate any softening demand
Singapore
Retail and Office • Poised to benefit from improvement in economic activity and consumer/business sentiment
on the back of the vaccination rollout
Outlook
• 2Q 2021 GDP growth was 14.3% year-on-year(1)
• 2021 GDP growth forecast upgraded to 6-7% from the previous 4-6%(1)
• Overall unemployment rate registered a slight increase, from the 2.7% in June 2021 to 2.8% in
July 2021(2).
Singapore
Economy (1) Source: Ministry of Trade and Industry.
(2) Source: Ministry of Manpower.
46CICT’s value creation strategy
To deliver stable distributions and sustainable returns to unitholders
• Investing through property market
cycles and across geographies
• Undertaking appropriate divestment of
assets that have reached their optimal • Singapore, Germany and other
life cycle developed markets
Portfolio
Acquisition
• Redeploying divestment proceeds into reconstitution
• Guide for overseas exposure not
higher yielding properties or other more than 20% of portfolio value
growth opportunities
• Seeking opportunities from both third
parties and CapitaLand Limited
Asset enhancement
and redevelopments
• Asset class focus: Retail, office and
integrated developments
• Achieving the highest and best use for properties
• Repositioning or repurposing single use assets in line with changing real
estate trends and consumers’ preferences
• Redeveloping properties from single use to integrated projects
47Market
Information
Raffles City SingaporeRetail
CICT Market Share
Largest owner of private retail stock in Singapore(1)
CICT, 9.2%
Frasers Centrepoint Trust, 4.4%
Mercatus, 4.3%
Far East Organization, 3.3%
Lendlease, 3.0%
Mapletree Commercial Trust, 2.4%
City Developments Limited, 2.2%
Others/Unknown,
65.3% Changi Airport Group, 2.0%
United Industrial Corporation Limited, 2.0%
Suntec REIT, 1.9%
Notes:
(1) Based on the total private stock recorded by Urban Redevelopment Authority (URA).
Sources: URA, CBRE Singapore, 4Q 2020
49Retail
Limited retail supply between 2021 and 2024
• Total retail supply in Singapore averages approximately 0.4 million sq ft (2021 - 2024),
significantly lower than:
― Last 3-year historical annual average supply (2018 - 2020) of 0.86 million sq ft
― Last 5-year historical annual average supply (2016 - 2020) of 1.1 million sq ft
Singapore Retail Supply (million sq ft)
0.7 0.676
0.097
0.6
0.5
0.412
0.4
0.332
0.3 0.055 0.24 0.542
0.2 0.134
0.279
0.1 0.088 0.117
0.024 0.055
0 0.032 0.038
2021 2022 2023 2024
Orchard Downtown Core Fringe Suburban Rest of Central
Source: CBRE Singapore, 2Q 2021
50Retail
Known future retail supply in Singapore (2021 – 2024)
None of the seven new projects with more than 100,000 sq ft NLA are located in Downtown
Expected Proposed Retail Projects Location NLA (sq ft)
completion
2021 Grantral Mall @ Macpherson (Citimac A&A) Macpherson Road 67,500
2021 I12 Katong (A/A) East Coast Road 211,500
Subtotal (2021): 279,000
2022 Boulevard 88 Cuscaden Road/Orchard Boulevard 32,000
2022 Shaw Plaza Balestier(A/A) Balestier Road 67,500
2022 Sengkang Grand Mall Sengkang Central 109,000
2022 Guoco Midtown Beach Road 24,300
2022 Komo Shoppes Upper Changi Road North/Jalan Mariam 24,800
2022 Club Street Retail/Hotel Development Club Street 33,300
2022 Wilkie Edge (A/A) Wilkie Road 21,200
2022 Le Meridien Singapore (A/A) Beach View 20,500
Subtotal (2022): 332,600
2023 IOI Central Central Bouelvard 30,000
2023 One Holland Village Holland Road 117,000
2023 Dairy Farm Residences Dairy Farm Road 32,300
2023 The Woodleigh Mall Bidadari Park Drive / Upper Aljunied Road 208,000
2023 Odeon Towers (A/A) North Bridge Road 25,000
Subtotal (2023): 412,300
2024 Pasir Ris 8 Pasir Ris Drive 289,900
2024 Mixed-use at Punggol Way Punggol Way 184,900
2024 T2 Airport (A/A) Airport Boulevard 67,000
2024 Labrador Villa Road Labrador Park 37,700
2024 Liang Court Redevelopment River Valley Road 96,900
Subtotal (2024): 676,400
Total forecast supply (2021-2024) 1,700,300
Sources: URA and CBRE Research, 2Q 2021
51Retail
Suburban rents rose by 1% while Orchard rents
declined by 1% Q-o-Q in 2Q 2021
Singapore Retail Rents and Quarterly GDP Growth
15.0% $40.00
$35.00
10.0%
$30.00
5.0%
$25.00
0.0% $20.00
$15.00
Q1 2021 (1)
-5.0%
Q1 2011
Q1 2014
Q1 2017
Q1 2010
Q2 2010
Q3 2010
Q4 2010
Q2 2011
Q3 2011
Q4 2011
Q1 2012
Q2 2012
Q3 2012
Q4 2012
Q1 2013
Q2 2013
Q3 2013
Q4 2013
Q2 2014
Q3 2014
Q4 2014
Q1 2015
Q2 2015
Q3 2015
Q4 2015
Q1 2016
Q2 2016
Q3 2016
Q4 2016
Q2 2017
Q3 2017
Q4 2017
Q1 2018
Q2 2018
Q3 2018
Q4 2018
Q1 2019
Q2 2019
Q3 2019
Q4 2019
Q1 2020
Q3 2020
Q4 2020
Q2 2021
Q2 2020
$10.00
-10.0%
$5.00
-15.0% $0.00
GDP Q/Q growth Orchard Suburban Linear (GDP Q/Q growth)
Notes:
(1) CBRE revised its basket of prime retail properties since 1Q 2021 by removing some of the older malls in Orchard Road.
Sources: CBRE and Department of Statistics Singapore.
52Retail
Singapore retail sales performance
Retail sales on a positive trajectory
(S$ billion)
4.0 30.0%
3.5 26.2%
3.5 3.6 25.0%
3.0 3.1 3.2
21.0%
20.0% 2.8 2.9 2.9 2.9 20.0%
2.8 2.8 2.8 2.8 2.8
2.5 2.7 2.7
2.6
16.3%
16.1% 18.4% 16.2%
2.3
2.0 15.0%
13.4%
2.0 13.3%
12.4% 14.4%
1.5 1.7 12.6% 12.7% 12.5%
11.7%
10.5% 12.0%
10.0%
9.0%
1.0
6.3%
5.0%
0.5
0.0 0.0%
Y-o-Y +0.6% -10.2% -9.7% -32.8% -45.2% -24.2% -7.7% -8.4% -12.7% -11.2% -2.9% -4.5% -8.4% +7.7% +4.4% +39.2% +61.6% +19.0% +2.0%
Feb 2020
Aug 2020
Feb 2021
Jul 2020
Nov 2020
Dec 2020
Jul 2021
May 2020
May 2021
Mar 2020
Mar 2021
Jan 2020
Apr 2020
Sep 2020
Oct 2020
Jan 2021
Apr 2021
Jun 2020
Jun 2021
Retail Sales (excl. motor vehicles) Online Sales Proportion
Source: Department of Statistics Singapore
53Office - Singapore
Singapore office stock as at end-2Q 2021
Island-wide office stock
Singapore Stock % of Grade A office
(sq ft) total Core CBD
Decentralised, Core CBD, stock
23.36% 50.67%
Core CBD 31.4 mil 50.67% 14.1 mil sq ft
(45.08% of Core
CBD stock)
Fringe CBD 16.1 mil 25.97%
Decentralised 14.5 mil 23.36%
Total 61.7 mil (22.84% of total
Fringe CBD,
island wide stock)
25.97%
Source: CBRE, 2Q 2021
Figures may not add up due to rounding.
54Office - Singapore
Annual new supply averages 0.7 mil sq ft over 5 years;
CBD Core occupancy at 92.1% as at end-June 2021
Singapore Private Office Space (Central Area)(1) – Net Demand & Supply
2.5
2.2 Forecast average annual gross new supply
1.9 (2021 to 2025): 0.7 mil sq ft
2.0 1.8 1.9
1.6 1.6 1.7
Includes
1.5 1.4 CapitaSpring
1.3
1.0 1.0
sq ft million
1.0 0.8 0.8
0.7 0.7 0.8 0.7
0.6
0.5 0.3 0.3 0.3
0.2 0.2 0.2 0.2 0.2
0.0
-0.03
-0.5
-0.5
2010 2011 2012 2013 2014 2015 2016 2017 2018 2019 2020 1H 2021 2021F 2022F 2023F 2024F
-1.0
Net Supply Net Demand Forecast Supply
Periods Average annual net supply(2) Average annual net demand
2011 – 2020 (through 10-year property market cycles) 0.8 mil sq ft 0.9 mil sq ft
2016 – 2020 (through 5-year property market cycles) 1.0 mil sq ft 0.9 mil sq ft
2021 – 2025 (forecast gross new supply) 0.7 mil sq ft N.A.
Notes:
(1) Central Area comprises ‘The Downtown Core’, ‘Orchard’ and ‘Rest of Central Area’.
(2) Supply is calculated as net change of stock over the quarter and may include office stock removed from market due to conversi ons or demolitions.
Sources: Historical data from URA statistics as at 2Q 2021; Forecast supply from CBRE Research as at 2Q 2021.
55Office - Singapore
Known future office supply in Central Area (2021 – 2024)
No commercial sites(1) on Government Land Sales Confirmed List (10 Jun 2021); Two white sites (2) on
reserve list, namely Kampong Bugis and Woodlands Ave 2 (Fringe Area)
Expected Proposed Office Projects Location NLA (sq ft)
completion
2021 CapitaSpring(3) Raffles Place 635,000
Subtotal (2021): 635,000
2022 Hub Synergy Point Redevelopment Tanjong Pagar 131,200
2022 Guoco Midtown Beach Road / City Hall 650,000
Subtotal (2022): 781,200
2023 Central Boulevard Towers Marina Bay 1,258,000
2023 333 North Bridge Road Beach Road / City Hall 40,000
Subtotal (2023): 1,298,000
2024 Keppel Towers Redevelopment Tanjong Pagar 526,100
2024 Shaw Towers Redevelopment Beach Road / City Hall 435,600
Subtotal (2024): 961,700
Total forecast supply (2021-2024) 3,675,900
Notes:
(1) URA has released the Marina View site for sale by public tender on 28 June 2021, deadline for submission of bids by 21 September 2021. Details of the Marina View white site: Site area of 0.78 ha, gross
plot ratio of 13.0; estimated 905 housing units, 540 hotel rooms and 2,000 sqm commercial space (on reserve list since 4Q 2018).
(2) Details of the two white sites: (a) Kampong Bugis: GFA of 390,000 sqm; up to 4,000 housing units and commercial GFA of 10,000 sqm (on reserve list since 4Q 2019);
(b) Woodlands Ave 2: Site area of 2.75 ha, gross plot ratio of 4.2; estimated 440 housing units, 78,000 sqm commercial space (on reserve list since 4Q 2018).
(3) CapitaSpring reported committed take-up at 61.8% of the development’s NLA as at 22 July 2021.
Sources: URA, CBRE Research as at 2Q 2021 and respective media reports.
56Office - Singapore
Grade A office rent rose Q-o-Q in 2Q 2021
1Q 19 2Q 19 3Q 19 4Q 19 1Q 20 2Q 20 3Q 20 4Q 20 1Q 21 2Q 21
Mthly rent (S$ / sq ft ) 11.15 11.30 11.45 11.55 11.50 11.15 10.70 10.40 10.40 10.50
change 3.2% 1.3% 1.3% 0.9% -0.4% -3.0% -4.0% -2.8% 0% 1.0%
$20
S$18.80
$18
Monthly gross rent by per square foot
$16
S$11.55
$14 S$11.06 S$11.40
$12
$10
S$10.50
$8
$6
S$9.55 S$8.95
$4 S$8.00
$2
S$4.48
Global financial Euro-zone
Post-SARs, Dot.com crash crisis crisis
$0
1Q02
2Q02
3Q02
4Q02
1Q03
2Q03
3Q03
4Q03
1Q04
2Q04
4Q04
1Q05
3Q05
4Q05
2Q06
3Q06
4Q06
1Q07
2Q07
3Q07
4Q07
1Q08
2Q08
3Q08
4Q08
1Q09
2Q09
3Q09
4Q09
1Q10
2Q10
3Q10
1Q11
2Q11
4Q11
1Q12
3Q12
4Q12
1Q13
2Q13
3Q13
4Q13
1Q14
2Q14
3Q14
4Q14
1Q15
2Q15
3Q15
4Q15
1Q16
3Q16
4Q16
2Q17
3Q17
1Q18
2Q18
3Q18
4Q18
1Q19
2Q19
3Q19
4Q19
1Q20
2Q20
3Q04
2Q05
1Q06
4Q10
3Q11
2Q12
2Q16
1Q17
4Q17
3Q 20
4Q 20
1Q 21
2Q 21
Source: CBRE Research (figures as at end of each quarter).
57Office - Germany
Information on Frankfurt and two submarkets
('000 sqm)
Frankfurt Office (%)
800.0 16.0
700.0 14.0
600.0 12.0
500.0 10.0
400.0 8.0
6.7
300.0 6.0
200.0 4.0
100.0 2.0
0.0 0.0
2015 2016 2017 2018 2019 2020 YTD June 2021
Demand ('000 sqm) New Supply ('000 sqm) Vacancy rate (%)
Banking District (%) (‘000 sqm) (%)
(‘000 sqm) Airport Office District
800 16.0
800 16
700 14.0 700 14
600 12.0 600 12
500 10.0 500 10
400 8.0 400 8
300 6.0 300 5.9 6
4.9
200 4.0 200 4
100 2.0 100 2
0 0.0 0 0
2015 2016 2017 2018 2019 2020 YTD June 2015 2016 2017 2018 2019 2020 YTD June
2021 2021
Note: Supply for Banking District and Airport Office District is as at 4Q 2020.
Source: CBRE Research, 2Q 2021.
58Office - Germany
New office supply in Frankfurt
About 68% and 35% of 2021F and 2022F new supply are owner-occupied or committed
(‘000 sq m)
300
Actual New Supply Forecast New Supply
250
200
5-Year (2016-2020) Average: 145,960 sq m
150
100
50
0
2012 2013 2014 2015 2016 2017 2018 2019 2020 2021F 2022F
Banking District New Supply Airport Office District New Supply Rest of Frankfurt New Supply
Source: CBRE Research, Frankfurt 4Q 2020.
59Office - Germany
Rental range in Frankfurt
Rental range by submarket
Frankfurt
West City CBD
(€ / square metre / month)
C
Westend B
44.0 44.0
D Gallileo
41.73
Banking 27.0
District
23.36
19.93
A5
B43
Niederrad
South
18.0 22.0
7.0
MAC A3 Frankfurt Frankfurt
Airport Office Frankfurt Total
Banking District
District
A (Region D)
(Region A)
ICE S-Bahn Expressway / Highway Weighted average
Source: CBRE Research, 2Q 2021
60Thank you
For enquiries, please contact: Ms Ho Mei Peng, Head, Investor Relations
Direct: (65) 6713 3668 | Email: ho.meipeng@capitaland.com
CapitaLand Integrated Commercial Trust Management Limited (http://www.cict.com.sg)
168 Robinson Road, #25-00 Capital Tower, Singapore 068912
Tel: (65) 6713 2888 | Fax: (65) 6713 2999Additional
Information
The Atrium@Orchard1H 2021 gross revenue(1)
Majority of the portfolio registered year-on-year increase
97.7
93.1
(S$ m)
50.7
46.9
42.7 40.2
38.3 36.1 36.9 34.9 35.0
30.9
28.4
31.3 28.4 31.5 26.5
30.3
27.5
23.8 26.2 23.8 22.5 22.4
21.8
19.3 19.1
16.0 14.4
14.5 12.6 13.7 13.2
(2)
6.9 4.3
(5)
Other Assets (3)
(4)
Funan
Raffles City Singapore
Gallileo
Tampines Mall
Westgate
Clarke Quay
Bedok Mall
CapitaGreen
Bugis+
Six Battery Road
Junction 8
Asia Square Tower 2
Capital Tower
21 Collyer Quay
Main Airport Center
Lot One Shoppers' Mall
IMM Building
Bugis Junction
Plaza Singapura
The Atrium@Orchard
1H 2020 1H 2021 1H 2020 1H 2021 1H 2021
Notes:
(1) Income contribution from office assets is from 21 October 2020 onwards and excludes One George Street, a joint venture.
(2) Clarke Quay’s leisure and entertainment tenants continued to be impacted by prolonged and stricter COVID-19 measures in 1H 2021.
(3) Comprises JCube and Bukit Panjang Plaza.
(4) For comparable basis, the income contribution from Raffles City Singapore for 1H 2020 is on a 100.0% basis and for illustration only. Actual income contribution from Raffles City Singapore for 1H 2020 was
40.0% as it was a joint venture of CICT prior to the merger. For 1H 2021, income contribution from Raffles City Singapore is on a 100.0% basis.
(5) Refers to amortised rent upon handover of property to tenant.
631H 2021 operating expenses(1)
Higher operating expenses mainly from higher property management fees and property
management reimbursements excluding effects of the merger
23.4
(S$ m) 22.1
11.8 12.0 11.6
10.0 9.9 10.8
9.7 10.2 9.3 9.6 9.5 9.9
9.2
7.9 7.7 7.8 8.7
7.5 7.7
6.7 6.5 6.7
5.8 6.2 5.6 5.2 5.7 5.8
4.3 4.1 4.7
2.4
1.6
Other Assets(2)
Raffles City Singapore(3)
Funan
Lot One Shoppers' Mall
Bugis Junction
Clarke Quay
Bedok Mall
Bugis+
Junction 8
Tampines Mall
Westgate
IMM Building
CapitaGreen
Gallileo
Six Battery Road
Asia Square Tower 2
Capital Tower
21 Collyer Quay
Main Airport Center
Plaza Singapura
The Atrium@Orchard
1H 2020 1H 2021 1H 2020 1H 2021 1H 2021
Notes:
(1) Operating expenses from office assets is from 21 October 2020 onwards and excludes One George Street, a joint venture.
(2) Comprises JCube and Bukit Panjang Plaza.
(3) For comparable basis, the operating expenses from Raffles City Singapore for 1H 2020 is on a 100.0% basis and for illustration only. Actual operating expenses from Raffles City Singapore for 1H 2020
was on a 40.0% basis as it was a joint venture of CICT prior to the merger. For 1H 2021, operating expenses from Raffles City Singapore is on a 100.0% basis.
641H 2021 net property income(1) 75.6
(S$ m)
69.7
39.1 37.7
30.7
28.1 29.4
24.3 27.0 25.0 26.3
20.7 21.3 21.9 20.8
21.2 19.7 19.1 18.7 20.8
16.3 15.1 16.1 16.8 16.6
13.1 11.2
10.2 9.6 12.0
8.9 8.3 8.5
1.7
(2) 2.7
Raffles City Singapore (4)
Other Assets (3)
Funan
Gallileo
CapitaGreen
Tampines Mall
Westgate
Six Battery Road
Capital Tower
21 Collyer Quay
Main Airport Center
Clarke Quay
Bedok Mall
Asia Square Tower 2
Bugis+
Junction 8
Lot One Shoppers' Mall
IMM Building
Bugis Junction
Plaza Singapura
The Atrium@Orchard
1H 2020 1H 2021 1H 2020 1H 2021 1H 2021
Notes:
(1) Income contribution from office assets is from 21 October 2020 onwards and excludes One George Street, a joint venture.
(2) Clarke Quay’s leisure and entertainment tenants continued to be impacted by stricter COVID-19 measures in 1H 2021.
(3) Comprises JCube and Bukit Panjang Plaza.
(4) For comparable basis, income contribution from Raffles City Singapore for 1H 2020 is on a 100.0% basis and for illustration only. Actual income contribution from Raffles City Singapore for 1H 2020
was on a 40.0% basis as it was a joint venture of CICT prior to the merger. For 1H 2021, income contribution from Raffles City Singapore is on a 100.0% basis. 65You can also read