Case Study Zero: NTU Student Dashboard - Nottingham Trent University - STELA Erasmus+ project (562167-EPP-1-2015-1-BE-EPPKA3-PI-FORWARD) - STELA ...
←
→
Page content transcription
If your browser does not render page correctly, please read the page content below

Case Study Zero: NTU Student Dashboard

             Nottingham Trent University

STELA Erasmus+ project (562167-EPP-1-2015-1-BE-EPPKA3-PI-FORWARD)
"The European Commission support for the production of this publication does not constitute an en-
dorsement of the contents which reflects the views only of the authors, and the Commission cannot be
held responsible for any use which may be made of the information contained therein."

                                                 2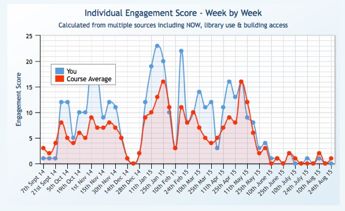
Contents

    Contents

    1 Introduction                                                                                                                                       5
      1.1 Nottingham Trent University . . . . . . . . . . . . . . . . . . . . . . . . . . . . . . . .                                                    5

    2 Transition Support at NTU                                                                                                                          6
      2.1 Welcome Week . . . . . . . . . . . . . . . . .     .   .   .   .   .   .   .   .   .   .   .   .   .   .   .   .   .   .   .   .   .   .   .   6
      2.2 Student Transition Research . . . . . . . . .      .   .   .   .   .   .   .   .   .   .   .   .   .   .   .   .   .   .   .   .   .   .   .   7
      2.3 Recommendations for new student induction          .   .   .   .   .   .   .   .   .   .   .   .   .   .   .   .   .   .   .   .   .   .   .   7
      2.4 Starting at NTU . . . . . . . . . . . . . . . .    .   .   .   .   .   .   .   .   .   .   .   .   .   .   .   .   .   .   .   .   .   .   .   7
      2.5 Student Tutoring . . . . . . . . . . . . . . . .   .   .   .   .   .   .   .   .   .   .   .   .   .   .   .   .   .   .   .   .   .   .   .   7
      2.6 Student Transition Policy . . . . . . . . . . .    .   .   .   .   .   .   .   .   .   .   .   .   .   .   .   .   .   .   .   .   .   .   .   8
      2.7 Attendance monitoring . . . . . . . . . . . .      .   .   .   .   .   .   .   .   .   .   .   .   .   .   .   .   .   .   .   .   .   .   .   8

    3 How learning analytics at NTU fits into the transition landscape                                                                                   9
      3.1 The NTU Student Dashboard . . . . . . . . . . . . . . . . . . . . . . . . . . . . . . . .                                                      9
      3.2 How the Dashboard works . . . . . . . . . . . . . . . . . . . . . . . . . . . . . . . . . .                                                    9

    4 Implementing the NTU Student Dashboard 2015/16                                                                                                     11
      4.1 Introduction . . . . . . . . . . . . . . . . . . . . . . . .           .   .   .   .   .   .   .   .   .   .   .   .   .   .   .   .   .   .   11
      4.2 Project team activity . . . . . . . . . . . . . . . . . . .            .   .   .   .   .   .   .   .   .   .   .   .   .   .   .   .   .   .   11
      4.3 Staff development & communications . . . . . . . . . .                 .   .   .   .   .   .   .   .   .   .   .   .   .   .   .   .   .   .   11
      4.4 Student Communications . . . . . . . . . . . . . . . .                 .   .   .   .   .   .   .   .   .   .   .   .   .   .   .   .   .   .   12
      4.5 Research . . . . . . . . . . . . . . . . . . . . . . . . . .           .   .   .   .   .   .   .   .   .   .   .   .   .   .   .   .   .   .   12
      4.6 Dashboard development . . . . . . . . . . . . . . . . .                .   .   .   .   .   .   .   .   .   .   .   .   .   .   .   .   .   .   12
      4.7 Learning analytics policy development . . . . . . . . .                .   .   .   .   .   .   .   .   .   .   .   .   .   .   .   .   .   .   13
      4.8 Usage and feedback . . . . . . . . . . . . . . . . . . . .             .   .   .   .   .   .   .   .   .   .   .   .   .   .   .   .   .   .   13

    5 Implementing the NTU Student Dashboard 2016/17                                                                                                     14
      5.1 Project team activity . . . . . . . . . . . . . . . . . . .            .   .   .   .   .   .   .   .   .   .   .   .   .   .   .   .   .   .   14
      5.2 Staff development & communications . . . . . . . . . .                 .   .   .   .   .   .   .   .   .   .   .   .   .   .   .   .   .   .   14
      5.3 Student Communications . . . . . . . . . . . . . . . .                 .   .   .   .   .   .   .   .   .   .   .   .   .   .   .   .   .   .   14
      5.4 Research . . . . . . . . . . . . . . . . . . . . . . . . . .           .   .   .   .   .   .   .   .   .   .   .   .   .   .   .   .   .   .   14
      5.5 Dashboard development . . . . . . . . . . . . . . . . .                .   .   .   .   .   .   .   .   .   .   .   .   .   .   .   .   .   .   15
      5.6 Learning analytics policy development . . . . . . . . .                .   .   .   .   .   .   .   .   .   .   .   .   .   .   .   .   .   .   16
      5.7 Usage and feedback . . . . . . . . . . . . . . . . . . . .             .   .   .   .   .   .   .   .   .   .   .   .   .   .   .   .   .   .   16

    6 Implementing the NTU Student Dashboard 2017/18                                                                                                     18
      6.1 Project team activity . . . . . . . . . . . . . . . . . . .            .   .   .   .   .   .   .   .   .   .   .   .   .   .   .   .   .   .   18
      6.2 Staff development & communications . . . . . . . . . .                 .   .   .   .   .   .   .   .   .   .   .   .   .   .   .   .   .   .   18
      6.3 Student Communications . . . . . . . . . . . . . . . .                 .   .   .   .   .   .   .   .   .   .   .   .   .   .   .   .   .   .   18
      6.4 Research . . . . . . . . . . . . . . . . . . . . . . . . . .           .   .   .   .   .   .   .   .   .   .   .   .   .   .   .   .   .   .   19
      6.5 Dashboard development . . . . . . . . . . . . . . . . .                .   .   .   .   .   .   .   .   .   .   .   .   .   .   .   .   .   .   19
      6.6 Learning analytics policy development . . . . . . . . .                .   .   .   .   .   .   .   .   .   .   .   .   .   .   .   .   .   .   19
      6.7 Usage and feedback . . . . . . . . . . . . . . . . . . . .             .   .   .   .   .   .   .   .   .   .   .   .   .   .   .   .   .   .   20

                                                        3
Contents
7 How the Dashboard has changed the transition experience at NTU 21
7.1 New student induction . . . . . . . . . . . . . . . . . . . . . . . . . . . . . . . . . . . . 21
7.2 Students managing their own engagement . . . . . . . . . . . . . . . . . . . . . . . . . 22
7.3 Academic/ personal tutoring . . . . . . . . . . . . . . . . . . . . . . . . . . . . . . . . . 22
8 Case Study Zero - Key Lessons 24
8.1 Mission & Governance . . . . . . . . . . . . . . . . . . . . . . . . . . . . . . . . . . . . 24
8.2 Data . . . . . . . . . . . . . . . . . . . . . . . . . . . . . . . . . . . . . . . . . . . . . . 24
8.3 Product Development . . . . . . . . . . . . . . . . . . . . . . . . . . . . . . . . . . . . 24
8.4 Communication . . . . . . . . . . . . . . . . . . . . . . . . . . . . . . . . . . . . . . . . 25
8.5 Conclusion . . . . . . . . . . . . . . . . . . . . . . . . . . . . . . . . . . . . . . . . . . . 25
9 References 26
Authors 27
A Appendix 1 28
A.1 Detailed report of the NTU Student Transition Survey 2016/17 . . . . . . . . . . . . . 28
A.1.1 Introduction to the Nottingham Trent University Student Transition Survey . . 28
A.1.2 Introduction to the NTU Student Dashboard . . . . . . . . . . . . . . . . . . . 28
A.1.3 The 2017 NTU Student Transition Survey . . . . . . . . . . . . . . . . . . . . . 29
A.1.4 Section 1: Students’ experience of the transition to higher education . . . . . . 30
A.2 Using the NTU Student Dashboard . . . . . . . . . . . . . . . . . . . . . . . . . . . . . 32
A.2.1 Tutors using the Dashboard . . . . . . . . . . . . . . . . . . . . . . . . . . . . . 32
A.2.2 Students using the Dashboard . . . . . . . . . . . . . . . . . . . . . . . . . . . 32
A.2.3 Students’ views on planned upgrades to the Student Dashboard . . . . . . . . . 33
A.2.4 Students’ views on contacting students identified by the Dashboard . . . . . . . 34
A.3 Conclusion and recommendations . . . . . . . . . . . . . . . . . . . . . . . . . . . . . 35
A.3.1 Student transition into the first year . . . . . . . . . . . . . . . . . . . . . . . . 35
A.3.2 NTU Student Dashboard . . . . . . . . . . . . . . . . . . . . . . . . . . . . . . 35
A.3.3 Future changes to the Dashboard . . . . . . . . . . . . . . . . . . . . . . . . . 35
A.4 References . . . . . . . . . . . . . . . . . . . . . . . . . . . . . . . . . . . . . . . . . . 37
B NTU Student Transition Survey 2017 Question Set 38
4Chapter 1. Introduction
Chapter 1
Introduction
The purpose of the case study is to provide a longitudinal report on the way that one institution,
Nottingham Trent University (NTU), has used and developed its learning analytics resource to support
students in transition. The learning analytics resource used is known as the Student Dashboard, based
on the Solutionpath StREAM tool.
In the original bid, it was stated that " NTU would share their experience and improve and extend their
student dashboard based on the project’s results". Furthermore, the project team would " . . . strengthen,
extend and evaluate an existing implementation of learning analytics". It was agreed that having an
existing learning analytics resource would allow the project team to " hit the ground running . . . as
all developments can be efficiently implemented without loss of precious time and the evaluation of
learning analytics interventions can start from the beginning of the project". This case study will
therefore analyse the following academic years: 2015/16, 2016/17, and 2017/18.
1.1 Nottingham Trent University
Nottingham Trent University (NTU) is a large modern university based in three sites in and around
the City of Nottingham, in the East Midlands region of the United Kingdom. It is one of the largest
universities in the UK with approximately 28,000 students studying a range of undergraduate and
postgraduate courses in a wide range of disciplines.
In 2017, the University was awarded University of the Year by Times Higher Education. NTU’s work
on using data and learning analytics was cited by the judges who stated:
" Most striking is the extent to which evidence-based strategies for continual improvement are embedded
across the institution, demonstrated particularly clearly in its pioneering use of learning analytics. This
data-led approach is always tempered with the application of academic expertise, however, and a focus
on providing higher education that transforms the lives of its large and diverse student body . . . Its
adoption and development of learning analytics help to drive engagement and support students who get
into difficulties while also contributing to high student satisfaction and continuation rates."1
In 2015, the University won the Queen’s Anniversary Prize for the quality of its research and in 2017
won the Sunday Times Modern University of the Year.
5Chapter 2. Transition Support at NTU
Chapter 2
Transition Support at NTU
As is the case across the UK higher education sector, staff at NTU recognised that students are
more likely to withdraw during their first year compared to later years (for example, see ECU, 2013).
Furthermore, it was identified that some students were struggling to cope effectively with the transition
from post-secondary (education for 16-18-year olds) into the first year of higher education.
Therefore from 2005 onwards, the institution implemented a series of initiatives to support the student
transition experience. The University’s strategy has been influenced by the work of Cook & Rushton
(2008) who recommend that transition is described in three phases:
• Pre-arrival (activity taking place prior to arriving on campus)
• Initial induction (Freshers week/ induction week/ welcome week)
• Extended induction (the notion that a large part (or all) of the first year should be treated as
part of the induction/ transition process)
Institutional thinking has also been shaped by Kift, Nelson & Clark (2010) whose model defines three
stages of thinking about the first-year experience:
• 1st generation - changes to the curriculum
• 2nd generation - changes to support services/ extra-curricular activity
• 3rd generation - integrated approaches to supporting transition
2.1 Welcome Week
Initial Induction activity (2005 onwards)
In 2005, Nottingham Trent University recognised that there were issues about the way that students
were inducted into the University (Foster, et al., 2014). It was recognised that the new student
experience, particularly the ’Freshers week’ was still largely focused on activities such as drinking
alcohol and joining clubs and societies. Moreover, the first two days involved standing in queues to
complete paperwork, enrol on courses and collect identity cards. In 2005, the nature of the programme
changed: queuing was largely replaced by online enrolment and the first week was replaced by a
" Welcome Week" offering a varied programme of social, sporting, cultural and academic activities.
The essential nature of the offer has remained the same - a large variety of activities is provided
supported by student volunteers with a strong emphasis on creating social opportunities for students
to interact with one another. Teams from across the whole institution, for example Student Support
Services and Accommodation support this process. In 2007, an induction smartphone app was added
to the offer to be replaced in 2015 by an integrated student app.
6Chapter 2. Transition Support at NTU
2.2 Student Transition Research
Pre-arrival, initial induction & extended induction activity (2006 - onwards)
The whole induction/transition process was researched, and staff became involved in the European
First Year Experience Network. Staff development activities were delivered within the University
exploring a rites of passage approach to induction and resources shared with academics stressing Cook
& Rushton’s (2008) work.
2.3 Recommendations for new student induction
Pre-arrival, initial induction & extended induction activity (2008 onwards)
Further work was carried out by the institution to improve the quality of new student induction.
Course induction timetables were analysed and student focus groups carried out to understand better
what students expected and needed from course inductions (Foster, Bell & Salzano, 2008, Foster et
al., 2011, 2014). Five recommendations were developed for new student induction and shared each
year with those staff responsible for course induction:
1. To have opportunities to start making friends and building support networks
2. To understand what learning is like in university
3. To experience authentic learning and have some reassurance that students will be able to cope
4. To be reminded how their course induction will benefit their future plans
5. To have a course induction that allows time for other commitments
The student induction guidance was revised by the project team in 2015/16 and 2017/18 in response
to student feedback from the annual Student Transition Survey and ongoing work with academics and
students.
2.4 Starting at NTU
Pre-arrival activity (2011 onwards)
The University used Cook & Rushton’s (2008) model as a framework for the next development, Starting
at NTU. Starting at NTU is an integrated communication programme designed to support students
in the pre-arrival period. All students are encouraged to log on to their course induction pages to
find out more about the nature of what they will be studying. From 2011 onwards, these resources
included a pre-arrival task drawing upon findings from Keenan (2008). All students are required to
complete a task such as a short research activity or piece of reflective writing to help them prepare for
their first year. These activities are then expected to be used as part of the new student induction.
2.5 Student Tutoring
Initial induction and extended induction activity (2011 onwards)
Each of the University’s nine schools had some form of tutoring in place. In 2011, a centralised
academic tutorial policy was implemented. All first-year students were to be provided with 12 hours
of group tutorials specifically to support their academic transition into higher education. The tutorials
were intended to support the transition process, for example with a focus on socialisation at the start
of the year, moving to explore the curriculum and then focussing on assessment strategies, moving
to the second year and graduate employment later in the year. This strategy was updated during
2016/17.
7Chapter 2. Transition Support at NTU
2.6 Student Transition Policy
Pre-arrival, initial induction & extended induction activity (2012 onwards)
The University developed a transition policy as part of the main learning and teaching strategy to
provide guidance for teaching staff designing the transition into, throughout and beyond the first year.
The overall purpose is to make it clear to staff and students that there is an expectation that students
require helping to make a transition into their course community and to thrive within it.
2.7 Attendance monitoring
Extended induction activity (2014 onwards)
NTU has nine academic schools (faculties) covering a range of disciplines from art & design to science
and technology. Owing to the different disciplinary nature of the subjects, attendance monitoring
has been devolved to schools. In 2014/15 the University implemented an institution-wide attendance
monitoring policy. The overall purpose of the policy is to encourage engagement with the course,
transmit high expectations to students and for the University to improve how it supports student
transition.
The operation of the policy was devolved to school level. The University developed a new attendance
monitoring tool that provided an electronic register and QR code based monitoring system to support
the process.
8Chapter 3. How learning analytics at NTU fits into the transition landscape
Chapter 3
How learning analytics at NTU fits into
the transition landscape
3.1 The NTU Student Dashboard
The NTU Student Dashboard (usually referred to as ’Dashboard’) is a learning analytics resource
developed with technology provider Solutionpath. The overall strategic vision for the Dashboard
evolved slightly over the course of the project, but essentially oriented around the following:
• Student success - if academics, support services or the students themselves can spot students at
risk of failing or underperforming earlier, interventions have a greater chance of success, equally
if a range of useful information is made available to staff, this could be used to improve the
quality of the intervention.
• Sense of belonging - our earlier work as part of the UK National What Works? Student
Retention and Success project (Foster, et al, 2012) showed the importance of improving the
quality of the staff/ student relationship. The team felt that the Dashboard could make it easier
for personal tutors to know more about their students and potentially vice-versa.
• Supporting students’ own learning - a key component of the Dashboard is the capacity for
students to gauge their own activity against their peers. This is an important part of the self-
regulation of learning a facet that may be particularly important for first year students seeking
to understand how to approach learning at university. The team recognised during the project
that the second component (planning and goal setting) needed further development
• Institutional data - the Dashboard has the potential to augment the evaluation of pedagogic
interventions and improve the quality of data reporting. This aspect is less developed compared
to the previous features.
Throughout the project, the Dashboard was designed to be open to both staff and individual students.
Students could only see their own data and a course average for comparison. Staff could see a larger
number of students depending upon their access level, for example, tutors could only see students in
the department they worked, staff in Student Support Services could access data for all university
students.
3.2 How the Dashboard works
The Dashboard essentially draws data from NTU systems, it calculates an overall engagement rating
and presents the data to users (students and staff). It also generates automatic alerts and provides
tutors and support services with a location to store notes recorded during tutorial conversations.
In 2015-16, the Dashboard drew data from five data sources:
• Library loans
9Chapter 3. How learning analytics at NTU fits into the transition landscape
• Virtual Learning Environment (VLE) log ins
• Virtual Learning Environment (VLE) learning room use
• Course work submission through the VLE
• Student card access to academic buildings
The Dashboard granted each student one of four daily engagement scores:
• High
• Good
• Partial
• Low
These scores were based upon how frequently and consistently students engage with the measures
above. In summer 2015 it was agreed to change the name of one of the categories. ’Partial’ replaced
’Satisfactory’ because staff felt that ’satisfactory’ implied that students could relax, rather than be
challenged. This was felt to be particularly important to staff because student attendance was not
included at the time and the Dashboard was at risk of sending different messages to students compared
to their tutors. Importantly, both students and staff saw exactly the same resource. This was done
intentionally as the project team viewed both students and staff as agents in the process.
If a student engaged with none of the resources for 14-days during term time, an alert was sent to
their tutor asking them to intervene. Tutors were able to add notes to the Dashboard to record any
discussions or agreed actions with the students.
The resource had been developed initially in 2013-14 in a pilot study with 500 first year students on
four courses. The resource was implemented across the whole institution in 2014/15. By the end of
2014/15all undergraduate and taught postgraduate students had access to the Dashboard, and 91% of
students had logged in at least once. An early evaluation of the tool showed that there was a strong
association between how frequently staff used it and how useful it was perceived to be by those staff:
92% of staff who used it weekly found it to be ’very useful’ or ’useful’, compared to 29% of those who
had only logged in 1-2 times during the previous year.
10Chapter 4. Implementing the NTU Student Dashboard 2015/16
Chapter 4
Implementing the NTU Student
Dashboard 2015/16
4.1 Introduction
In September 2015/16 a new version of the Dashboard was launched. This version had a number
of developments from the initial version, but was not seen as a fully developed product. During the
2016/17 year NTU worked with Solutionpath on a number of key developments to be incorporated
into a new version of the Dashboard to be available for use at the start of the 2017/18 academic year.
Details of these can be found in the ’Dashboard development’ section below.
4.2 Project team activity
The STELA Project was based in the Student Engagement Team. At the start of the project this team
was located in the Centre for Academic Development & Quality (CADQ). The team’s overall remit
is to find ways to overcome barriers to students participating in their courses, particularly for those
from socially disadvantaged backgrounds. This work included the transition and induction activity
described in this case study. In 2015/16, the team worked on developing the Dashboard resource,
conducting research, promoting the resource to staff and students and developing a policy to govern
the use of learning analytics. The team comprised a manager, a researcher, a project officer and a 3rd
year student placement. The team’s work was overseen by a Dashboard Governance Group chaired
by the Pro-Vice Chancellor Academic. Representatives from each academic school and a range of
professional services attended, received reports on activities, research and set the overall direction for
the project.
4.3 Staff development & communications
Immediately prior to the start of the STELA project (September 2015) the project team delivered a
series of briefing sessions across the academic schools explaining how to use the Dashboard. The focus
of these briefings was:
• Dashboard strategic purpose (retention, belonging, attainment)
• Providing evidence of the relationship between engagement measured in the Dashboard and first
year progression (institution and individual school level)
• Data comparing staff & student log ins by school
• Overview of next developments
• Significant changes to the new version of the Dashboard
11Chapter 4. Implementing the NTU Student Dashboard 2015/16
4.4 Student Communications
Staff were asked to introduce the Dashboard to new students as part of the new student induction and
to update current students during returners’ induction. Further resources were made available on the
current student web pages.
4.5 Research
The focus of research in 2015/16 was to better understand the data on the relationship between student
engagement and progression. This was improved by recruiting a data expert (Dr Rebecca Edwards)
who carried out a detailed analysis of the 2014/15 data in this year.
4.6 Dashboard development
During 2015/16, the upgrades were managed using a formal project management process. NTU
appointed a project manager and business analyst to lead the development within the institution and
Solutionpath managed the development using the in-house development team. The overall process
used essentially a modified form of the Prince 2 project management process, running from Easter to
September 2016. The following modifications were made to the tool:
• Attendance - a simplified version of attendance was displayed in the Dashboard. Staff and
students could see overall attendance since the start of term and attendance specifically for the
past four weeks. Whilst attendance data was visible in the Dashboard, it was not incorporated
into the underlying engagement algorithm. This is because a new attendance monitoring appli-
cation, that was built in-house, was trialled during the 2015/16 academic year. Attendance data
was only available for the four Schools who piloted the new application, so it would not have
been appropriate to incorporate the data into the algorithm at this stage.
• Electronic resources - users could now see the 10 most recently accessed online resources and
the date and time they were accessed. Again, whilst the data was visible in the Dashboard, it
was not incorporated into the algorithm. Instead it was agreed that the two data sources would
be incorporated into the algorithm together, at a later date, to minimise disruption.
• Assessment and Feedback - the Dashboard drew data from the VLE so that students and
staff could see the original submitted coursework and tutor feedback.
• Induction trial (2016/17) - the development was put in place to enable the induction trial
(2016/17) to take place.
• Notes and referrals - a significant improvement was made to the notes functionality so that
referrals to specialist services could be made. In 2016/17 all tutors would be able to make
referrals to study support (provided by academic librarians), but because of concerns about
capacity, only tutors in one school would be able to make referrals to Student Support Services.
• Early awareness of student engagement - the developers built an additional view that
showed the date that particular resources were accessed, for example the first log in to the VLE,
or first session attended. This was designed to help tutors early in the first team to see whether
or not students were using the resources available to them.
• More information in the ’class list’ view - University staff were able to see some information
about the students they were responsible for in a class list view. In 2015/16, an additional
column showing no engagement alerts was added to help tutors see which students required
further support at a glance.
12Chapter 4. Implementing the NTU Student Dashboard 2015/16
4.7 Learning analytics policy development
In 2015/16 the Student Engagement Team wrote a new policy outlining the principles underpinning
the use of learning analytics at the institution. The policy outlined the University’s commitment to
using learning analytics to:
• enhance student retention, by alerting staff and individual students when a student is potentially
at risk of early withdrawal;
• enhance the working relationship between tutors and students by providing tutors with timely,
meaningful information to enable more informed discussions with students;
• enhance student engagement and achievement by providing students with personalised informa-
tion about how they are engaging with their studies;
• enhance the efficiency of University support systems through better early warnings and more
targeted support;
• provide evidence that the University is supporting and engaging Tier 4 students appropriately;
• provide useful data for researching the experience of student cohorts that can be used to subse-
quently improve the learning experience and University systems.
4.8 Usage and feedback
In 2015/16, 2,056 staff logged in an average of 12 times, and 25,893 students logged in an average of
13 times.
Furthermore, staff added 5,008 notes to the Dashboard following tutorial discussions or other inter-
ventions.
Student feedback was gathered using the Student Transition Survey (Feb-March 2016, n=515). Stu-
dents reported that they were mostly enjoying being a university student (85%), were engaged with
their studies (66%), but less engaged with their social life (55%) and less confident about coping (54%).
Their strongest sense of belonging was with the University as a whole (80%) followed by their course
(74%). Students described that the most commonly identified differences between the first year and
previous studies was the degree of self-motivation required, the increased independence and fact that
students were required to manage their own learning to a far greater degree.
Eighty four percent of students felt that the Dashboard accurately or very accurately matched their self-
perceived engagement with the course. Students indicated that students primarily used the Dashboard
to check their engagement score (95%). A large number stated that they had increased the time
studying after logging in (81%). Furthermore, a sizeable minority had spoken to their tutor (33%)
or to Student Support Services (31%) after logging in. Only 8% stated that their tutor had used the
Dashboard with them in a tutorial, however 83% of these students found it useful when they had.
Students made several recommendations about improvements. These included several items on at-
tendance including making individual module attendance visible, showing better information about
resources used, gamification and the possibility of adding student entered data, for example time spent
studying in their rooms.
13Chapter 5. Implementing the NTU Student Dashboard 2016/17
Chapter 5
Implementing the NTU Student
Dashboard 2016/17
5.1 Project team activity
During 2016/17, the project team were moved into a new department. The team comprised a manager,
a project officer and a new student placement. In April 2017, a new member of staff was recruited
to support the ongoing Dashboard development process (project support officer). The primary focus
of the work was product development, staff development, student communications and research and
policy development. The team’s work continued to be overseen by a formal governance group.
5.2 Staff development & communications
In September 2016, once again a programme of staff briefings was conducted by the team. The focus
of this communication was:
• Updating staff on changes to the Dashboard
• Showing increases in both student and staff usage
• Sharing student feedback about the experience of using the resource
• Recommendations about using the notes - guidance and ethics
• Strategies for increasing staff engagement with the resource
This initial activity was augmented by three staff newsletter shared with staff users.
5.3 Student Communications
In 2016/17 the team augmented the online guidance and induction resources with a 90 second video.
The team wrote the script, ran a student competition to record a voice over and then made the final
video.
5.4 Research
The team once again analysed the relationship between engagement measured in the Dashboard and
student progression and success. Qualitative feedback was gathered in the Student Transition Survey
once again (see below). Staff feedback was gathered through three online surveys. The team also
carried out two important studies. Firstly, they tested the relationship between student engagement
measured by the Dashboard and whether or not a student had visited an academic librarian. Students
who had visited a librarian for different forms of study support had, on average, higher engagement
14Chapter 5. Implementing the NTU Student Dashboard 2016/17
than their peers who had not. Importantly, these students were also more highly engaged to begin with.
Secondly the team interviewed tutors about their experience of testing the induction resource developed
during 2015/16. Overall tutor feedback was positive, however, it was noted that the students who
really ought to have made use of the resource tended not to have done. The team planned to complete
the analysis in 2017/18 by measuring student progression data to test whether or not participating in
the induction activity would function as an effective early warning of risk.
The team’s placement student carried out a series of focus groups with students. In a repertory grid
exercise, students selected primarily positive and active words to describe how they felt about the
Dashboard. The most commonly chosen words were ’motivated’, ’encouraged’ and ’pleased’.
5.5 Dashboard development
In 2016/17 it was agreed that rather than using a full and formal project management process, the
resource was sufficiently mature that a Business as Usual (BAU) development process would be suffi-
cient to manage the development. The resource was upgraded to the new version (V3) between Easter
and September 2017.
The following developments took place:
• Extending referrals to Student Support Services for all tutors - it was agreed that the
quantity of referrals from the pilot school was manageable and late in the year all tutors were
able to make referrals
• Algorithm - two changes were made to the algorithm. Firstly, a new engagement category was
added (Very Low). This was intended to help staff identify those students with extremely low
engagement and place a higher priority on supporting those students. Secondly, attendance and
e-resources were added as new data sources.
• Visual representation of engagement - the graphs representing engagement were improved
enabling a user to more easily scale the view and a calendar view was developed to show daily
engagement for the past 30 days
• Notes and interventions - more functionality was added to the notes process. This was
intended to primarily produce data to support the analysis of what interventions might be most
valuable.
• Resource view - this enabled all users to more easily see engagement with the resources that
made up the overall engagement score. Users could see all of the engagement for the past seven
days for each feature (for example card access to buildings).
• Exemptions - this gave staff the ability to switch off alerts (for example if they knew that a
student had a long-term illness).
• Capacity to view withdrawn and graduated students
Unfortunately, significant problems arose late in the development process around the capacity of the
Dashboard to cope with the quantity of data required.
A number of developments were not completed during this time including developing goal-setting
functionality and showing whether or not a student was taking part in Students’ Union activities
such as being a student representative. These developments were not completed due to other pressing
priorities.
15Chapter 5. Implementing the NTU Student Dashboard 2016/17
5.6 Learning analytics policy development
In summer 2017, the University revised its existing tutoring policy. The formal academic tutoring
policy was replaced with a set of principles focusing on the need for transition support. The Dash-
board was formally adopted as a resource in which tutors were expected to capture their tutoring
interventions.
5.7 Usage and feedback
In 2016/17, 2,597 staff logged in an average of 16 times, and 28,486 students logged in an average of
19 times
Staff added 12,438 notes to the Dashboard following tutorial discussions or other interventions.
In 2016/17 when the Dashboard was available to log in to from September onwards the majority of
first year students had logged in to the Dashboard before the start of term. This is quite possibly
because new students are encouraged to log in to the VLE as part of Starting at NTU and found the
link. Unfortunately, at the start of both 2017/18 and 2018/19, the Dashboard was unavailable until
early October for new students.
A more detailed analysis of the 2016/17 Student Transition Survey is included in Appendix One. This
year for the first time, the team analysed the relationship between logging in to the Dashboard and
student engagement.
Figure 5.1: Dashboard log ins by engagement rating, 2015/16 (First Year, FT, UG students)
The fact that the process of logging into the Dashboard itself increases a student’s engagement slightly,
assuming it is assessed via the Visual Learning Environment (VLE) rather than a bookmarked link,
should not be ignored, however the team believes that this factor alone does not account for the
increased engagement of those who log-in multiple times. A greater factor is likely to be the nature
of the students themselves. Rather than claiming that the Dashboard increases student engagement,
we feel it is more likely that the Dashboard is used more by students with higher engagement with
the University. Research also showed a relationship between the number of times a student logged
into the Dashboard and progression and attainment; students who logged in more were more likely to
progress and achieve grades equivalent to a Upper second or First class degree. Again, we feel this
reflects the nature of the users more than it acts as evidence that the Dashboard has an impact on
student outcomes.
16Chapter 5. Implementing the NTU Student Dashboard 2016/17
In the 2017 Student Transition Survey we asked students about changing their behaviour as a result
of seeing the Dashboard (see appendix 1) and found the follow:
• 74% of the students that had logged on to the Dashboard reported having changed their be-
haviour to raise or maintain their engagement score.
• 74% of students reported having increased the amount of time spent studying, with 45% and
41% doing this ’often’ or ’very often’ respectively.
• About a third of students reporting having explored speaking to their tutor and speaking to
someone providing specialist help when using the Dashboard (37% and 30% respectively).
In 2016/17 the team also conducted a series of staff surveys with Dashboard users. The team found
that 40% of staff reported that they believed using the Dashboard in tutorials had led to changes in
students’ engagement. Reasons for this included challenging students’ self-perceptions and how they
felt they were performing in comparison to their peers, realising that the tutor had access to such
information about them, and by using the Dashboard as an early warning system. Suggestions made
by staff for their fellow tutors included using the notes, reflecting on modules that engaged students
more readily, and to make greater use of the tools.
17Chapter 6. Implementing the NTU Student Dashboard 2017/18
Chapter 6
Implementing the NTU Student
Dashboard 2017/18
6.1 Project team activity
In 2017/18 the team comprised a manager, a project officer and a project support officer. In April
2017 a new researcher was recruited. The team worked closely with colleagues in Information Systems,
including the team assembled for the project to implement the latest version of the Dashboard. A
significant amount of time was spent problem solving issues with the Dashboard. It was agreed in
2017/18 that instead of reporting to a formal governance group the team should set up a user group
comprising representatives of the end using staff and students. This year the team worked more
closely with the University’s Organisational Development department to explore more effective ways
of delivering the training and briefings needed to support staff. The team’s work was audited in
2017/18 to better understand the extent to which tutors were using the Dashboard in their work.
6.2 Staff development & communications
The main priorities for the September briefings were as follows:
• Emphasis on the Dashboards strategic aims
• Accuracy of the Student Dashboard particularly sharing the relationship between engagement
and progression. This year the team placed greater emphasis on the importance of responding
early to low engagement
• The relationship between higher Dashboard use and progression
• Usage statistics
• Using the Dashboard in tutorials
• Student feedback about personal tutorials
• Core changes to the Dashboard
6.3 Student Communications
In 2017/18, the team used the same communications channels as previous years: new student induction
slides, returners’ induction slides and resources on the current student webpages.
18Chapter 6. Implementing the NTU Student Dashboard 2017/18
6.4 Research
Once again, the team conducted the Student Transition Survey in the second term. Respondents were
invited to participate in focus groups afterwards to discuss in more detail how they used the resource.
In the UK, progression data is only available once it is clear that students have re-enrolled into the next
academic year. Therefore, it was only possible to analyse the impact of the 2016/17 induction trial
once 2017/18 had started. As might be expected, there was a clear association between completing
the online pre-arrival task in the Dashboard and both progression and attainment. In 2017/18, the
team also used the Dashboard to carry out several analyses of other institutional learning and teaching
activities, providing further insights for senior managers and educational developers.
6.5 Dashboard development
2017/18 was probably the most challenging year for the team. At the end of the previous academic year,
it became clear that there may be problems about whether or not the new version of the Dashboard
would be able to cope with the quantities of data required. By the end of the first few weeks of term,
it was clear that there was a serious problem. The quantity of data was simply overloading the system.
This was due to the fact that there were two new data sources included in the algorithm (attendance
and e-resources) and that, due to upgrades to upstream systems, more data was being generated from
the existing data sources. In one case a change to the API from the VLE meant that 3,000 times more
data was being generated. Over the course of the first term, a number of remedial actions were taken
to alleviate the problems. For example, in the original plan tutors would be able to see students who
had completed the course in order to write references. These students were removed in order to reduce
the load. These interventions were only partially successful, and it was clear that there needed to be
significant developments to make the resource reliable.
A full project was initiated in March 2018 with Project Management and Business Analysis support.
It ran until the end of the STELA Project (October 2018) and led to the development of a new
version of the Dashboard based on an entirely new architecture. The following were key features of
the development:
• New underlying systems architecture based on a new database to improve stability
• Redesigned interfaces, graphs and search functions
• Designed to be fully device agnostic
• Improved capacity to scale the view for any time period
• Full capacity to see the resources over any time period, not just the past seven days
• Notes redesign to function more like a CRM system
• Significantly improved underlying systems to prevent data feed failures from disrupting the
algorithm
• More information about personal tutors in the system
6.6 Learning analytics policy development
In 2017/18, the EU GDPR legislation was introduced in the UK. The team was required to produce
various documents to ensure that our practice met the standards required. Minor amendments were
also made to the University’s learning analytics policy in 2017/18. These were to make explicit the
fact that the University would share data from the Dashboard in two specific circumstances. These
both related to students who were sponsored either by an employer or a government and only if a
contract had been signed by the student with this third party.
19Chapter 6. Implementing the NTU Student Dashboard 2017/18
6.7 Usage and feedback
In 2017/18, 1,451 staff logged in an average of 29 times, and 30,290 students logged in an average of
15 times.
Staff added 16,189 notes to the Dashboard following tutorial discussions or other interventions with
students.
It is important to note that the Dashboard counted staff users differently in 2017/18 to previous years.
The team believes that the previous years over-counted the total number of staff users by also including
attempted log ins rather than only counting successful log ins. This will be further investigated in
2018/19. It is also worth noting that the total number of student log ins dropped when compared to
the previous year. The team believes that this is largely due to the problems with the previous version
of the Dashboard. This appears to be borne out by findings from the 2017/18 Student Transition
Survey (n=728) where student perception of the usefulness of the Dashboard was 18% lower than in
2016/17.
In the Student Transition Survey, students reported a similar experience to previous years. They
generally enjoyed being students (82%) and felt more engaged with their studies than with their
university social life. Just over half felt that they were confident coping with their studies. They
reported that the biggest challenges related to adapting to their studies, being away from home/
living independently and fitting in. Once again, they were most likely to feel that they belonged to
the University and their course over other groups such as their tutorial group or accommodation.
28% reported that their tutor had used the Dashboard with them in a tutorial. Of those who had,
73% found it useful. Furthermore, 26% of students reported that their tutors had put notes in the
Dashboard, 66% found these notes to be useful. When asked what improvements they would like to
see, students provided a number of suggestions including. Goal setting for review at the next tutorial,
" more in-depth notes", more explicit guidance about what to improve or " allow students to reply and
comment on the notes made on Dashboard". Some of these comments have already been integrated
into the next version.
61% of students reported that they felt more confident after logging in to the Dashboard and 55%
reported that they felt more motivated to work harder after doing so. Students who see positive
engagement reflected back at them appeared to be more positive about the Dashboard. For example:
" I normally check the dashboard to check my engagement, and it is usually good-very high, which
motivates me to continue progressing in the way I am", " I am doing well, on average above my peers,
and to know that we are being observed makes you want to do more" or " I feel confident when my
attendance has been logged and it motivates me to engage more" (students with high confidence
and high motivation). Other students reported how feeling behind their peers was a motivator " Not
confident as I feel others are doing better, and motivated as it makes me think I need to work harder"
(student with low confidence, but high motivation). Finally, some students were unhappy
with the way the Dashboard displayed their data and this made it harder to engage with the resource
" The dashboard is very confusing and would be better if it had more detail as to specifically why the
engagement rating is why it is for each day . . . It would also be better if attendance to specific sessions
were displayed so I could track this and maybe pick up on patterns or issues with specific sessions"
(student with low confidence and average motivation).
Finally, students described how they primarily discovered the Dashboard themselves by following the
link from the VLE or the University smartphone app. Just under half remembered being told about
it during induction and just under a third had been told to have a look by their tutors. Students were
acting as independent agents using the resource for themselves.
20Chapter 7. How the Dashboard has changed the transition experience at NTU
Chapter 7
How the Dashboard has changed the
transition experience at NTU
The Dashboard contributed to improving the student transition experience in three core ways.
1. New student induction
2. Students managing their own engagement
3. Academic/ personal tutoring
7.1 New student induction
Work on the new student induction trial took place across all three years of the STELA project. The
development work was conducted in 2015/16, the pilot delivered in 2016/17 and evaluation conducted
in both 2016/17 and 2017/18.
A more detailed report about the evidence is available here: http://www.ableproject.eu/wp-content/
uploads/2018/10/O8-NTU-1.-Induction-case-study.pdf. As might be expected, students who an-
swered the questions in the Student Dashboard were more likely to complete the academic year com-
pared to their peers. The purpose of this case study is to highlight the potential of adding an induction
activity to learning analytics and discuss any limitations.
There is utility in early activity in the Dashboard. Non-completion of the induction could function as
an effective early warning system by the end of the induction week. With a stricter deadline and more
explicit communication, it could have provided even earlier data with the potential to group students
during initial induction, or target communications to them.
There is potential to expand the insights generated. The questions were designed to help students
reflect on and anticipate the new learning experience at university. The questions could have been
developed differently, for example providing a diagnostic maths test, or even psychological testing
using the ’big five’ characteristics or other factors associated with academic success at university.
Such approaches require further ethical consideration.
Implementing such activity requires time and resources. The project initiation, trial and evaluation
took three academic years. Once findings had been shared in 2017/18 it was agreed that the institution
should change the pre-arrival activity so that it would be possible to see whether or not all first-year
students had completed the activity. The earliest possible implementation is 2019/20 and working
through the logistics is likely to be highly challenging. For example, should the induction activity
take place in the Dashboard, or through the VLE? How does the institution ensure that the data is
robust as some activities include student produced portfolios and other activities that may not be
easily inputted online? Is this development sufficiently high priority compared to others?
21Chapter 7. How the Dashboard has changed the transition experience at NTU
7.2 Students managing their own engagement
The Dashboard was designed for two main users: students and staff. Over the three years of the project,
the Dashboard has become an increasingly normal part of the University landscape. It appears to have
a role for first year students making the transition into higher education. Even with all the reliability
problems during the 2017/18 year, students had logged in an average of 15 times each. Students were
starting to use the data to manage their own learning experience. As stated in the 2017/18 section,
students appeared to have primarily found the Dashboard for themselves. It is clear that for many it
has become a tool for monitoring their own learning activity.
As reported in the 2016/17 section, there is a strong association between logging in more frequently
and progression to the second year/academic success. Those first-year students who use the Dashboard
more frequently are more likely to progress to the second year than students who do not. The team
cannot prove that there is a causal link between the two phenomena. It is interesting to see that
the qualitative feedback (2017/18) about whether or not students find the Dashboard boosts their
confidence or motivates them to engage offers hints. In the qualitative feedback provided, students
who reported that the Dashboard helped tended to feel positively about the self-image it reflected
back to them. For example " I have managed to stay above of my course, so I feel I am doing well
and strive to stay above", " Because I am confident anyway and viewing the dashboard only serves to
help me with that" and " . . . I normally check the dashboard to check my engagement, and it is usually
good-very high, which motivates me to continue progressing in the way I am". Some students reported
that seeing low engagement in the Dashboard was a spur to act, " [the Dashboard] pushes me to go
to more classes" , others were confused " It is unclear what dashboard is telling me". However, some
of the least satisfied respondents to the question appeared to be frustrated by the data presented to
them. There is some frustration that not all attendance is captured, but some students appeared
despondent " . . . it shows me clearly what I’m doing wrong just that I’m garbage . . . ", another " the
layout of the dashboard is not exactly wonderful enough to raise my mood. the colour of the dashboard
is extremely plain which reminds me that student life is hard and plain". More analysis is needed, but
we suspect that regular Dashboard users are likely to be those for whom a positive image is reflected
back at themselves. The team believes that learning analytics can be very effective for sustaining
the motivation of students who are either highly engaged or respond well to the challenge presented.
However, there is also a minority of students who rather than be spurred on by the data picture are
demotivated by it.
For these students we believe that we need support from tutors or other staff members.
7.3 Academic/ personal tutoring
The most widespread impact upon first year student transition has been the availability of data in
the Dashboard for academics to use in tutorials with their students. Although there were quality
problems with the resource in the final year of the project, the team saw both student and staff use
increase. For example, there were almost three times more notes added to the Dashboard by tutors
in the final year compared to the first year. Tutors have started to change their practices to make the
Dashboard a core aspect of their work. In all three years, students reported that they found it useful
when tutors used the Dashboard during tutorial discussions. Furthermore, when asked in 2017/18,
two thirds reported that they also found tutor notes written in the Dashboard to be useful.
Tutors described how they used learning analytics in their roles. The resource was primarily used to
support the tutorial conversation. They would open it up prior to the meeting to ’catch up’ with the
student. Tutors reported that they found using the tool to be an effective way to frame the early part
of the conversation by asking students to reflect on their self-perceptions of engagement compared to
the data shown in the Dashboard. They also found the notes and referrals functionality valuable for
capturing the discussion and referring students to further support.
Registering, training and supporting nearly 1,500 university staff in a range of roles to use the Dash-
board has been, and remains, a significant challenge. In many respects, it is the most complicated part
of the process. This is partly because learning analytics requires a cultural mind shift. Aggregating the
22Chapter 7. How the Dashboard has changed the transition experience at NTU
data into five engagement ratings is a slightly alien concept and there are challenges associated with
understanding different aspects of the engagement, particularly engagement over time. This coupled
with a difficult year in 2017/18 eroded staff confidence. The team began all staff briefings at the start
of the 2018/19 year with an apology and have been working hard to restore staff confidence in the
resource ever since.
23Chapter 8. Case Study Zero - Key Lessons
Chapter 8
Case Study Zero - Key Lessons
8.1 Mission & Governance
Like perhaps most technologies, learning analytics is not an end product: it is a resource that enable
humans to take actions. At NTU the resource was designed to be used by students and staff to reflect
upon and improve student engagement. We believe that this understanding is crucially important
for first year students making the transition into higher education. The University has always had a
strong vision that supporting student success is a key priority. Even so, the project has faced challenges
about which development will have the greatest likelihood of achieving this aim. For example, student
goal-setting was identified in 2016/17 as an important priority development to help students take more
control of their own learning, however other priorities such as ensuring stable Dashboard performance
meant that this development has been delayed.
Rec. 1: Need for governance support
Implementing institutional learning analytics is a complicated long-term project. It requires
senior management support and buy-in from a wide range of stakeholders. Institutions need to
implement governance support to conduct initial pilots, embed and develop learning analytics
across the institution.
8.2 Data
The second challenge for any organisation implementing learning analytics is managing the data needed
for learning analytics. Our experience shows that such data is unlikely to be readily available for use
in learning analytics and that there are a number of significant barriers to overcome first. Unlike most
other IT projects, learning analytics systems are reliant upon data generated by other systems that
were very unlikely to have been developed to make it easy to export data for analysis.
Rec. 2: Data collection should be treated as a key aspect of Learning Analytics
Extracting usable, timely data for learning analytics is a significant project. Institutions should
treat this foundational aspect of the work as equally important to the learning analytics resource
that will interact with the data.
8.3 Product Development
There are also issues associated with the way that any learning analytics resource is built. Even if
developed by an in-house team, the developers may misunderstand the nature of the institution, or
make assumptions that do not necessarily reflect current practices. Moreover, institutional learning
24Chapter 8. Case Study Zero - Key Lessons
analytics require consistent practices across the institution to be most effective. For example, if
attendance is monitored differently in different departments, this potentially creates real problems.
Rec. 3: Need for Liaison between end users and technical developers
The institution requires a business owner to interpret and liaise between the end users and
technical developers. The business owner requires a strong understanding of the nature of the
organisation, learning and teaching and needs to understand enough of the technical processes to
be able to have meaningful communications.
8.4 Communication
Any learning analytics tool is only as useful as the change that it enables. At NTU, the team needed
both staff and students to interact with the resource. Therefore, both need to be informed about and
engaged with it. That requires significant amounts of time-consuming communication.
Rec. 4: Institutional communication should start as early as possible
A communications strategy is essential to ensure that all stakeholders are able to use the resource.
Moreover, it will take a long time to embed this into the normal practices of the institution. It
is essential to start work on institutional communications channels such as the providers of new
staff induction as early as possible.
8.5 Conclusion
The project team have used the STELA funding to improve and extend the product development
and institutional practices required to improve the student transition experience between 2015/16
and 2017/18. During this time three new versions of the NTU Student Dashboard were developed
containing developments the team considered would help students to make the transition into the first
year. Each year staff were briefed on the changes and advised on strategies for using the Dashboard
with their students. Resources were produced to help students access the Dashboard for themselves.
The team supported developments to the institution’s practices in induction, tutoring and transition.
Furthermore, the Dashboard was used to trial improvements to new student induction practices. Case
Study Zero was written to highlight some of the research and reflections carried out to enable these
changes to take place.
25You can also read