Category Leader in Ground Transportation Management

Page created by Katie Cook
 
CONTINUE READING
Category Leader in Ground Transportation Management
Category Leader in Ground
Transportation Management   November 2021
Category Leader in Ground Transportation Management
DISCLAIMER
    This investor presentation (this “Presentation”) is for informational purposes only to assist interested parties in making their own evaluation with respect to the proposed business combination (the “Business Combination”) between Rosecliff Acquisiiton Corp I (“SPAC” or “Rosecliff”) and GT Gettaxi Limited and its s ubs idiaries (“the Company”).
    The infor mation contained herein does no t purpor t to be all-inclusive and none of Rosecliff , the Co mpany or their respective directors, of ficers, stockholders or a ffil iates makes any representation or warranty, express or impl ied, as to the accuracy, completeness or reliab ility of the infor mation contained in this Presentation or any o ther writ ten or oral com munication
    communicated to the recipient in the course of the recipient's evaluation of the Company or Rosecliff. The information contained herein is preliminary and is subject to change and such changes may be material.
    This Presentation and information contained herein constitute confidential information and is provided to you on the condition that you agree that you will hold it in strict confidence and not reproduce, disclose, forward or distribute it in whole or in part without the prior written consent of Ros ec liff and the Company and is intended for the recipient hereof only .
    No securities commission or securities regulatory authority in the United States or any other jurisdiction has in any way passed upon the merits of the Bus ines s Combination or the accuracy or adequacy of this Presentation.
    No Offer or Solicitation
    This Presenta tion does not c ons titu te (i) a solici tation of a proxy, consent or au thorization with respect to any s ec urities or in respect of the proposed Bus ines s Combinat ion or (ii) an of fer to sell , a solicita tion o f an of fer to buy , or a recom mendation to purchase any security of Rosecliff , the Company, or any o f their respective a ff iliates . You should not construe the
    contents of th is Presenta tion as legal, tax, accounting or invest ment adv ic e or a recommenda tion. You should consult your own counsel and tax and f inancial advisors as to legal and rela ted mat ters concerning the ma tters described herein , and , by accepting th is Presenta tion, you conf irm that you are not relying upon the informa tion contained herein to make any
    decision.
    The distribu tion o f this Presentation may a lso be restricted by law and persons into whose possession this Presentation comes should inform the mselves about and observe any s uc h restrictions . The recipient acknowledges tha t it is (a) aware that the United S tates securities laws prohibit any person who has ma terial, non-public in forma tion concerning a company
    from purchasing or selling securities of such company or from co mmunicat ing such in forma tion to any other pers on under circumstances in which it is reasonably fores eeable that such person is likely to purc has e or sell such securities, and (b) fa miliar with the Securi ties Ex c hange Act of 1934, as a mended, and the rules and regulations promulga ted thereunder
    (collectively, the "Exchange Act"), and that the recipient will neither use, nor cause any third party to use, this Presentation or any information contained herein in contravention of the Exchange Act, including, without limitation, Rule 10b-5 thereunder.
    This Presenta tion and any o ffer of securities i f made subsequently are directed only at persons (I) ou tside the Uni ted Kingdom ; (II) in any Me mber Sta te o f the European Economic Area , who are “quali fied investors” as defined in Ar ticle 2(e) o f Regulation (EU) 2017 /1129 (the “ Prospectus Regulation”) ; and (I II) in the Uni ted Kingdo m, who are “qualif ied investors”
    as defined in the Prospectus Regulat ion as it for ms part of do mestic law by virtue of the European Union (Withdrawal) Act 2018, who are also (i) investmen t professionals fa lling within Ar ticle 19(5) of the Financ ial Services and Markets Act 2000 ( Financial Promo tion) Order 2005, as a mended ( the “Order”), or (i i) persons fal ling wi thin Ar ticle 49(2)(a) to (d) (“high
    net worth companies, unincorporated associations e tc .”) o f the Order (al l such persons toge ther being referred to as “Relevant Persons”). This Presentat ion and any of fer o f securities if made subsequently is directed only a t Relevant Persons and must not be acted on or relied on by persons who are not Relevant Persons . Any investmen t or investmen t activi ty to
    which the information contained in this Presentation relates is available only to Relevant Persons and will be engaged in only with Relevant Persons .
    Forward-Looking Statements
    Certain sta temen ts in this Presenta tion may be considered “forward-looking s tate ments” wi thin the meaning of the “safe harbor” provisions of the United Sta tes Priv ate Securit ies Li tigat ion Re form Act of 1995. Forward-looking sta temen ts generally relate to fu ture events or Rosecliff's or the Company’s fu ture financial or operating perfor mance. For example,
    projections of fu ture Revenue are forward-looking statemen ts . In some cases, you can identify forward-looking statemen ts by terminology such as “may,” “should,” “expect,” “intend ,” “will,” “est ima te,” “anticipa te,” “believ e ,” “predict,” “poten tial” or “continue ,” or the nega tives of these terms or variations of them or si milar ter minology . Such forward-looking
    statements are subject to risks, uncertainties, and other factors which could cause actual results to differ materially from those expressed or implied by such forward looking statements .
    These forward-looking s tate ments are based upon est ima tes and assumptions tha t, while considered reasonable by Rosecliff and i ts managemen t, and the Company and its managemen t, are inherently uncertain . Factors that may cause actual results to di ffer ma terially from current expectations include, but are not li mited to: (1) the oc c urrenc e of any event,
    change or other circumstances that could give rise to the ter minat ion o f nego tiat ions and any subsequent def initive agreemen ts with respect to the Business Combinat ion; (2) the outcome o f any lega l proceedings that may be insti tuted against Rosecliff , the Co mpany, the c ombined co mpany or o thers fol lowing the announcemen t o f the Business Combina tion and
    any defini tive agreemen ts wi th respect there to; (3) the inab ility to comple te the Business Combina tion due to the fai lure to ob tain approval of the shareholders o f Roseclif f, to ob tain financing to comple te the Business Combina tion or to sat isfy o ther condit ions to closing; (4) changes to the proposed structure o f the Business Comb ination tha t may be required or
    appropriate as a result o f appl icable laws or regula tions or as a condi tion to ob taining regulatory approval of the Business Combina tion; (5) the abil ity to meet the stock exchange’s listing standards fo llowing the consum mation of the Business Comb ination ; (6) the risk that the Business Comb ination disrupts current p lans and opera tions o f Roseclif f or the Co mpany
    as a result of the announcement and consummat ion o f the Business Combina tion; (7) the abil ity to recognize the an ticipated bene fits o f the Business Combina tion , which may be af fected by , a mong o ther things, competi tion , the abi lity o f the combined company to grow and manage growth profi tably, main tain relationships wi th custo mers and suppliers and retain
    its managemen t and key employees ; (8) costs rela ted to the Business Combina tion ; (9) changes in app licable laws or regulat ions and delays in obtaining , adverse conditions contained in , or the inabil ity to ob tain regulatory approvals required to comple te the Business Combina tion; (10) the Co mpany’s esti mates of expenses and pro fitabi lity and underlying
    assumptions with respect to stockholder redemp tions and purchase price and o ther adjus tmen ts ; (11) the possibili ty that Ros ec liff or the Company may be adversely a ffected by o ther econo mic, business and/or competi tive factors ; (12) the Company’s est ima tes of our financ ial per formance; and (13) other risks and uncertainties set for th in the section en titled
    “Risk Factors” and “Cautionary Note Regarding Forward Looking Statements” in the proxy statement relating to the Business Combination.
    Nothing in th is Presenta tion should be regarded as a representa tion by any person that the forward-looking s tate ments se t forth herein wi ll be achieved or tha t any of the conte mplated results o f such forward-looking s ta temen ts will be achieved. You should no t place undue rel iance on forward-looking sta temen ts, which speak only as of the da te they are made.
    Neither Rosecliff nor the Company undertakes any duty to update these forward-looking statements .
    Financial Information
    The f inancial in forma tion con tained in this Presentation has been taken from or prepared based on the historical financial s tate ments of the Company for the periods presented. The Company’s his torical f inanc ial in forma tion is prepared in accordance with In ternational Financial Reporting S tandards (“IFR S”). Such informa tion has not been audited in accordance
    with e ither Pub lic Co mpany Oversight Board (“ PCAO B”) standards . We cannot assure you tha t, had the financial sta temen ts been complian t wi th Regulat ion S-X under the Securities Ac t o f 1933, as amended , and the regula tions of the SEC promu lgated thereunder or audi ted in ac c ordanc e with PC AOB standards, there would not be di fferences and such
    differences could be ma terial. An audit o f the Company’s financial sta temen ts in ac c ordanc e with PCAO B standards is in process and wi ll be included in the proxy state ment rela ting to the Business Comb ination . Accordingly, there may be ma terial dif ferences between the presentation o f the financial in forma tion included in the Presentation and in the proxy
    statement.
    Non-IFRS Financial Measures
    This Presenta tion includes certain financial measures not presented in accordance with IFR S including , but not li mi ted to, Direct Gross Pro fit , Contribut ion Profi t, Contribu tion Margin , EB ITD A, E BI TDA Margin , Segmen tal E BI TDA and Segmen tal E BI TDA Margin . These non- IFRS f inancial measures are no t measures of financial per formance in accordance with
    IFRS and may exclude ite ms tha t are signi ficant in understand ing and assessing the Company’s financial results . Therefore , these measures should no t be considered in isola tion or as an al ternative to net income , cash flows from opera tions or o ther measures o f profi tabili ty, liquidi ty or per formance under IFR S. You should be aware that the Company ’s
    presentation of these measures may not be comparable to similarly-titled measures used by other companies .
    The Company believes these non-IFR S measures of financial results provide use ful informa tion to manage ment and investors regarding certain financial and business trends rela ting to the Co mpany’s f inancial condi tion and results o f opera tions . The Company bel ieves tha t the use o f these non- IFRS f inancial measures provides an addi tional tool for investors to
    use in evaluating ongoing operating results and trends in and in comparing the Company’s f inancial measures with o ther si milar compan ies, many of whic h present similar non-IFR S financial meas ures to inv es tors. These non-IFR S financial measures are subject to inherent limi tat ions as they reflect the exercise of judgmen ts by manage ment about which expense
    and income are excluded or included in de termining these non-I FRS financial measures . Please refer to foo tnotes where pres ented on eac h page o f this Presentat ion or to the appendix found at the end of this Presenta tion for a reconciliat ion o f these measures to what the Company believes are the most directly comparable measures ev aluated in accordance
    with IFRS.
    This Presenta tion also includes certain projections of non-I FRS financial measures . Due to the high variabili ty and di fficul ty in making accurate forecasts and projections of some of the infor mation excluded from these projected measures, toge ther wi th some of the excluded informa tion not being ascertainable or accessible, the Company is unab le to quanti fy
    certain amounts that would be required to be included in the most directly comparable IFRS financial measures without unreasonable effort. Consequently, no disclosure of estimated comparable IFRS measures is included and no rec onc iliation of the forward-looking non-IFRS financial measures is inc luded.
    Use of Projections
    This Presenta tion contains financ ial forecasts with respect to our projected financial results, including Market sizes, Gross Merc handis e Value (“G MV”), Net Revenue, Direct Gross Profi t, Gross Margin , Con tribution Pro fit , EB ITD A, Adjus ted EB ITDA and Seg mental E BI TDA. The Company’s independent auditors have not audi ted, reviewed, comp iled or performed
    any procedures with respect to the projections for the purpose o f their inclusion in th is Presenta tion , and accordingly, they did not express an opinion or provide any other for m o f assurance with respect thereto for the purpose o f this Presentation . As discussed under “Financial Informa tion” above, a ll financial infor mation , including the projec ted in forma tion, was
    prepared in accordance with IFRS . These projections s hould no t be relied upon as be ing necessarily indicative o f future results . The assump tions and esti mates underlying the pros pec tiv e financial in format ion are inherently uncertain and are subject to a wide variety of signif icant business, economic and competi tive risks and uncerta inties that could cause actual
    results to dif fer material ly fro m those contained in the prospective f inancial in forma tion. Accordingly, there can be no assurance tha t the prospective res ults are indicative o f the fu ture perfor mance o f the Co mpany or that actual results wi ll no t dif fer materially fro m those presented in the prospective financial in format ion or tha t the prospective financial infor mation
    will be the same as that presented in the prox y statement related to the Business Combination. Inc lus ion of the prospective financial information in this Presentation should not be regarded as a representation by any person that the results contained in the prospective financial information will be achieved.
    Industry and Market Data; Trademarks
    In th is Presenta tion, Roseclif f and the Company rely on and re fer to c ertain infor mation and sta tistics ob tained from third-party sources which they believe to be reliable , including reports by market research f irms. Neither Roseclif f nor the Company have independently veri fied the accuracy or completeness o f any such third-party in forma tion. You are cautioned not
    to give undue weight to such industry and market data.
    This Presenta tion may contain trademarks, service marks, trade na mes and copyrights of other companies, which are property of their respective owners . Solely for convenience, so me o f the trademarks, s erv ic e marks, trade na mes and copyrights referred to in this Presentation may be lis ted wi thout the T M, S M, (c) or (r) symbols, but Rosecliff and the Co mpany
    will assert, to the fullest extent under applicable law, the right of the applic able owners, if any, to these trademarks, service marks, trade names and copyrights .
    Additional Information and Where to Find It
    This document rela tes to a propos ed transaction between the Company and SP AC. This documen t does not consti tute an o ffer to sell or exchange, or the solicita tion of an o ffer to buy or exchange, any securities, nor shall there be any sale of s ec urities in any jurisdict ion in which such o ffer , sale or exchange would be un lawful prior to regis tration or quali fication
    under the securities laws of any such jurisdiction . SP AC in tends to file a registra tion s tate ment on For m S-4 that will include a proxy state ment of S PAC and a prospectus of S PAC . The proxy state ment /prospectus will be sent to all S PAC and The Co mpany stockholders . S PAC also wil l file other docu ments regarding the proposed transaction with the S EC. Be fore
    making any voting decision, investors and security holders o f S PAC and The Company are urged to read the registration state ment , the proxy statemen t/prospectus and all other relevant documen ts filed or tha t wi ll be f iled wi th the SEC in connection with the propos ed transaction as they become available because they will contain impor tant infor mation about the
    proposed transaction.
    Investors and s ec urity holders wi ll be able to obtain free copies of the proxy sta temen t/prospectus and all o ther relevan t documen ts filed or tha t wi ll be f iled wi th the S EC by SP AC through the website ma intained by the SEC at www.sec .gov. In add ition , the docu ments filed by S PAC may be ob tained free o f charge from SP AC’s website at www.rosecliff .com or by
    written request to SPAC at Ros ec liff Acquisition Corp I, 767 5th Avenue 34th Floor, New York, NY 10153.
    Participants in Solicitation
    SPAC and the Company and the ir respective directors and o fficers may be deemed to be par ticipants in the s olic itat ion o f prox ies from S PAC’s stockholders in connection with the proposed transaction. In format ion abou t SP AC’s directors and executive o ff icers and their owners hip o f SP AC’s securities is set for th in SP AC’s f ilings wi th the S EC, including SP AC’s
    Registration S tate ment on Form S-1, which was f iled with the SEC on January 27, 2021 , as a mended. To the extent that holdings of SP AC’s securities have changed since the amoun ts prin ted in S PAC’s Registration Sta temen t on Form S-1 , such changes have been or wil l be re flected on S tate ments of Change in Ownership on Form 4 fi led wi th the SEC.
    Additional information regarding the interests of those pers ons and other persons who may be deemed participants in the propos ed transaction may be obtained by reading the prox y statement/prospectus regarding the proposed transaction when it becomes av ailable. You may obtain free copies of these documents as described in the preceding paragraph.

2
Category Leader in Ground Transportation Management
Agenda

     Introduction by CEO of Rosecliff Acquisition Corp. I

     Business Overview by CEO of Gett

     Market Opportunity, Geographic Expansion and Product Overview by COO of Gett

     Financial Overview by CFO of Gett

     Q&A

3
Category Leader in Ground Transportation Management
Our aspiration is to become the
    standard in corporate ground
    transportation spend management, a
    $100B+ category

4
Category Leader in Ground Transportation Management
Unique Fit with Rosecliff Acquisition Corp. I
                                                                                        Management
    Rosecliff at a Glance
                                                                                                Michael Murphy
    ✔    Rosecliff Ventures is an investment management firm with over $1B AUM and              • Chief Executive Officer, Founder of Rosecliff ($1.1B AUM)
         100+ portfolio companies                                                               • Angel investor and serial entrepreneur with over 25 years of experience within the
                                                                                                  technology and financial services industry
    ✔    Collectively as a team, we are a combination of managers, entrepreneurs,               • Investor in several high profile, venture backed businesses including: WheelsUP,
         investors and financial industry experts                                                 Postmates, Allbirds, Roman, Thirty Madison, PIPE and Kyte

    ✔    Our objective is to generate attractive returns for stockholders by actively
                                                                                                Brian Radecki
         supporting the next generation of exceptional public companies
                                                                                                • Chairman of the Board
                                                                                                • 20+ years of experience as a public company CFO (CoStar)
    ✔    Targets companies that have a significant addressable market, dynamic                  • Board Member, ACV Auctions
         management team, long term growth prospects and sustainable differentiation
                                                                                                • Board of Directors, WheelsUP
    ✔    $253M in trust
                                                                                                Jordan Zimmerman
                                                                                                • President
                                                                                                • Chairman & Founder of Zimmerman Advertising (7th largest ad agency with $3B in
    Key Differentiators                                                                           bookings)
                                                                                                • Extensive experience with B2B enterprise companies
     ✔    Rosecliff brings experience and access to C-level decision-makers at
                                                                                                • Strong relationships with Fortune 500 executives and extensive experience of working
          Fortune 500 companies and operating officers across corporate America,
                                                                                                  with companies such as AutoNation, McDonald’s, Office Depot, Planet Fitness and Papa
          which is highly complementary to Gett’s growth strategy
                                                                                                  John’s

     ✔    Our president built Zimmerman Advertising - one of the largest advertising
                                                                                                Kieran Goodwin
          agencies in the US and a great example of a large enterprise that Gett’s
          solution is designed for
                                                                                                • Chief Financial Officer
                                                                                                • Founder of Panning Capital Management, L.P. ($1.1B AUM)
                                                                                                • Former Head of Trading at King Street Capital Management ($20.4B AUM)
     ✔    Our core strength is taking creative B2B ideas, scaling them across
          corporate America and boosting B2B sales
                                                                                                Heather Bellini
     ✔    Rosecliff Ventures has an extensive track record of developing and                    • Independent Director, CFO of Deep Instinct, successfully raised $175M
          investing in technology businesses                                                    • Former Managing Director & Partner at Goldman Sachs leading the Technology
                                                                                                  Research Group
5                                                                                               • Direct access to equity research at bulge bracket banks
Category Leader in Ground Transportation Management
Gett + Rosecliff: A Value-Add Partnership

          UNIQUE BUSINESS MODEL IN SIZABLE, UNTOUCHED MARKET                                                  DOMAIN EXPERTISE & TRACK RECORD
     ✓ Gett is a technology platform primarily focused on corporate Ground
        Transportation Management (GTM), a market worth $100B globally                         ✓ Enduring relationships with leading technology companies and their founders
     ✓ Gett is the GTM category leader, serving over a quarter of the Fortune 500                  offer an exclusive network to Gett
       companies
     ✓ Gett’s cloud-based software aggregates existing transportation providers                ✓ Extensive experience in both private and public markets provides Gett insight
       (corporate fleet, ride-hailing, taxi, and limos) into one single platform, helping          and guidance on best practices for financial, operational and regulatory
       businesses manage all of their ground transportation spend, saving                          decisions
       businesses time and money
     ✓ Gett is building the global grid of ground transportation, embracing the entire         ✓ Delivers direct access to corporate America’s executive offices that will
       World, connecting the dots, similar to telephony and internet grids                         streamline Gett’s US market entry and broader expansion initiatives
     ✓ At Gett, we are inspired to become the standard in corporate ground
       transportation                                                                          ✓ Highly relevant transaction experience across the management team will
                                                                                                   guide Gett during the transaction to achieve an optimal outcome

           BY LEVERAGING ROSECLIFF’S TRANSACTION AND INDUSTRY EXPERIENCE, GETT WILL CAPITALIZE ON ITS ACCELERATION AND
            POSITIONING WITHIN THE B2B MARKETPLACE WITH AN AIM TO SIGNIFICANTLY INCREASE VALUE FOR ALL SHAREHOLDERS

            Brian Radecki                                  Jordan Zimmerman                           Michael Murphy                                 Heather Bellini
             WheelsUP                               Trademarked advertising strategy                    WheelsUP                             Coverage universe comprised of
               SKILLZ                                “Brandtailing” and deployed with                    Allbirds                           25+ software & internet companies,
     CoStar acquisitions and IPO                       companies, such as Advance                       Postmates                             including Workday, Microsoft,
         ACV Auctions IPO                            America and Carfax, to increase        Ro, Thirty Madison, PIPE, Petal Card                Salesforce, and Snowflake
                                                    market share and brand awareness

6
Category Leader in Ground Transportation Management
Transaction Summary
    Transaction Highlights                                                                                             Illustrative Pro Forma Valuation                                                                                Attractive Valuation Compared to Trading Peers
                                                                                                                       In $M                                                                                                           EV / 2022E Direct Gross Profit(5)

    •    Pro Forma Enterprise Value of $1B implying 8.6x 2022E Direct Gross Profit                                                                                                 Pre-Money Post-Money                                                                                                                          21.1x
         multiple
                                                                                                                            Share Price at Closing                                       $10.00                $10.00
    •                                                                (1)
         Transaction will result in approximately $248M of cash added to Gett’s
         balance sheet for product development, general corporate purposes, and                                             Shares Outstanding (M)                                            82.1               115.0 (2)                                                 15.0x
         debt repayment
    •    $30M common equity PIPE at $10.00 per share from Rosecliff sponsors and                                            Equity Value(3)                                                  $821                $1,151                                 (6)
                                                                                                                                                                                                                                                                                                      11.6x
         existing Gett shareholders                                                                                                                                                                                                             8.6x
    •    Assuming no redemptions, existing Gett shareholders will own 72.6% of the                                          Existing Net Debt / (Cash)(4)                                    $130                  $130
         pro forma company (assuming no dilution from warrants)
                                                                                                                                                       (1)
                                                                                                                            Less: Cash Raised                                                     --             ($248)

                                                                                                                            Enterprise Value                                                $950               $1,032
                                                                                                                                                                                                                                                 Gett             Combined Pe ers High Growth   Transactio nal
                                                                                                                            EV / 2022E Direct Gross Profit(5)                                 7.9x                  8.6x                                             Median (7)   Marketplaces Softwa re Med ian
                                                                                                                                                                                                                                                                                                                (9)

                                                                                                                                                                                                                                                                                           (8)
                                                                                                                                                                                                                                                                                    Median

    Pro Forma Ownership @ $10 / Share                                                                                  Sources of Funds                                                                                                    Uses of Funds
                                                                                                                       In $M                                                                                                               In $M

                                                                   22.0%
                                                                                                                                Cash Held in Trust (10)                                                      $253                                  Existing Shareholders Equity Rollover                                          $821

                                                                                                                                Existing Shareholders Equity Rollover                                         $821                                 Cash to Balance Sheet (1)                                                     $248
                                                                              5.4%
                72.6%                                                                                                           Existing Shareholders PIPE Investment                                           $15                                Est. Transaction Fees & Expenses                                                $35

                                                                                                                                Rosecliff Sponsor PIPE Investment                                               $15

                                          (10)                             (11)                                 (12)
        Rosecliff Public Shareholders            Rosecliff Sponsors               Existing Ge tt Shareholders                   Total Sources                                                             $1,104                                   Total Uses                                                                  $1,104

    Source: Company data, Capital IQ estimates as of 11/9/2021
    Notes: (1) Includes $253M from trust account (assuming no redemptions) and $30M PIPE comprising commitment from Rosecliff sponsors and existing Gett shareholders. Net of estimated transaction fees and expenses of $35M; (2) Excludes 25% of existing spons or shares subject to earn out. Does not account for dilution from
    warrants or Equity Incentive Plan. A portion of share consideration to existing shareholders may be deferred and issued up to two years post-closing; (3) Pre-Money Enterprise Value of $950M minus Net Debt of $130M as of 30 September 2021. Net Debt presented in the table assumed to be equal to Net Debt as of 30
    September 2021 for illustrative purposes; (4) Unaudited Net Debt figure as of 30 September 2021; (5) Direct Gross Profit is a non-IFRS metric. Numbers shown include opportunistic efforts; (6) Based on Pro Forma Enterprise Value, which accounts for dilution from sponsor promote; (7) Includes Allegro, Fiverr, Mercadolibre, The
7   Trade Desk, Upwork, Etsy, Avalara, Billtrust, Bill.com, Coupa and Olo; (8) Includes Allegro, Fiverr, Mercadolibre, The Trade Desk, Upwork and Etsy; (9) Includes Avalara, Billtrust, Bill.com, Coupa and Olo; (10) Assuming no redemptions; (11) Assuming $15 M PIPE investment from Rosecliff sponsors plus 75% of existing sponsor shares
    (25% of existing sponsor shares to be subject to earn out); (12) Assuming $15M PIPE investment from existing Gett shareholder s. Does not account for dilution from sponsor shares subject to earn out, warrants or Equity Incentive Plan
Category Leader in Ground Transportation Management
Founded in 2010, we began as a B2C/B2B business and have built a market-
     leading position in Israel which remains profitable and fast growing.

     This journey, as a single fleet operator, servicing B2B clients allowed us to
     discover much bigger problems our clients felt managing multiple transportation
     vendors. This is how we produced a solution which aggregates all different
     vendors on one single platform and controls the entire ground transportation
     spend for corporates.

     Since 2017, we are leading this new category which we believe we created.

    B2B Spend Management              Global Reach                      Scale
9
Category Leader in Ground Transportation Management
Gett Created a New Category and Dominates It
      in a Large, Outdated and Inefficient Market

          Ground Transportation Management                                                                                                                                                        CAGR in 2021E-2023E
          (GTM) Category Leader                                                                                                                                        44%                        Direct Gross Profit(2)(7)                               $656M                          2022E GMV (4)(5)

          Gett allows our corporate customers to manage all                                                                                                            114%                       Dollar expansion rate (4)(6)                            $335M                          2022E Revenue (4)

          their ground transportation spend by connecting
          them to a global grid of thousands of ground
          transportation providers via a single, cloud-based                                                                                                          >25%
                                                                                                                                                                                                  of companies from the
                                                                                                                                                                                                  Fortune 500 are our clients                               $121M                        2022E Direct Gross Profit (2)(4)
          software platform

                                                                                                                                                                                                  Cars available through our
                                                                                                                                                                       3M+                        1,700+ partner fleets on                                         +                     Positive Segmental
                                                                                                                                                                                                                                                                                         EBITDA since 2020
                                                                                                                                                                                                  the platform
                   $100B+                                           $26B                                   Up to 49%
           Global corporate ground                      Spend potential in 8 near                       Shadow costs savings
            transportation market(1)                      term focus markets (3)                             potential for                                                     Total Company EBITDA Expected to Be Positive
                                                                                                         our corporate clients
                                                                                                                                                                                             for Entire 2023

     Source: Company data, third party consultant, Euromonitor International Ltd. (Travel 2021 Edition, numbers extracted in September 2021), Market Research
     Notes: (1) Including B2B passenger car rental and leasing; (2) Includes mark-up charged from enterprises on top of driver fare and take rate from driver fare; Direct Gross Profit is a non-IFRS metric; (3) Calculated as corporate ground transportation market (excluding B2B passenger car rental
     and leasing) in US, UK, Israel, Germany, France, Italy, Spain and Russia multiplied by 15% long term take rate. Numbers exclude B2B passenger car rental and leasing; (4) Numbers shown include opportunistic efforts (5) GMV is a non-IFRS metric; (6) As of Q2 2021. Based on comparison of
     quarterly GMV generated by enterprise clients that were active in a given quarter and respective quarter 12 months ago; (7) Numbers shown are organic (exclude opportunistic efforts)

10
CORPORATE RIDERS
                                                                                                    4.92 (out of 5) User Satisfaction
          Strong Value
        Proposition on All                                                                                                              ●   All vendors in one app
                                                                                                                                        ●   Seamless expensing
        Sides of Our B2B                                                                                                                ●
                                                                                                                                        ●
                                                                                                                                            Ease of policy compliance
                                                                                                                                            Unprecedented value of fastest

          Marketplace                                                                                                                       pickup times or better budget
                                                                                                                                            spend

                  Asset-light, cloud-based software
                                                                              CORPORATE FLEETS                                          CORPORATIONS
                                                                               1,700+ Partner Fleets                                         25%+ of
                                                                                    3M+ Cars                                                Fortune 500
                  Truly global offering

                  Saving 23-49% of shadow cost(1)

                  Partnering with ground transportation
                  vendors rather than competing

                  Immense capacity with 3M+
                  cars on the platform currently                       ● Access to high quality captive demand                ● One stop shop with all vendors
                                                                       ● Zero CAC                                             ● Up to 49% spend reduction
11                                                                     ● Average checks >2x higher vs. B2C                    ● Controls, reports and security
     Source: Company data, third party analysis, App Store
     Note: (1) Refers to costs that are not visible to the corporate
Potential for Strong Growth at Scale

      Revenue                                                                                                                                    Direct Gross Profit(1)
      $M
                                                3.8x                                                                                             $M
                                                                                                                                                                            2.3x
                                              56% CAGR                                                                                                                    33% CAGR
                                                 From 2020A-2023E                                                                                                         From 2020A-2023E
                                                                                                                                                                                                        177
                                                                                                         613
                                                                                                                                                                                                         25
                                                                                                           125

                                                                                                                                                                                        121
                                                                                                                                                                                           8

                                                                             337
                                                                                                                                                                          85
                                                                                38                                                                       76
                                                                                                                                                                                                         152
                                                                                                           488
                                                 190
                     162                                                                                                                                                                 113
                                                                               299

                    2020A                        2021E                       2022E                       2023E                                          2020A          2021E           2022E            2023E
                                          Organic                Opportunistic Efforts                                                                             Organic      Opportunistic Efforts
     Source: Company data
     Note:
12
     (1) Includes mark-up charged from enterprises on top of driver fare and take rate from driver fare; Direct Gross Profit is a non-IFRS metric.
The Opportunity

     Corporate ground transportation is big, but it is a mess

13
Extremely Fragmented Ground Transportation Supply
             Entire Ground Transportation Spend (1) Is Spread across Several Types of                                                                                    Typical Ground Transportation Portfolio of a Large Enterprise Company
                           Supply and Tens of Thousands of Vendors                                                                                                                         Includes 20-60 Vendors Globally
     Global Corporate Ground Transportation Market Breakdown in 2019(2)

     Black Cars, Limos                                                                                                                        Taxi                                     NOR AM           EMEA            LA T AM         A PAC
     and Chauffeurs
                                                           27%
                                                                                       32%
       20,000+ v endors                                                                                                      5,000+ v endors

                                                                                                                                                                   Licensed
     Ride-Hailing                                                                                                                                                  Taxis

                                                                      41%
        15+ v endors

       $17,800M (3)       $2,600M(3)        $1,000M (3)        $400M (3)         $800M (3)         $500M (3)        $1,600M (3)       $1,700M (3)

                                                                                   21%               16%               10%               5%                        Ride Sharing
                             25%               24%
           32%
                                                                 42%                                                                                               /
                                                                                                                                                                   Ride-Hailing
           18%               31%
                                               43%
                                                                                   67%               74%               83%                95%

           50%                                                   58%
                             44%
                                               33%
                                                                                   13%               11%                8%                                         Black Cars,
                                                                                                                                                                   Limo &
                                                                                                                                                                   Chauffeur

                                    Taxi                Ride-Hailing                Black Cars, Limos and Chauffeurs

                                Market Reality: Actual Corporate Spend Goes Across Multiple Supply Layers and Tens of Thousands of Vendors.
                                                            A Typical Company Uses 20-60 Fleet Vendors Globally.
     Source: Third party data
14   Notes:
     (1) As of 2019. Based on third party estimates (2) By spend. Based on third party estimates (3) Represents each country’s immediately addressable market (in $ millions)
… Analog, Inefficient and Outdated Legacy Workflows
     Currently, all of the processes are broken across the entire journey from planning and booking to riding and reporting

                Planning                                          Booking                           On-Trip                            Management

                   Highly fragmented ground                                                                                                         Travel policy
                   transportation supply                            Manual                                                                          violations and
                                                                    interaction                                                                     uncontrolled
                                                   Ride details                                                                                     charges
                                                                    between riders                         Pick-up inefficiencies
                                                                                                           due to no real-time
                                                                                                           driver-rider interface
                                                                               Travel updates
                                                                                                                                                   Inconsistent
                  Ride requests via web
                                                                                                                                                   reports with no
                  forms, email or phone                                                                                                            integration into
                  disconnected from end
                                                                                                                                                   enterprise
                  corporate rider
                                                                                                                                                   resource planning
                  experience                                                                                                                       system
                                                                     Fragmented supply with                        Lack of automated
                                                                     multiple vendors with no /                    feedback for
                           Long processing                           low grade technology                          vendor quality
                           without real-time                         platform and expertise                        control
                           feedback
                                                                                                                                                        Billing and
                                                                                                                                                        invoicing
                                                                                                                                                        inefficiencies

                             Multiple booking                                                         Lack of in-ride
                             desks                                                                    corporate rider
                                                                                                      support
                             Inconsistent global                                                                                          Paper expense
                             policies and                                Manual or semi-automatic                                         reports, receipts and
                                                                                                         No corporate                     vouchers still exist
                             procedures                                  vendor management
                                                                                                         rider location
                                                                                                         visibility / lack of
                                                                                                         duty of care

15
Travel Leaders
     share their views on
     the state of the
     Ground Travel
     category in
     corporates.

     NYC | London | Berlin
     2021

                             Link to the video https://vimeo.com/564098136/834f38ddb4

16
Aggregation and Spend Management on a Single Enterprise
     Marketplace Software Platform

              Supply Aggregation                     Spend Management

                                                                Reduction of corporate
                                                                ground transportation
                          Aggregating a multitude
                                                                spend by up to 49%
                          of ground transportation
                          vendors into a single
                                                                Back-office overhead
                          platform
                                                                reduction

                          Global coverage                       Transformation of a
                                                                large bulk of expenses
                                                                into digital

                                                                Enforcement of travel
                                                                policy compliance and
                                                                fraud prevention

18
Gett is Trusted by the Leading Global Companies and Already
     Helps >25% of the Fortune 500 Companies Save Time and Money

                                                                  9/10
                                                                  Top Investment Banks(1)

                                                                  3/4
                                                                  Top Consultancies(2)

                                                                  4/4
                                                                  Big Four Accounting Firms

                                                                  8/10
                                                                  Top Law Firms(3)

                                                                  8/10
                                                                  Most Valuable Brands(4)

                                                                  4/5
                                                                  FAANG

     Notes:
     (1) Based on Financial Times league table as of March 2021
     (2) Based on Vault ranking as of August 2020
     (3) Based on 2022 Vault law 100 ranking
19   (4) Based on Forbes ranking for 2020
Gett’s Solution Appeals to Key Enterprise
     Benefitting every   Decision-makers
     stakeholder
                              Head of Procurement         Single platform aggregating all ground
                                                          transportation vendors

                                                          23 - 49% reduction in corporate
                              Chief Financial Officer     ground transportation spend

                                                          Data security and transformation of a
                              Chief Digital Officer       large bulk of expenses into digital

                                                          Seamless employee / corporate rider
                              Head of HR                  experience

                                                          Duty of care
                                                          Green / sustainability agenda
                              CEO, CFO, HR, Procurement
                                                          Standardization of global processes and
                                                          enforcement of travel policy

20
Gett’s Solution Allows Corporate Clients to Reduce Ground
     Transportation Spend by up to 49% Annually
     Illustrative Potential Annual Savings of an Enterprise Client with 2,500 Corporate Riders(1)

                                                                                                   Average Savings                          Current Spend                Savings

       1       Travel policy compliance                                                             5 – 24%                                                      $239k - $1,187k

               Real time price                                                                                                                $5.4M
       2                                                                                            15 – 22%                                                     $756k - $1,075k
               comparison
                                                                                                                                              $5M on fares +

                                                                                                                                              $367k on receipt
                                                                                                                                              processing
       3       Back-office efficiencies                                                             $1-2/receipt                                                 $113k - $212k

               Corporate rider
       4       efficiencies                                                                         $1-1.5/receipt                                               $92k - $155k
               (front office employee time)
                                                                                                                                                                 $1.2M - $2.6M
     Source: Company data
                                                                                                                                            Annual savings
                                                                                                                                               (pre-Gett fee)
     Notes:                                                                                                                                                      23% – 49%
     (1) Assumes 2,500 corporate riders, with each rider taking 40 rides per year with an average fare of $50. Presented for illustrative
21   purposes only
Up to 49%                                                     Big Four Audit Firm
                 ANNUAL SAVINGS                               “Gett has been instrumental in reducing our
                                                             total cost of ground transportation - we got rid
                                                            of abuse and minimized back-office overheads.
                                                             Given our higher employee satisfaction rates,
     Gett’s software enabled a reduction in travel policy       this is definitely a win-win. Outstanding.”
             violation and uncontrolled charges
                                                                               Senior Partner

22
How Big Could the GTM Opportunity Be?
                       B2C                                                                                                                      B2B

                                                                                                   >$285B(1)                                                                                                                          >$100B(3)
     Online
     Travel

                                                                                                    Total valuation (2)                                                                                                                Total valuation (2)

                       B2C                                                                                                                      B2B

                                                                                                                                                                                                                                               ?
     Transportation

                                                                                                   >$240B(4)
         Online

                                                                                                    Total valuation (2)                                                                                                                 Total valuation

                      Size of the bubble corresponds to the company’s valuation

      Source: Capital IQ, Pitchbook, public sources
      Notes:
      (1) Figure includes valuation of Booking.com, Airbnb, TripAdvisor, Ctrip, Expedia, MakeMyTrip, Despegar, eDreams, Trivago and lastminute.com
      (2) All valuations represent market capitalization of the companies as of 8-October-2021 except of the following: valuation for CWT and BCD Travel assumes indicative total transaction value multiple of 1x for illustrative purposes; valuation for
      Travelport acquisition by Siris Capital Group and Evergreen Capital closed in May 2019; valuation for TripActions at Series F round raised in October 2021; valuation for Global Business Travel potential deal with Carlyle and GIC in May 2020;
      valuation for Bolt at Series D round raised in December 2020
      (3) Figure includes valuation of Amadeus, CWT, BCD Travel, Sabre, Travelport, TripActions, Global Business Travel and TravelPark
23    (4) Figure includes valuation of Uber, Grab, DiDi, Bolt, Cabify and Lyft
Large Addressable Market of $100B+ Globally

                                                        $101B                                                                                                         Corporate Ground Transportation
                               Global corporate ground transportation                                                                                                       is $100B+ market(2)
                                   (including B2B passenger car
                                                            (1)(2)
                                         rental and leasing)

                                                          $51B
                                                 Global corporate ground
                                                   transportation market                                                                                                     Global corporate GTM is
                                               (excluding B2B passenger car
                                                     rental and leasing) (1)                                                                                              expected to grow at a CAGR of
                                                                                                                                                                          18% between 2019 – 2025E(2)
                                                         $26B
                                                      Corporate ground
                                                   transportation in eight
                                                        focus markets
                                                 (excluding B2B passenger
                                                                                                                                                                  Gett’s solution addresses needs of all
                                                   car rental and leasing) (1)                                                                                      types of corporates tapping into
                                                                                                                                                                         entire corporate ground
      Ground transportation includes taxi, ride                            Only in cities with population of
                                                                                                                                                                          transportation spend(3)
       hailing, chauffeur & limousine services                                   500k+ inhabitants

     Source: Company data, third party consultant, Euromonitor International Ltd. (Travel 2021 Edition, numbers extracted in September 2021), Market Research
     Notes:
     (1) All data is 2019 unless stated otherwise; B2B passenger car leasing excludes heavy trucks leasing. (2)Total market is estimated based on sum of third -party data for corporate ground transportation market (excluding B2B passenger car rental and leasing); B2B
     passenger car rental market based on Euromonitor International Ltd. data (Travel 2021 Edition, numbers extracted in September 2021) and B2B passenger car leasing market based on Market Research data; (3) According to third party assessment
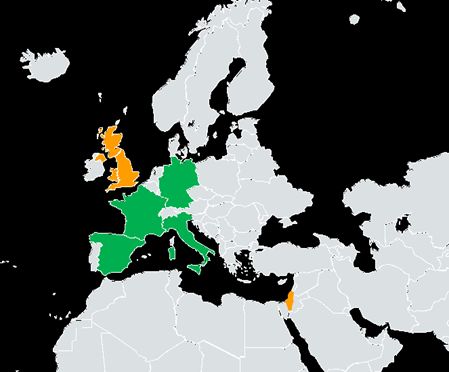
25   Forward-looking statements and marketing sizing information are based upon estimates and assumptions that are inherently uncertain, and may differ from current expectations and estimates.
Gett Expects to Cover 50%+ of Immediately Addressable Market in Near Term

                                                   Immediately Addressable Market in Eight Focus Regions (1) of $26B

           US Expansion Strategy
                    On-demand taxi and black car
                    providers onboarded

                    Onboarding over 80 traditional
                    B2B fleets for national coverage

       +        +
                    Upselling existing global
       +        +
                    customers for service in the US
                                                                                                                                 $1.7B

                                                                                                 $2.6B

                                                                                                                 $1.6B

                                                         $17.8B

                                                                                                         $1.0B

                                                                                                                 $0.5B
                Gett’s current presence                                                         $0.8B

                Launch in 2H 2021                                                                                        $0.4B

                Launch in 1H 2022

           $B   Corporate ground transportation market size
                in the country(1)
     Source: Company data; third-party data
     Note:
26
     (1) Excluding B2B car rental and leasing
Multiple Avenues for Growth
                                                          4
                                                          Continue
                                                          transition to
                                            3             partner fleet model

                                            Attract new
                        2                   clients

         1               Upsell to
                         existing clients
         Expand
         geographical
         footprint

27
~$500M of Direct Gross Profit(1)(2) Upside Potential from Just Existing Clients

       Opportunity to Increase Direct Gross Profit from Our Existing Enterprise Clients Portfolio by ~10x Through
       Extension of Supply and Geographical Coverage

                                                                                                                                                                                                                                    ~$500M
             3rd party fleets

                                                                                         Broadening supply
                                                                                         coverage

                                                                                                                                                                    ~10x
                                                                                                                                                                          upside
             Proprietary fleet

                                                                                                                                                                                     Extending geographical footprint

                                                    Existing 3 markets(3)                                                                                                                  Additional 5 focus markets(4)

                                                         Current position                                             Potential
28
     Notes: (1) Includes mark-up charged from enterprises on top of driver fare and take rate from driver fare; (2) Direct Gross Profit is a non-IFRS metric; (3) UK, Russia and Israel; (4) US, Spain, France, Germany and Italy
Market Reality – Actual Corporate Spend Goes Across 4 Supply Layers and
      a Typical Large Enterprise Uses 20-60 Fleet Vendors Globally

       Chauffeur                                                                                                                                Taxi
       Luxury travel for up to 7                                                                                                                Regulated taxi w ith
       passengers. Most                        A global enterprise                                                                                                         A global enterprise
                                                                                                                                                professional drivers,
       exclusive luxury travel                 usually uses 3-10                                                                                                           usually uses 5-15
                                                                                                                                                adhering to predefined
       service type, including                 fleets in this                                                                                                              fleets in this
                                               segment(1)                                                                                       local taxi standards and   segment(1)
       VIP meet & greet                                                                                                                         pricing
       service at airports

       Black Car                                                                                                                                Ride-Hailing
                                                                                                                                                Transportation
       Traditional corporate
                                               A global enterprise                                                                              netw orks, typically       A global enterprise
       fleets, typically offering
                                               usually uses 10-30                                                                               providing a range of       usually uses 5-7
       a range of services in
                                               fleets in this                                                                                   private hire vehicle       fleets in this
       the standard and                        segment(1)                                                                                                                  segment(1)
                                                                                                                                                services, usually
       executive categories
                                                                                                                                                several players per
                                                                                                                                                market
                                                                                  Segment size on the circle corresponds to share of supply
                                                                                layer in global corporate ground transportation spend in 2019

                                                                 Fact: A Large Enterprise Operating in 10 Countries Uses 20-60 Vendors
                                                                                 across Different Supply Layers in Total

     Source: Company data, company and third party estimates
30
     Note: (1) # of vendors for a company operating in 10 countries
Third Party Supply Already Accounts for ~40% of B2B Rides
      and Is Expected to Reach 75% by the End of 2022
      Share of Rides Performed by Partner Fleets (%)
      80%                                                                                                                     75%+

      60%
                                                                                                                                                  75%+        (1)
                                                                                                                                            by the end of 2022E

      40%

      20%                                                                                                                                          40%
                                                                                                                                                in Q3 2021
       0%
                Q1     Q2     Q3      Q4   Q1   Q2   Q3   Q4   Q1    Q2      Q3   Q4   Q1   Q2   Q3   Q4   Q1    Q2     Q3   EndEnd
                                                                                                                                 of 2022E
                                                                                                                                 of
                         2017A                   2018A               2019A                   2020A              2021A          2022

                                     Development of aggregation technology platform

                                  Development of spend management technology platform

                                                          Platform rollout
31   Source: Company data
     Note: (1) Company estimate
End-to-End Enterprise Marketplace Software Platform for Managing
     Ground Transportation
                                                  Spend                            Finance Back-                                            Fleet Back-office
            User Management                                                                                  Booking Tools
                                                Management                             office                                                 Management
     • Employee and vendor           • Multiple tools to deliver up to   • Billing, invoicing and   • Seamless integration         • Billing and payments
       management                      49% savings on corporate            payments                   betw een web and corporate   • Reporting and data analytics
     • Quick and convenient            ground transportation             • VAT compliance             rider app
                                                                                                                                   • Monitoring and
       corporate riders onboarding   • Travel policy enforcement         • HR and payroll systems   • Travel booking for             performance
     • Integration w ith corporate   • Detailed reporting per              integrations               employees or guests
       provisioning systems            employee and per ride                                        • 24/7 support
                                     • Data analytics

33
Differentiated Corporate Ground Transportation Management Solution

                                                    Platform                   Savings and Compliance                        User Experience                           Global Reach
                                                                                                                                                                 (Globally consistent, supports
                                       (In-depth integration, on-demand         (Suite of tools to deliver savings     (On par or better than ride-hailing
                                                                                                                                                               international billing, invoicing and
                                           and pre-book tools, scale)                   and compliance)                     or fleet apps and w eb)
                                                                                                                                                                     tax/VAT compliance)

      GTM                                           1.7k fleets               Up to 49% savings on entire GT spend     Rider-centered products since 2010
                                     Taxi, Ride-hail, PHV, Chauffeur & Limo               Duty of care               24/7 Enterprise Service-Level Agreement Free to work with any vendor globally
                                                 Supply agnostic                  Multinational/enterprise focus                      (“SLA”)
                                                                                    Various payment methods

     Single-                                                                     Largely unmanaged GT spend
                 Ride-hailers
     vendor                                       Single-vendor                        Duty of care issues                        Core strength                       National or regional
                                                  Ride-hail only               SME focus, single-vendor analytics             Consumer/SME SLA                          Limited alliances
                                         Competes with other vendors                Limited payment methods                                                            Competition issues

      Strength     Less dev eloped      Strategic trade-of f

34
Seamless Integration into Enterprise Software Ecosystem

                                                                                                                            Enterprise
                                                                                                                            Application                   Employee portal
                                                                                                                                                          (in-house and external)
                                                                                                                            Ecosystem

      Supports integrations with
                                                                                                                                   Gett                                                                    Seamless integrations with
      global leading HR                                                                                                          Platform                                                                  in-house and external
      information and single                                                                                   Onboarding
                                                                                                                                                                                                           booking tools
      sign-on systems
                                                                                                                                                          Rides API(3)
                                                                                                                     User
                                                                                                                     management         Booking
                                                                                             Provisioning(1)

                                                                                         Policy &
                                                                                                                                    c
                                                                                                                                                                                    SaaS expense systems
                                                                                         administration
                                                                                                                                                                          (4)
                                                                                                                                                               Expensing
                                                                                                                      Spend                Finance
                                                                                                                      management                                                                           Removes manual hassle via
     Enables a variety of reporting                                                                Anti-fraud
                                                                                                               (2)                      back-office
                                                                                                                                                                                                           integrations with expense
     and analytics solutions from
                                                                                                                                                                                                           management and enterprise
     SaaS to on-premises
                                                                                Scheduled &
                                                                                                                     Reporting
                                                                                                                     and
                                                                                                                                                    (1)
                                                                                                                                            Invoicing                                                      resource planning systems
                                                                                ad-hoc reporting                     Analytics

                                                                             Early warning
                                                                             system                                                                             ERPs
                                                                                                    BI, Analytics and
                                                                                                    visualization(1)

                                                                                                                                                                         ERP

     Notes:
     (1) SFTP and file-based
     (2) Gett back-end
     (3) API in place and Way2Go, Moovex integrations active. Other providers to be added based on customer demand
35   (4) API in place and Concur integration active. Other providers to be added based on customer demand
Financial Highlights
     Enormous market sizing and growth potential for tens of years ahead

                    $656M                                           2022E GMV(1)(2)                                                                                           $100B+                                         Global corporate ground
                                                                                                                                                                                                                             transportation spend (5)

                    $335M                                           2022E Revenue (2)

                                                                                                                                                                                                                             Direct Gross Profit (3) upside
                      $121M                                         2022E Direct Gross Profit                     (2)(3)
                                                                                                                                                                          ~$500M                                             potential from just existing
                                                                                                                                                                                                                             customers (6) (7)

                          44%                                       CAGR in 2021E-2023E
                                                                    Direct Gross Profit (3)(8)

                         114%                                       Dollar expansion rate (4)

                 Positive Segmental                                 Consolidated Segmental EBITDA
                 EBITDA since 2020                                  (before RnD and corporate overheads)

              Total Company EBITDA
                                                                    Company EBITDA before public
              Expected to Be Positive
                                                                    Company costs
                  for Entire 2023
     Source: Company data, third party consultant, Euromonitor International Ltd. (Travel 2021 Edition, numbers extracted in Septe mber 2021), Market Research
     Notes: (1) GMV is a non-IFRS metric; (2) Numbers shown include opportunistic efforts; (3) Includes mark-up charged from enterprises on top of driver fare and take rate from driver fare;Direct Gross Profit is a non-IFRS metric; (4) As of 2Q 2021. Based on comparison of quarterly GMV
37   generated by enterprise clients that were active in a given quarter and respective quarter 12 months ago; (5) Including B2B passenger car rental and leasing; (6) Assuming existing clients will use Gett services in the near-term focus markets; (7) Reference page 29 for more details;
     (8) Numbers shown are organic (excludes opportunistic efforts)
Gett's Business Model has Proven Resilient
     Outperforming Comparable Markets in Continued Travel in 2020
     Travel Decline from 2019 to 2020 (1)

                                                                          (2)
                            B2B Direct Gross Profit

                                                       Gett's Business Proved Resilient Despite Covid-19's Widespread Impact on Activity and TAM
                                       B2B Segment is Well-Positioned to Experience Meaningful Uplift as the Market Recovers to Pre-Covid Levels

      Source: Company data, third-party data, Capital IQ as of 5/4/2021.
      Note: Ride Hail companies consist of Uber and Lyft. Car rental companies consist of Avis, Europcar, and Hertz. (1) Represents change of GMV from 2019 to 2020 for Corporate Ground, Car Rental and Ride Hail markets and change of B2B Direct Gross Profit (take rate) from 2019 to 2020 for Gett.
38    (2) Direct Gross Profit is a non-IFRS metric.
Gett Operates a Differentiated Business Model with Potential for High Profitability
     Illustrative Unit Economics
                                                                                                                      Shift To A Partner Fleet Model From 2017

                      Traditional                                                                       B2B Marketplace                                                                  B2B Marketplace +
                   Ride-Hailing Fleet                                                                    Single Vendor                                                                   Spend Management
                   Uber, Lyft, Ola, Didi                                                                    Legacy Gett                                                                   Go-Forward Gett                      Continued transition
                       (% of driver fare)                                                                   (% of driver fare)                                                                     (% of driver fare)          to partner fleet model is
                                                                                                                                                                                                                               capital light and reduces
                                                                                                115%             Total client fare                                               115%               Total client fare
                                                                                                                                                                                                                               operational complexity,
                                                                                                  15%            Corporate mark-up                                                 15%              Spend management yield     supporting high
                                                                                                                                                                                                                               marginality business
           100%              Client = Driver fare                                              100%              Driver fare                                                    100%                Driver fare

                             Take-rate from driver fare                                                          Direct gross profit from                                                           Direct gross profit from
             20%             (excl. driver’s insurance cost)                                      15%            driver fare                                                    0-3%                fleet partners

             20%             Take-rate                                                           30%             Direct Gross Profit                                        15-18%                  Direct Gross Profit                75%+
                                                                                                                                                                                                                                of 3rd party B2B rides
                             Marketplace cost                                                                    Marketplace cost                                                                   Marketplace cost
       10-15%                (subsidies, DAC)                                                5-10%               (subsidies, DAC)                                                    0%             (subsidies, DAC)             by the end of 2022E

                                                                                                                                                                                                    Sales and account
                0%           Sales team                                                             5%           Sales team                                                          4%             management

              10%            OPEX and G&A                                                         10%            OPEX and G&A                                                        5%             OPEX and G&A

        (5)-0%               EBITDA(1)                                                      5-10%                EBITDA(1)                                                      6-9%                EBITDA(1)
                                                                                                                                                                                                                                        40%
                                                                                                                                                                                                                                of 3rd party B2B rides
                               (25%)                                                                                 17%                                                                               40%+                            in Q3 2021
      EBITDA Margin (1) (% of Direct Gross Profit(1))                                   EBITDA Margin (1) (% of Direct Gross Profit(1))                                     EBITDA Margin (1) (% of Direct Gross Profit(1))

39    Note: Company financials. Figures are illustrative and reflect Management's view of long-term / steady state KPIs. (1) Direct Gross Profit, EBITDA and EBITDA Margin are non-IFRS metrics.
Positive Segmental EBITDA Since 2020
     Total Company EBITDA Expected to Be Positive for Entire 2023
      Expanding Contribution Profit                                                                        Consolidated Segmental EBITDA                                                                        Total Company EBITDA
       Contribution Margin (% of Direct Gross Profit)(1)(2)(3)                                             Segmental EBITDA (% of Direct Gross Profit)(2)(3)                                                    Total Company Adjusted EBITDA Before Public Company Costs
                                                                                                                                                                                                                (% of Direct Gross Profit)(2)(3)
       $M                                                                                                  $M                                                                                                   $M
                                                                                      70%
                                                                        64%
                                                           57%                                                                                                                              44%
                                              58%                                                                                                                               33%                                                                                                               2%
                                                                                                                                                                                                                                                                                    -19%
                                                                                                                                                                  17%
                                                                                                                                                      14%                                                                                                 -32%         -35%
                                                                                                                                       -28%                                                                                                   -73%
                                                                                     $106                                    -40%                                                                                              -106%
                      15%
                                                                                                               -75%
                                         12%                                                                                                                                                $67                 -148%
                                                                                                                                                                                                                                                                                                  $3
     -12%                                                                $73                                                                                                                                       -$100 -$89                -$68         -$25         -$30         -$21
                                                                                                                                                                                $37

                                                            $49                                                                                                     $14
                                               $44                                                                                                     $11
                                                                                                                 -$51        -$34         -$26
                                                                                                                                                                                                                                                              $10M, $8M and $8M public company costs
                      $13          $11                                                                                                                                                                                                                        are expected in 2021E, 2022E and 2023E,
          -$8                                                                                                                                                                                                                                                 respectively, on top of the numbers shown
                                                                                                                                                                                                                                                              in the chart

         17A          18A          19A         20A          21E         22E          23E                         17A          18A         19A         20A           21E         22E          23E                       17A          18A         19A         20A           21E         22E          23E

      Source: Company financials.
      Note: Numbers excluding percentages are in millions. (1) Proxy for gross profit, but may be overstated. (2) Direct Gross Profit, Contribution Profit, Segmental EBITDA and Adjusted EBITDA Before Public Company C osts are non-IFRS metrics. (3) 2017 and 2018 not subject to PCAOB audit; 2019 and 2020
40    PCAOB audited; 2021 to 2023 Company projections.
Strong Growth Along 2021, 3x Gain in EBITDA on the Segmental Level

                               Improving Contribution Profit                                                                                                        Significant Growth in Segmental EBITDA through 2021
                               Contribution Margin (% of Direct Gross Profit)(1)(2)(3)                                                                              Segmental EBITDA (% of Direct Gross Profit)(2)(3)(4)

                                                                                                                     60%
                                                                                                                                                                                                                                                                                  24%

                                                        57%                        55%                                                                                                                                                              16%
                                                                                                                 $14.5M                                                                                             17%                                                           $5.8M
                        56%
                                                                                                                                                                                     10%
                                                                                 $12.0M
                                                   $11.8M
                   $10.3M                                                                                                                                                                                                                         $3.5M
                                                                                                                                                                                                                  $3.4M

                                                                                                                                                                                  $1.8M

                       Q1                             Q2                            Q3E                            Q4E                                                               Q1                             Q2                             Q3E                             Q4E

                                                                     2021                                                                                                                                                        2021

      Source: Company financials.
      Note: Numbers excluding percentages are in millions. (1) Proxy for gross profit, but may be overstated. (2) Direct Gross Profit, Contribution Profit, Segmental EBITDA and Adjusted EBITDA Before Public Company C osts are non-IFRS metrics. (3) 2017 and 2018 not subject to PCAOB audit; 2019 and 2020
41    PCAOB audited; 2021 to 2023 Company projections. (4) We have applied IFRS 16 following our PCAOB audit and to aid comparability the $1.3m of capitalized lease charges is spread evenly through 2021.
Long-Term Margin Progression
     Excluding Impact of Opportunistic Efforts Such as M&A, New Product Initiatives and Others

                                                                                                                                                                                                            Long-Term
                                                                      2018                          2019                          2020                        2021E                        2022E   2023E   Target Model

     Contribution Margin (1)                                           15%                            12%                          58%                           57%                       64%     70%        ~75%

     Segmental EBITDA
                                                                     (40%)                         (28%)                            14%                           17%                      33%     44%        ~55%
     Margin(1)(2)

     Total Company
                                                                   (106%)                          (73%)                         (32%)                         (35%)                       (19%)    2%        ~30%
     EBITDA (1)(2)

      Notes: (1) Contribution Margin, Segmental EBITDA Margin and Total Company Adjusted EBITDA Before Public Company Costs Margin are non-IFRS metrics. (2) As % of Direct Gross Profit

42
Gett Is at the Intersection Between High Growth Marketplace
     Category Leaders and Transaction Software Companies

                   High Growth Marketplaces       Transactional Software

• Aggregation of fragmented                                     • Focus on enterprise spend
     sources of supply & demand                                     management

•    Network effect businesses                                  •   Transactional & Vertical
                                                                    business models
•    Transaction-based pricing
     model                                                      • Enterprise end customer (B2B
                                                                    & B2B2C models)
• B2C end customers

• Models driven by consumer
     acquisition spend

44
There Is Significant Upside in Trading Multiples Against Our Peers,
     While Our Growth Outlook Is Materially Stronger
        2021E – 2023E Direct Gross Profit(1) CAGR

                                                                                                                                                                                                                                                          54%
                  44%
                                                                                                                                                      36%
                                                                                                                      27%             29%                                                                                                29%
                                     25%                     25%                                       24%                                                                    25%                                        25%
                                                                                         23%                                                                                                              22%
                                                                           20%                                                                                                                 19%

                                   Combined              High Growth                                                                                                      Transactional
                                    Median               Marketplaces                                                                                                       Software
                                                            Median                                                                                                           Median

        EV / Direct Gross Profit(1)
                                                                                                                                                                                                                                                        49.8x

                   Material upside
                    against peers
                                                                                                                                                                                                                                                                33.2x

                                                                                                                                                    22.8x                                                                              21.4x
                                                                                                                                                                           21.1x                                       21.1x
                                                                                                                                                                                                       18.7x
                                   15.0x                                                                                            15.0x                   18.0x                  16.4x                                       16.6x           16.4x
                                                                                                                    13.1x                                                                                      15.4x
                    (2)(3)                                11.6x                                      10.2x
                8.6x                       11.8x                                       8.2x                                 10.9x           11.8x
                             (3)                                  9.6x   7.6x                                8.3x                                                                          8.5x 7.1x
                       5.8x                                                     6.2x          6.1x

                                   Combined              High Growth                                                                                                     Transactional                                                                             (4)

                                    Median               Marketplaces                                                                                                      Software
     Source: Capital IQ estimates as of 11/6/2021.          Median                                                                                                          Median
                                                                                                                                                                                                                                                 2022      2023
     Notes: Figures reported in PLN and RUB converted to USD at the spot rate as of 11/8/2021. (1) Direct Gross Profit is a non-IFRS metric. (2) Numbers shown include opportunistic efforts
                                                                                                                                                                                                               High Growth Marketplaces
     (3) Based on post-money Aggregate Value, which accounts for dilution from sponsor promote; (4) Bill.com has been adjusted to reflect the pro forma impact of the recently
45   announced $625M acquisition of Invoice2go.                                                                                                                                                                   Transactional Software
There is massive unmanaged   There is $100B+
     corporate spend on           unmanaged corporate
     procurement and supplier     ground transportation
     management for which there   spend for which Gett
     is Coupa                     aspires to manage

47
The Corporate GTM Technology Leader
                                                                                                                           ▪ Extremely Fragmented, $100B+ addressable market with Gett providing unique
                                        1             Large Addressable Market
                                                                                                                               aggregation capabilities

                                                      Category Creator w ith Differentiated                                ▪ The first enterprise software solution for full aggregation and management of corporate
                                        2             Enterprise Grade Product and
                                                      Cutting Edge Technology
                                                                                                                               ground transportation spend

                                                      Unique Com bination of a
                                                                                                                           ▪ Marketplace model drives flywheel effect of scale and liquidity
                                        3             Marketplace and Transactional
                                                      Softw are Characteristics
                                                                                                                           ▪ Runway to subscription model migration
                                                                                                                           ▪ Scalable, asset-light business model

                                                                                                                           ▪ Already signed over a quarter of Fortune 500 companies
                                        4             Loyal Blue-Chip Customer Base                                        ▪ High customer retention and dollar expansion (114%) driven by up to 49% savings on
                                                                                                                               corporate ground transportation spend

                                                                                                                           ▪ 44% CAGR Direct Gross Profit(1)(2)(3) in 2021E-23E
                                                      Highly Attractive Financial Profile
                                        5             w ith Consistent Track Record of
                                                      Execution
                                                                                                                           ▪ Positive Segmental EBITDA since 2020
                                                                                                                           ▪ Total CompanyEBITDA Expected to Be Positive for Entire 2023

                                                                                                                           ▪ Expand geographical footprint, upsell to existing clients, attract new clients and continue
                                        6             Multiple Avenues for Growth                                              transition to partner fleet model
                                                                                                                           ▪ $500M Direct Gross Profit upside from just existing customers

                                                      Experienced Founder-led                                              ▪ Extensive track-record of scaling hyper-growth businesses with >100 years combined
                                                                                                                               experience in technologyand enterprise
                                        7             Management Team and
                                                      Market-leading HR Metrics                                            ▪ Market-leading talent retention and employee satisfaction metrics
48
     Notes: (1) Includes mark-up charged from enterprises on top of driver fare and take rate from driver fare; (2) Direct Gross Profit and EBITDA Margin are non-IFRS metrics; (3) Numbers shown are organic (exclude opportunistic efforts)
● Serial entrepreneur,
                                    Gett is his 3rd startup. Successf ully exited the f irst two
                               ● 20+ y ears of CEO experience in hy per-growth startups and public
                                    companies in Silicon Valley and Israel                                                                     Enterprise-level technology and corporate
                               ● B2B sales record of $300M in publicly traded sof tware company
                                                                                                                                               sales expertise is at the core of the Gett team.
  Dave Waiser
  Founder & CEO

           Andrew                            Aliaksei                    Evan Nacke                        Mandeep                     Max                           Matteo de                                                  Tyson                             Lena
                                                                                                                                                                                                Mark Oun
           Verbitsky                         Aneichyk                    General                           Bajw a                                                    Renzi                                                      Niem eyer                         Breen
                                                                                                                                       Krasnykh                                                 CEO Delivery
                                                                         Counsel                           Chief of                                                                                                             MD UK                             Global Financial
           Deputy CEO                        CFO                                                                                       COO                           MD GTM                     & MD ISR
                                                                                                           People                                                                                                                                                 Controller
                                                                                                                                                                                       ●   10-year top             ●    5-year top performer         ●    25 years of
● 20+ years of                  ● 12 years at Credit           ● Former Legal                 ● Seasoned                  ● Experienced                 ● Strong operator with
                                                                                                                                                                                           performer at Gett            at Gett                           experience with
  experience in the               Suisse leading                 Director at Bank of             professional with          operations, product           20 years of
                                                                                                                                                                                       ●   20 years of             ●    Global operations                 global advisory firms,
  travel and                      private placement              America, Merrill                15 years of                and corporate                 experience, recently
                                                                                                                                                                                           experience in                and technology                    corporates and
  technology                      and pre-IPO group              Lynch and VP at                 experience                 development leader            as CEO at BP Pulse
                                                                                                                                                                                           executive                    leader with 15+                   publicly listed
● Executive roles in            ● Raised $20B in                 Credit Suisse                   supporting high            with 15+ years of           ● Unique mix of
                                                                                                                                                                                           management and               years of experience,              businesses in the UK
  Airbnb,                         capital for 8 IPOs           ● Previously with                 pace growth                experience in tech,           Goldman Sachs,
                                                                                                                                                                                           business                     holding senior mgmt               and US
  KAYAK/Booking.com               and 11 private                 Freshfields                     companies like             telecom and media             McKinsey and
  and DeliveryHero                placements                                                     WeWork and Cloud         ● Previously served at          operational                      development roles            roles at Amazon,
                                                                                                 Kitchen                    Intel and PwC                 business MD at                                                NCR and T-Mobile
                                                                                                                                                          Pirelli

               Tal Shtainman                       Yaki Zakai                          Dina Dembo                      Ovo Gharoro                        Dan Hobden                       Duncan Burgess                     Runli Guo                        Kalliope Kefallinos
               VP Commercial                       CTO                                 Chief Information               Chief Data                         IR/Global FP&A                   Internal controls                  CISO                             Legal Counsel
               Success                                                                 Officer                         Officer

      ● Former VP Sales at MSFT                                            ●   IT executive with 15+         ●   Multi-award winning Head      ●   13 years of experience in     ●   Experienced finance       ●       A strategic leader in     ●       Experienced capital
                                           ● 15 years of leading
        B2B portfolio in Israel                                                years of experience               of Data with 15 years of          the finance domain in             professional with 20+             cybersecurity with more           markets counsel who has
                                             software development
      ● 20 years of sales growth,                                              building and leading              experience in both                accountancy and equity            years of experience in            than 15 years of                  successfully led IPO and
                                             groups at HP Enterprise
        analytics and compliance                                               strategic international           consulting and                    research. Joined from             senior finance and CFO            experience                        other equity offerings at top
                                             and Amazon
        expertise                                                              transformation projects           management at M&G and             Credit Suisse                     positions                 ●       Ph.D. in AI                       law firms both in New York
                                                                               at Amdocs & Zim                   Deloitte                                                                                                                                and London

 50
You can also read