CEO PAY AND THE RISE OF RELATIVE PERFORMANCE CONTRACTS: A QUESTION OF GOVERNANCE?
←
→
Page content transcription
If your browser does not render page correctly, please read the page content below
CEO PAY AND THE RISE OF RELATIVE
PERFORMANCE CONTRACTS: A QUESTION OF
GOVERNANCE?

                                                                                                             Downloaded from https://academic.oup.com/jeea/article/19/5/2513/6128672 by guest on 18 November 2021
Brian Bell                                              Simone Pedemonte
King’s Business School and Centre for                   Financial Conduct Authority
Economic Performance, London School
of Economics
John Van Reenen
Department of Economics, London
School of Economics and Massachusetts
Institute of Technology

Abstract
We exploit the large rise in relative performance awards in the United Kingdom over the last two
decades to investigate whether these contracts improve the alignment between CEO pay and firm
performance. We first document that corporate governance appears to be stronger when institutional
ownership is greater. Then, using hand-collected data from annual reports on explicit contracts,
we show that (1) CEO pay still responds more to increases in the firms’ stock performance than
to decreases, and, importantly, this asymmetry is stronger when corporate governance is weak as
measured by low institutional ownership; and (2) “pay for luck” persists as remuneration increases
with random positive shocks, even when the CEO has equity awards that explicitly condition on
firm performance relative to peer firms in the same sector. A major reason why relative performance
contracts do not eliminate pay for luck is that CEOs who fail to meet the terms of their past
performance awards are able to obtain more generous new equity rewards in the future in weakly
governed firms. We show the mechanism operates both through the quantum of shares and the
structure of new contracts. These findings suggest that reforms to the formal structure of CEO pay
contracts are unlikely to align incentives in the absence of strong corporate governance. (JEL: J33,
J31, G30)

The editor in charge of this paper was Imran Rasul.
Acknowledgments: We are grateful to the editor, Imran Rasul, three anonymous referees, Richard Belfield,
Bob Gibbons, Oliver Hart, Bengt Holmstrom, Steve Kaplan, Louis Kaplow, Kai Li, Bob Pindyck, and
participants in seminars at AEA, ECB, Harvard, IZA/SOLE Conference, LSE, Massachusetts Institute of
Technology, NIESR, Oxford, Sheffield, RES, Towers Watson, and UBC Finance for helpful comments. The
views expressed do not represent the views of the Financial Conduct Authority. This work was supported
by the ESRC.
E-mail: brian.bell@kcl.ac.uk (Bell); smn.pedemonte@gmail.com (Pedemonte); vanreene@mit.edu (Van
Reenen)

Journal of the European Economic Association 2021 19(5):2513–2542 DOI: 10.1093/jeea/jvab005
c The Author(s) 2021. Published by Oxford University Press on behalf of European Economic Association.
This is an Open Access article distributed under the terms of the Creative Commons Attribution
License (http://creativecommons.org/licenses/by/4.0/), which permits unrestricted reuse, distribution, and
reproduction in any medium, provided the original work is properly cited.
2514 Journal of the European Economic Association
1. Introduction
CEO pay is rarely out of the news. The remuneration of CEOs and other senior
executives has risen much faster than that of ordinary workers. For S&P500 firms,
average CEO pay was 31 times as high as that of the average production worker in
1970 compared to 361 times as large in 2017.1 Although pay levels are lower in the
United Kingdom, the trends are similar. In our data, CEO pay was about 110% larger
in real terms in 2015 than 1999 compared to a 10% rise for the median worker.
Downloaded from https://academic.oup.com/jeea/article/19/5/2513/6128672 by guest on 18 November 2021
CEO pay could have risen purely because of competitive forces such as a
stronger market for superstars caused by globalization and technological change (e.g.,
Edmans and Gabaix 2016; Gabaix and Landier 2008; Rosen 1981). However, other
commentators have attributed some of the relative increase in CEO pay to the exercise
of managerial rent extraction (e.g., Bebchuk and Fried 2004; Djankov et al. 2008).
In this paper, we use UK publicly listed firms as a case study because since the
late 1990s, there has been a major shift towards rewarding CEOs based on relative
performance.2 A typical plan is to grant executives equity conditional on improving
shareholder returns relative to a peer group of large firms in the same sector (e.g.,
being among the top quartile of performers over a three-year period). These relative
performance contracts contrast to more standard US-style stock option contracts that
are based on general improvements in equity prices. Almost no equity awards are now
made to UK CEOs who do not have a performance condition attached to them.3
Many papers have documented a link between CEO pay and firm performance.4
Although usually interpreted through the lens of contract theory, it has long surprised
economists that such relative long-term incentive plans (LTIPs) are not more common
(Holmstrom, 1979,1982).5 Relative performance plans are designed to reduce the
problem that CEO remuneration can increase merely because of positive shocks to
the firm unrelated to executive effort or ability. Figure 1 shows that at the start of
our sample around 18% of total pay was in the form of LTIPs, rising to almost 30%
by the end of the sample. Of these awards, the share that used a sector comparator
1. Conyon et al. (2011) and https://aflcio.org/paywatch
2. The move to relative performance plans arose from the recommendations of several high profile 1990s
Commissions such as the 1995 Greenbury Report. http://en.wikipedia.org/wiki/Greenbury Report. See
also the 1992 Cadbury Report and 1998 Hampel Report.
3. For the sample as a whole, we have 8,695 equity awards. Of these, 94% have a performance condition
attached.
4. Our paper is in the CEO pay–performance tradition (Baker, 1939; Jensen and Murphy, 1990). Surveys
by Frydman and Jenter (2010) and Bertrand (2009) conclude that there is a positive, statistically significant
relationship between CEO pay and shareholder returns (and accounting measures of performance such as
profitability and sales growth). This link exists for most time periods and across most countries, and there
appears to have been an increase in the sensitivity of pay to performance over time as CEO compensation
has tilted towards a more incentive-based structure (see Hall and Liebman, 1998). The interpretation of
this empirical pay–performance link is more controversial.
5. Using indirect methods relating relative firm to industry performance, Gibbons and Murphy (1990)
find some evidence for their use in large US firms in the 1970s and 1980s, but Aggarwal and Samwick
(1999) find little evidence for them in the 1990s.Bell, Pedemonte & Van Reenen CEO Pay and Relative Performance Contracts 2515
Downloaded from https://academic.oup.com/jeea/article/19/5/2513/6128672 by guest on 18 November 2021
F IGURE 1. Share of CEO pay in LTIPs and share of all LTIPs that have a sector component. LTIP
share is the estimated proportion of new pay in the form of LTIPs, all of which are performance
conditional. Sector LTIPs show the percentage that have a sector component in the performance
evaluation (i.e., are benchmarked against an industry peer average), while general LTIPs are those
with a non-sector comparator. Source: Authors’ calculations based on Boardex data.
rose from a quarter to two-fifths, with the remainder using a general comparator (e.g.,
the FTSE-100 companies). A number of US corporations have also been moving
towards these plans, but at a slower rate. De Angelis and Grinstein (2016) report that
although the trend is upwards, by 2007 only 30% of S&P500 firms used some form
of relative performance evaluation in at least part of their CEO pay package. Gong
et al. (2011) estimate the figure to be 25% for the wider group of S&P1500 firms.
Bettis et al. (2018) use more recent data to show that the use of performance-vesting
equity awards to top executives in large US companies has continued to rise, though
by the end of their sample in 2012, they were still less common than standard
time-vesting awards. The experience of UK firms can shed light on the efficacy of
such plans as their spread occurred much earlier than in the United States.
We use original data on explicit CEO contracts covering just under 500 publicly
listed firms accounting for almost 90% of UK stock market value between 1999
and 2015. Our paper focuses on the interaction between LTIPs and institutional
ownership. Due to their scale of ownership across multiple firms and large block
holdings in individual firms, institutional investors are often regarded as one of the
few shareholders to have both the ability and incentive to monitor CEOs in large
corporations. Institutional owners take a keen interest in the level and structure of
CEO pay. In the United Kingdom, they typically use two major advisors: Institutional
Voting Information Service (IVIS) and the Institutional Shareholder Services (ISS).
IVIS and ISS help institutions monitor corporate governance on a wide range of issues
and advise on voting at Annual General Meetings.6 In the United Kingdom, there
is “Say on Pay” legislation, where a vote has to be taken every year over CEO pay,
6. As the survey by Thomas and Van der Elst (2015) emphasised, “These advisors’ recommendations
for, or against, a company’s pay plan may also carry significant weight with their institutional clients and
can dramatically impact the outcome of a vote.”2516 Journal of the European Economic Association
and industry analysts and the media closely watch these votes.7 It is not just voting
down a pay agreement: The threat of a negative vote helps discipline the remuneration
committee. As one survey notes, “institutional investors use the threat of a negative
vote to enforce compliance” (Sheehan, 2012).
We therefore begin by documenting that corporate governance appears to be
stronger when institutional ownership is higher in our data. We then turn to our
results on CEO pay. First, we show that there is a strong relationship between CEO
pay and performance, but that it is asymmetric—pay responds more to increases in firm
Downloaded from https://academic.oup.com/jeea/article/19/5/2513/6128672 by guest on 18 November 2021
performance than to decreases.8 Furthermore, this asymmetry occurs only when there
is weak external control as proxied by lower institutional ownership. Second, there is
substantial “pay for luck” with CEO pay increasing when the industry experiences a
random positive shock even when the CEO is subject to relative sector LTIPs. We then
turn to explanations. We find that CEOs in firms with low institutional ownership who
fail to meet the terms of their existing LTIPs are able to obtain deals that are more gen-
erous on their future LTIPs. We show that these future LTIPs are not just more generous
in the quantum of the value of shares they promise, but they are also re-designed to the
benefit of the CEO, by making trigger points more generous and including multiple
performance criteria that make them more likely to at least partially vest.
One efficiency-based explanation for these findings is that more generous awards
are needed after LTIP failure in order to retain the CEO in the weakly governed firms.
We show that CEO exit is indeed more likely following LTIP failure, but this effect
is no different for firms with low versus high degrees of institutional ownership. An
alternative and more plausible explanation for our findings is that CEO remuneration
plans in large corporations are sufficiently complex that individual shareholders have
difficulty effectively monitoring the contracts. Governance matters more than formal
contract structure.
This paper is structured as follows. Section 2 discusses data, Section 3
discusses the relationship between corporate governance and institutional ownership,
Section 4 reports our main results, Section 5 provides some extensions and robustness
tests, while our conclusions are in Section 6.
2. Data
Our main data on pay come from Boardex, which provides annual data from the
Remuneration report of all listed UK companies. This database is essentially the
7. For examples on analysts, see KPMG (https://assets.kpmg/content/dam/kpmg/uk/pdf/2018/09/
review-of-the-2018-agm-season.pdf) and Deloitte (https://www2.deloitte.com/content/dam/Deloitte/uk/
Documents/tax/deloitte-uk-2015-agm-season.pdf). On media, see, for example, https://www.ft.com/
content/e372d9f0-8b6e-11e8-b18d-0181731a0340; https://www.constructionnews.co.uk/contractors/kier/
kiers-cfo-pay-deal-source-investor-opposition-18-11-2019/; https://www.theguardian.com/business/2016/
apr/14/bp-pledge-shareholder-anger-ceo-bob-dudleypay-deal; https://www.manifest.co.uk/shareholders-
vote-pearsons-remuneration-report/.
8. Garvey and Milbourne (2006) find some evidence of this in US data. Daniel et al (2016) claim to find
no asymmetry when they use a wider definition of pay that includes all sources of shareholder wealth.Bell, Pedemonte & Van Reenen CEO Pay and Relative Performance Contracts 2517
Downloaded from https://academic.oup.com/jeea/article/19/5/2513/6128672 by guest on 18 November 2021
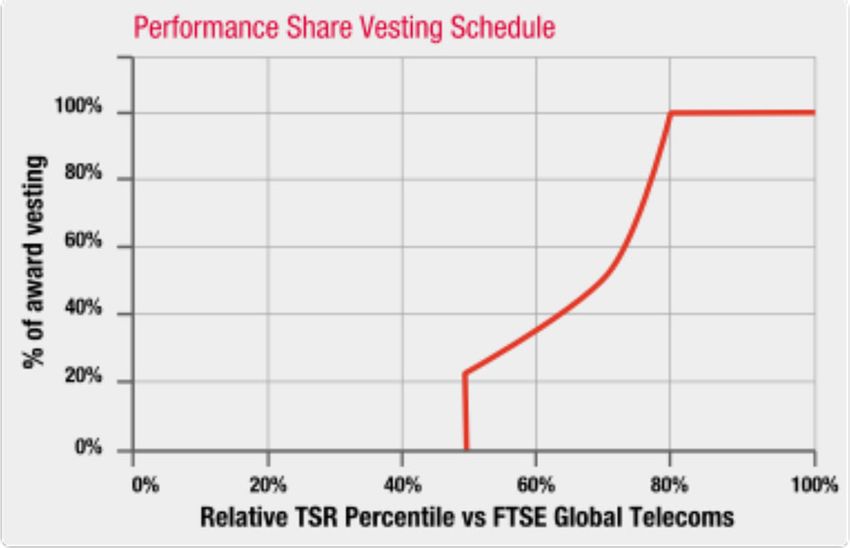
F IGURE 2. Vodafone LTIP vesting schedule. Taken from Vodafone’s 2005 accounts relating to a
2004 LTIP award. The figure indicates the proportion of shares (2 million) that will be granted to
CEO depending on the performance of total shareholder return relative to basket of 28 “peer” telecom
companies in the 28th July 2004 to 28th July 2007 period.
UK equivalent of the US ExecuComp database. The data cover all Board executives
within the firm and report base salary, cash and share bonuses, and details of all equity
awards—regular stock options and LTIP awards. We supplemented these data by hand-
collecting from the Annual Reports more details on each equity award (e.g., grant date,
performance condition, performance comparator type), and we also track each award
through to the vesting date to determine the outcome of the award. From these sources,
we define two alternative measures of pay (further details in Online Appendix A):
1. Cash pay D salary C bonus (cash bonus C face value of unconditional deferred
bonus shares)
2. New pay D cash pay C expected value on grant date of new equity awards
(regular stock options and LTIPs)
To give an idea of a typical LTIP award and how we value it ex ante, consider the
sector LTIP award made to the Vodafone CEO, Arun Sarin, on 28th July 2004 (see
Figure 2). The CEO was awarded 2,016,806 shares in an LTIP share plan, with a face
value of £2.4 million (share price of £1.19 on the grant date). The 2005 annual report
(which recorded the 2004 award) provides details of the vesting schedule and the set of
firms that made up the comparison group (29 firms in the FTSE Global Telecom index).
If the total shareholder return (TSR) of Vodafone over the subsequent three years was
below the median of the comparison group, no shares would vest. TSR performance
in the top quintile of relative performance would result in full vesting, and a sliding
(though not linear) scale operates between the median and 80th percentile. In the event,
on 28th July 2007, 576,806 shares were vested and 1,440,000 were forfeit (i.e., 28.6%
of the award vested) as TSR performance was in the 53rd percentile. To value the award
on grant date, we take the face value of the award and adjust downwards for two effects.
First, we use the history of all LTIP plans of the same broad type to determine the2518 Journal of the European Economic Association
average vesting percentage—this gives us an approximate estimate of what probability
the CEO should assign to actually obtaining the shares on vesting date. Second, we
adjust for the probability that the CEO will leave the firm during the performance
evaluation period and thus lose the shares (or at best have them pro-rated). Online
Appendix A discusses this in more detail, gives more examples of LTIPs, and reports on
various robustness tests. For regular stock options that have no performance conditions
(which are rare in our data), we value using a standard Black–Scholes formula.
There are, of course, alternative approaches to valuing such awards. Bettis et al.
Downloaded from https://academic.oup.com/jeea/article/19/5/2513/6128672 by guest on 18 November 2021
(2014) provide an excellent and detailed discussion of LTIPs using very granular US
data. They simulate the ex-ante value of LTIPs using the full details of the award (e.g.,
peer group composition, vesting schedule, etc.) and show that for most awards, the
simpler “fair value”9 reported by US firms is close to their more sophisticated methods.
However, they point out that there are some significant differences in the tails of the
valued awards. Unfortunately, our data do not consistently provide the sufficient level
of detail required for such computations across all the firms. Indeed, in the United King-
dom prior to the 2008 Large and Medium-Sized Companies and Groups Regulations,
there was no formal requirement on firms to provide the level of detail needed to do
such simulations, though firms could voluntarily do so. For example, National Express
plc operated a TSR LTIP and simply reported that they used a “bespoke comparator
group”, whilst William Hill plc stated that TSR would be measured against a “selected
comparator group of 16 other gaming and leisure sector companies”. In Section 4.4,
we use some more details of the plans for a sub-sample to consider whether our results
could be biased due to not taking into account all aspects of the LTIP awards.
Carter et al. (2009) provide evidence on UK LTIPs for a single year, 2002, and
conclude that there is “little evidence that differences in performance conditions
are associated with differences in actual plan vesting percentages”. In other words,
knowing more about the structure of the contract did not significantly help in
predicting the final vesting percentage. This suggests that our approach can provide a
reasonable approximation to valuation in the absence of more detailed individual plan
data. Carter et al. (2009) also argue that “research that fails to consider more realistic
vesting rates will severely overstate the value of performance-vested equity grants”,
which emphasizes the importance of using actual vesting rates to adjust valuation as
our method does. We have experimented with alternative assumptions about vesting
probabilities such as using rolling or recursive historical outcomes or industry-specific
outcomes, but this does not substantively change any of our results. Finally, it should
be noted that unlike in the United States, UK firms are only required to report the face
value of LTIPs on grant date, assuming 100% vesting.
Our main sample comprises the 300 largest publicly listed UK-domiciled firms in
each year from 1999 to 2015, representing on average 94% of the market capitalization
of the UK stock market. We keep firms in the sample regardless of whether they
9. The fair value reporting required by US accounting rules stipulates that firms must adjust the face
value of the LTIP to account for the performance condition attached. However, firms do not have to conduct
the sophisticated analysis presented by Bettis et al. (2014) but can instead use basic information such as
relative price volatilities to estimate fair value.Bell, Pedemonte & Van Reenen CEO Pay and Relative Performance Contracts 2519
TABLE 1. Summary statistics.
Mean Median S.D. 25th percentile 75th percentile
Panel A: CEO and pay data
Total compensation (“new pay”) 1,638 1,039 2,866 610 1,850
Salary 539 482 285 350 671
Bonus 501 262 817 68 590
New equity 598 215 2,528 0 567
LTIP share (%) 22.6 21.9 20.8 0 35.2
Downloaded from https://academic.oup.com/jeea/article/19/5/2513/6128672 by guest on 18 November 2021
Sector share of LTIPs (%) 35.2 0.0 45.9 0.0 100
Completed tenure (years) 9.3 7.0 7.6 4.4 11.7
Annual exit 0.11 0 0.32 0 0
Panel B: company data
Market capitalization (£ million) 4,298 791 12,906 320 2,522
Total employment 19,253 4,900 47,553 1,057 15,954
Shareholder returns (%) 10.1 13.5 35.5 9.7 33.0
Institutional ownership (%) 57.4 61.5 24.0 41.6 76.1
IVIS red top 0.07 0 0.26 0 0
IVIS score (0/1/2) 0.39 0 0.62 0 1
Notes: All pay data figures in panel (A) are in real (2014) £1,000s. Data in panel (A) are for 1,201 CEOs and data
in panel (B) are for 472 firms and cover the period 1999–2015. New equity is the expected value on grant date of
new equity awards (see text for discussion). Total compensation is “new pay” (the sum of salary, bonus, and new
equity).
remain in the top 300 firms, so there is no attrition of firms other than those that
cease to exist. This gives a total sample of 498 firms across the period as a whole,
which we then match to the Boardex database to obtain 472 firms with CEO pay
data. This covers 85% of total market capitalization and 1,201 CEOs.10 For all these
firms, we also have annual company account data and stock price data merged in from
Thompson Datastream. From these worldwide-consolidated activities of the firm,
we construct standard measures of firm performance such as shareholders’ return,
profitability and revenues per worker. Table 1 reports some summary statistics for
CEO pay and company-level data. The average CEO total compensation (“new pay”)
over the sample period was £1.64 million (about $2.6 million). This average masks a
strong trend over the period with average pay rising from £0.9 million to £1.9 million.
For the median CEO, base salary accounts for almost half of remuneration, with
bonuses and new equity accounting broadly equally for the other half.
3. Institutional Ownership and Corporate Governance
Since many of our key findings relate to interactions between CEO pay, LTIP
outcomes, and institutional ownership, we begin this section with a discussion of why
10. We fully match every firm to a Boardex identifier. The 26 firms without pay data are generally those
that were delisted at some point in 2001 or 2002 and appear not to have had their remuneration reports
entered or archived by Boardex—see Online Appendix A for more details.2520 Journal of the European Economic Association
institutional ownership is likely to be important for corporate governance. We first
review the literature on this link and then present new evidence for our dataset on the
connection between institutional ownership and corporate governance.
3.1. Institutional Ownership and Corporate Governance: Existing Literature
Numerous studies have examined the relationship between institutional ownership
Downloaded from https://academic.oup.com/jeea/article/19/5/2513/6128672 by guest on 18 November 2021
and a variety of measures of corporate governance. Aghion et al. (2013) argue that
institutional ownership is associated with better governance (as measured e.g., by
Gompers et al. 2003, IRRC index), because activist institutions such as pension funds
(e.g., CALPERS) typically have the ability and incentive to monitor CEOs more than
dispersed owners. Their stronger incentives come from the fact they are often large
block holders in individual companies, so they overcome the free rider problem with
dispersed ownership. The stronger ability comes from their large scale that enables
them to pay the fixed costs of monitoring large amounts of information.
Gillan and Starks (2000) examine 2,042 US corporate governance proposals
at Annual General Meetings between 1987 and 1994. They found that proposals
sponsored by institutions (as opposed to individuals) focused on problems arising
from potential conflicts of interest between management and shareholders, such
as pushing for increased board independence, implying that institutional owners
were trying to explicitly tackle CEO agency problems. Furthermore, such proposals
were also more likely to be adopted when proposed by institutional owners (even
after controlling for the share of votes held by institutional owners). McCahery
et al. (2016) surveyed 143 large institutional investors. They found that institutional
investors engaged more often than other shareholders over concerns about a firm’s
corporate governance rather than about short-term issues such as equity issuance or
dividend payments. Inadequate corporate governance and excessive compensation are
considered “somewhat” or “very important” triggers for action by 88% of institutional
respondents. Interestingly, they also show that UK institutional investors are more
active than those in other countries, which is where our study focuses.
Some recent studies in this literature have tried to identify a causal link between
institutional ownership and corporate governance. Crane et al. (2016) exploit new
entries to the Russell index of the largest 2,000 listed US firms (the “Russell
2000”) to explore plausibly exogenous changes in institutional ownership. Using the
discontinuity around the market value threshold determining rank 2,000, they show
that firms just to the right of the threshold not only have significantly more institutional
ownership but also have two more shareholder-initiated proposals in a given year
compared to the control firms. This overall difference is driven by an increase in the
number of governance-related shareholder proposals. (There is no difference in the
number of management proposals.) Using a similar identification strategy, Appel et al.
(2016) show that an exogenous one standard deviation (S.D.) increase in institutional
ownership is associated with (i) a 0.7 S.D. increase in the share of directors on a
firm’s board who are independent; (ii) a 0.75 S.D. decline in support for managementBell, Pedemonte & Van Reenen CEO Pay and Relative Performance Contracts 2521
proposals; and (iii) a 0.5 S.D. increase in support for improved governance
proposals.
The impact of corporate governance and institutional ownership on remuneration
has also been explored. Numerous studies have argued that pay in the boardroom is
related to measures of corporate governance such as the proportion of independent
directors or the existence of an independent remuneration committee. For example,
Core et al. (1999) find that the proportion of non-executives on the Board is associated
with lower levels of CEO pay, whilst Ryan and Wiggins (2004) demonstrate that it is
Downloaded from https://academic.oup.com/jeea/article/19/5/2513/6128672 by guest on 18 November 2021
also associated with a stronger pay–performance link. Hartzell and Starks (2003) show
that institutional ownership concentration is positively related to the pay–performance
elasticity and negatively related to the level of pay. Bertrand and Mullainathan (2001)
find that their “pay for luck” effect is substantially attenuated when there is stronger
external control—as measured by the number of large shareholders of the firm. This
result has also been found in Garvey and Milbourn (2006).
3.2. Institutional Ownership and Corporate Governance: New Evidence
The existing literature does suggest an important role for institutional ownership, but
it is almost exclusively based on US firms. Consequently, we turn to our own data on
institutional ownership from Thomson Reuters Global Ownership files for more direct
UK evidence. The data we use relate to December of each year from 1997 onwards and
record the percentage of outstanding shares owned by all those with a shareholding
larger than 0.015%. We calculate for each year the percentage of outstanding shares
held by institutional investors. Across the sample as a whole, Table 1 shows that
institutional investors account for 57% of share ownership—roughly the same as
observed for the United States in the 2000s (Aghion et al., 2013). There is, however,
significant variation across companies. Our measure of corporate governance uses
data from IVIS over the period 1998–2014. IVIS provides a detailed analysis of
UK-listed companies in relation to the level of compliance with corporate governance
“best practice” (see Selvaggi and Upton, 2008, for more details11 ). Its main purpose
is to assist subscribers with their voting decisions at the annual general meeting (e.g.,
approving the accounts, dividends, elections, and remuneration of directors). IVIS
draws up a list of key issues for investors to consider and highlights their seriousness
using a colour-coded system. A “red top” is used to indicate the strongest concern
that a proposal does not comply with best practice, an “amber top” indicates concern,
and a “blue top” indicates no area of major concern.
Figure 3 presents descriptive evidence plotting the fraction of firms with a red top
in decile bins of institutional ownership in the previous year. There is a clear downward
sloping relationship indicating that firms with a smaller fraction of institutional
owners have a much greater fraction of serious warnings of corporate governance
11. The authors also use a subset of these data to examine the link between corporate governance and
shareholder returns (in the spirit of Gompers et al., 2003). They find that the shares of the well-governed
firms have higher shareholder returns.2522 Journal of the European Economic Association
Downloaded from https://academic.oup.com/jeea/article/19/5/2513/6128672 by guest on 18 November 2021
F IGURE 3. Weak corporate governance more prevalent in firms with lower instiutional ownership.
The figure is a binscatter of the fraction of firms with a “red top” (signalling corporate governance
problems by IVIS) in ten deciles of (lagged) institutional ownership (defined as the fraction of shares
owned by institutional owners in the previous year). We control for year dummies.
concerns. The relationship looks rather non-linear: Firms in the lowest two deciles
seem to have particularly bad problems (about 15% are red-top warnings), whereas
those in the top seven deciles seem to have broadly similar patterns of only about 5%
red tops. The top 70% correspond to about half or more of voting equity owned by
institutions.
We explore the link between institutional ownership and the IVIS corporate
governance scores more rigorously in Table 2. The dependent variable is either binary
(D1 for red top and zero otherwise) or ordered (D2 for red top, D1 for amber top,
and zero for blue top). The first four columns of Table 2 present estimates where
the dependent variable is the binary variable, whilst the last four report the ordered
dependent variable. Estimation is by ordinary least-squares (OLS), but marginal
effects are similar using non-linear models. We begin by using the continuous measure
of the one-year lagged institutional ownership percentage (IO) as the key right-hand
side variable. In column (1), this variable has a negative and significant coefficient,
implying that higher levels of institutional ownership are associated with better
corporate governance. The coefficient implies that a ten-percentage point decrease
in institutional ownership is associated with a 1.7 percentage point increase in the
probability of a red-top warning. Since the mean of the dependent variable is 7.4%,
this magnitude is economically non-trivial. Note that all the models in Table 2 contain
time dummies and ln(market capitalization) to control for firm size.12
12. Unsurprisingly, the coefficient on market capitalization is negative and significant, but dropping
it made little difference to the results. For example, in column (1), the coefficient (standard error) on
institutional ownership was –0.166 (0.035) if we drop this measure of firm size.TABLE 2. Institutional ownership and corporate governance.
(1) (2) (3) (4) (5) (6) (7) (8)
Weak corporate governance
Dependent variable: 1 D red top, 0 D amber top or blue top 2 D red top; 1 D amber; 0 D blue top
Institutional 0.172 0.338
Ownership (0.035) (0.068)
Low IO (lowest 0.108 0.034 0.041 0.230 0.092 0.099
quartile, q1) (0.019) (0.019) (0.015) (0.039) (0.044) (0.036)
IO q2 (second 0.029 0.011 0.082 0.011
lowest quartile) (0.010) (0.014) (0.026) (0.033)
IO q3 (third 0.011 0.003 0.038 0.003
lowest quartile) (0.008) (0.011) (0.023) (0.028)
Firm fixed effects? No No Yes Yes No No Yes Yes
Observations 4,827 4,827 4,827 4,827 4,827 4,827 4,827 4,827
Firms 452 452 452 452 452 452 452 452
Notes: All results use Thomson Reuters ownership data and IVIS voting recommendations. Columns (1)–(4) have a binary dependent variable equal to 1 if the firm has a “red
top” IVIS recommendation in that year and zero otherwise. Columns (5)–(8) have a categorical dependent variable, with values of 2 for a “red top”, 1 for an “amber top”, and
zero otherwise. IO is the one-year lagged percentage of shares held by institutional investors, while IO qX are dummies equal to 1 if the firm is in the Xth quartile of institutional
Bell, Pedemonte & Van Reenen CEO Pay and Relative Performance Contracts
ownership in the year. All regressions include time dummies and the log of market capitalization. Standard errors are clustered at the firm level. Significant at 10%; significant
at 5%; significant at 1%.
2523
Downloaded from https://academic.oup.com/jeea/article/19/5/2513/6128672 by guest on 18 November 20212524 Journal of the European Economic Association
Motivated by the evidence of a non-linear relationship in Figure 3,
column (2) of Table 2 splits up the institutional ownership variable into quartile
dummies across firms evaluated separately for each year (with the top quartile as
the omitted base). All the coefficients are positive in these specifications, implying
that corporate governance concerns are stronger outside the firms in the top quartile
of institutional ownership. It is clear, however, that the lowest quartile group has a
substantially greater likelihood of having corporate governance concerns than the other
groups, with the third quartile effect being insignificant and the second quartile effect
Downloaded from https://academic.oup.com/jeea/article/19/5/2513/6128672 by guest on 18 November 2021
being at most a quarter the size of the lowest quartile.13 In column (3), we repeat the
specification of column (2) but include a complete set of firm fixed effects. In this model,
only the lowest quartile of institutional ownership is significant. (The other two quartile
dummies are jointly insignificant with a p-value of the joint test of 0.71.) Therefore,
column (4) presents our preferred model, which just has the lowest quartile dummy. The
next four columns repeat these specifications but use the three-valued ordered outcome
as the dependent variable. The results are very similar. If anything, they are slightly
stronger (as might be expected) now that we are using a more finely tuned measure
of corporate governance.14 We also experimented with including the concentration
of institutional ownership, measuring the share of ownership accounted for by the
largest five institutional owners. This concentration measure is lower for the lowest
quartile of institutional ownership (48% vs. 57%) than for the other three quartiles.
When included in the models of Table 2, the coefficient on this measure was generally
positive, consistent with the idea that more concentrated ownership reduces corporate
governance problems. However, this ownership concentration measure became
statistically insignificant in the firm fixed-effect specifications, and, importantly, our
key low institutional ownership variable remained significant throughout.
Overall, the evidence in Table 2 points strongly towards a positive link between
institutional ownership and corporate governance, which is driven by the firms in the
lowest quartile of institutional ownership.15
13. As noted in the text, it does not matter that these models are estimated by OLS rather than a non-
linear estimator. For example, the marginal effects on the bottom IO quartile dummy in a probit model of
column (2) is 0.108 (0.019).
14. We also experimented with including firm fixed effects in the models of columns (1) and (5). The
coefficients on institutional ownership remained negative but were insignificant. This is because, as we
have shown in Figure 3 and the other columns of Table 2, institutional ownership seems to matter in
a non-linear way, so columns (1) and (5) are mis-specified. It is having very low levels of institutional
presence which is problematic for corporate governance.
15. In the rest of the paper, we will examine how firms with low institutional ownership behave differently
from other firms. Although we will also look at heterogeneity with respect to the explicit governance
indicators (e.g., Table 2’s IVIS measures), we believe the structure of ownership is a preferable measure
as the governing warnings are an extreme indicator of ongoing problems. For example, there may only be
one explicit warning over several years, even though corporate governance problems have been persisting
for many years.Bell, Pedemonte & Van Reenen CEO Pay and Relative Performance Contracts 2525
4. Main Results
Given the substantial changes to the structure of CEO pay in the United Kingdom
over the sample period, do the stylized facts from (the mainly US studies) carry over
across the Atlantic? First, we look at asymmetric responses in the pay–performance
relationship, and then in Section 4.2, we look at the evidence of “pay for luck”.
4.1. Asymmetrical Response of Pay to Performance
Downloaded from https://academic.oup.com/jeea/article/19/5/2513/6128672 by guest on 18 November 2021
The idea behind the examination of asymmetry is whether CEO pay increases with
positive firm performance but decreases by far less when performance declines.
Furthermore, we are interested in whether this asymmetry is particularly strong when
corporate governance is weak. Our basic estimation equations are of the form
ln.pay/ijt D ˛ij C ˇPERF jt C t C "ijt ; (1)
where ln(pay)ijt is the total remuneration (what we label “new pay” in Section 2)
of CEO i in firm j at time t, ˛ ij is a CEO-firm match-specific fixed effect (hence
absorbing both the time-invariant CEO and firm effect), t are time dummies, "ijt
is an error term, and PERF is the measure of firm performance—a total shareholder
return index (TSR) as a measure of firm value. Our baseline specification is simply
the contemporaneous effect, but all our results are robust to alternative dynamic
forms using lags. Standard errors are clustered at the firm level except when we use
industry-level instrumental variables, where we cluster at the industry level.
First, we examine whether the estimated pay–performance link differs depending
on institutional ownership. Column (1) of Table 3 presents the basic CEO pay–
performance regression where we include a full set of firm-by-CEO match effects. It
shows a statistically strong and positive link between pay and performance, indicating
that a 10% increase in TSR is associated with a 1.6% increase in CEO pay.16 In column
(2), we switch to a first-difference specification since we will subsequently want to
examine asymmetries in the pay–performance relationship depending on whether
returns are positive or negative and this is more naturally specified in first-differences.
The coefficient of 0.16 in the first-difference specification is very close to that in the
previous column.
Column (3) of Table 3 allows for an interaction between returns and whether the
firm has high or low institutional ownership.17 We split the sample into quartiles based
on average institutional ownership as in Section 3 and focus on the difference between
the lowest quartile of ownership (less than 42% on average) and the other three
16. Allowing for an additional two lags in TSR results in a long-run estimate of the pay-performance
link of 0.191 (0.024).
17. All regressions with institutional ownership effects also include a full set of interactions between the
ownership dummies and the time dummies. The measure of institutional ownership is always lagged one
period.2526 Journal of the European Economic Association
TABLE 3. Asymmetries in the CEO pay–performance relationship and institutional ownership.
(1) (2) (3) (4) (5)
Dependent variable D ln(new pay)
Method: Within groups First differences First differences First differences First differences
lnTSR 0.158
(0.021)
lnTSR 0.163 0.115
Downloaded from https://academic.oup.com/jeea/article/19/5/2513/6128672 by guest on 18 November 2021
(0.028) (0.048)
lnTSR 0.230 0.252
High IO (0.026) (0.035)
lnTSR 0.025 0.129
Low IO (0.057) (0.091)
lnTSR(C) 0.118
(0.077)
lnTSR(C) 0.052
High IO (0.069)
lnTSR(C) 0.414
Low IO (0.142)
Observations 5,041 5,041 5,041 5,041 5,041
Firms 449 449 449 449 449
Notes: All results use Boardex data. Column (1) is a fixed-effect model with the ln(new pay) as the dependent
variable. The subsequent columns report first-difference models on the same data. Low IO firms are those with
one-year lagged institutional investor share ownership in the bottom quartile of the distribution (and High IO
are all others). Column (1) includes CEO–firm match fixed effects. All regressions include time dummies and
time dummies interacted with the High IO dummy in columns (3) and (5). TSR is total shareholder return and
lnTSR(C) denotes the change in TSR is positive. Standard errors are clustered at the firm level. Significant at
10%; significant at 5%; significant at 1%.
quartiles.18 The results presented in Section 3.2 suggest that this is the key contrast
from a corporate governance perspective. The link between pay and performance
is much larger (and significant) for the high institutional ownership firms (0.230)
than the low institutional ownership firms (0.025). In the next column, we allow
different pay–performance elasticities between positive and negative shareholder
returns, by including an interaction between returns and an indicator equal to 1 if the
growth was positive (lnTSR(C)) and zero otherwise. Column (4) shows that there
appears to be an economically substantial propensity to reward positive returns more
favourably than negative returns are penalized looking at all firms together, but this is
not significant at conventional levels.
18. Nothing hinges on using quartiles or combining the highest three quartiles into one category. Results
available on request show that the remaining three quartiles have very similar estimated coefficients and one
cannot reject equality. Table A.3 shows that there is little evidence of economically substantial differences
between the low and high institutional ownership groups across observables such as sales, employment,
market capitalisation or executive pay levels or growth rates.Bell, Pedemonte & Van Reenen CEO Pay and Relative Performance Contracts 2527
Such asymmetries could indicate inefficiencies, but they may also occur
as the outcome of an optimal contract for risk-averse CEOs. For example,
Gopalan et al. (2010) discuss a model where the optimal contract ties CEO pay to
performance to induce effort, but if CEOs are sufficiently risk-averse, they are not
punished by pay cuts for negative shocks.19 To shed light on this, we therefore focus
on whether this asymmetry is a function of corporate governance. Column (5) of
Table 3 generalizes the column (4) specification to allow the asymmetry of pay and
performance to depend on our measures of institutional ownership. We find evidence
Downloaded from https://academic.oup.com/jeea/article/19/5/2513/6128672 by guest on 18 November 2021
that there is a significant asymmetry only for the more “weakly governed” firms but
not the strongly governed firms. Firms with weak governance reward positive returns
with a significantly higher pay (an elasticity of 0.285 D 0.414 – 0.129) but require
no pay penalty for negative returns (an insignificant 0.129). In other words, for
such firms, the coefficients imply that a 10% increase in TSR is associated with a 3%
higher pay, whereas a 10% decrease has no significant penalty (if anything, a 1.3%
gain). By contrast, the firms with higher institutional ownership appear to reward
performance symmetrically. (As the coefficient of 0.052 on the interaction between
positive returns and high institutional ownership is insignificant.)
Figure 4 uses the coefficients from column (5) of Table 3 to illustrate this
asymmetry for the high and low institutional investor categories separately. There
appears to be a clear symmetry for panel (a) (high institutional ownership) compared
to panel (b) (low institutional ownership).
All these results relate to new pay (i.e., salary plus bonus plus expected value of
new equity awards). The asymmetry result is driven by the new equity awards since
regressions that use cash pay (i.e., salary plus bonus) as the dependent variable do not
show this asymmetry.20 This is important since our results shown later will also point
to the use of new awards to circumvent the impact of relative performance contracts.
To check that these results are driven by governance and not some other correlated
effect (like firm size), we repeated the analysis of Table 3 looking at interactions with
other observables. For example, we constructed dummy variables based on whether
the firm is in the lowest quartile or below median based on market capitalization, total
employment, shareholder returns, and lagged levels of CEO pay. In no case do we
observe significant evidence of asymmetry in pay with respect to performance on any
of these alternative categorizations.21
19. Formally, this is driven by the sector-specific component of performance (the pay-for-luck issue we
discuss later). The idea is that when CEOs have private information on which industries may be more
profitable for the firm to focus on, shareholders may want them to be rewarded for positive shocks in those
sectors to induce the right strategic choice.
20. Although they do still show a stronger link between pay and performance for higher institutional
ownership firms.
21. We have also experimented with directly using the IVIS governance scores rather than institutional
ownership. If we re-ran the specification in column (5) of Table 3, with firms split into either high or low
governance based on their median IVIS score, we again cannot reject symmetry for well-governed firms
(a coefficient of –0.093 with a standard error of 0.067), whereas we do reject it for the poorly governed
firms (a coefficient of 0.249 with a standard error of 0.094).2528 Journal of the European Economic Association
Downloaded from https://academic.oup.com/jeea/article/19/5/2513/6128672 by guest on 18 November 2021
F IGURE 4. Asymmetric pay–performance estimates. Panel (a): firms with strong governance (high
share of institutional owners). Panel (b): firms with weak governance (low share of institutional
owners). These figures represent the implied effect of a percentage change in TSR (shareholder
returns) on the percentage increase in CEO pay. The coefficients are from the specification in column
(5) of Table 3. “Low share of institutional ownership” denotes firms in the bottom quartile of the (one
year lagged) ownership distribution and “High share of institutional ownership” denotes all other
firms. 95% confidence intervals shown.Bell, Pedemonte & Van Reenen CEO Pay and Relative Performance Contracts 2529
Another concern is that our estimates implicitly assume that the executive remains
with the firm and so is in a position to have their pay respond to changes in firm perfor-
mance. It is plausible, however, that poor performance may lead not only to lower wages
but also to an increased probability of a job separation (e.g., Huson et al. 2001; Jenter
and Kanaan 2015). Thus, we may be underestimating the impact of firm performance
on CEO expected returns. In Section 5.1, we will indeed show that CEO exit is more
likely following poor TSR performance. This raises the issue of whether our results are
biased due to this differential CEO attrition, which could be a form of dynamic selection
Downloaded from https://academic.oup.com/jeea/article/19/5/2513/6128672 by guest on 18 November 2021
bias. (The static selection effects are controlled for by the match specific effects.) Could
the asymmetry of the coefficient on shareholder returns be attenuated, as large negative
shocks to shareholder returns are followed by dismissal rather than compensation cuts?
To look at this issue, we performed several tests. First, we re-ran Table 3 excluding
the last year (or alternatively the last two years) of CEO tenure. The asymmetries
we identify in Table 3 continue to hold for these sub-samples (see Online Appendix
Tables A.4 and A.5). Second, we allowed for an asymmetry in the CEO job-exit
probability with respect to shareholder returns. However, unlike CEO pay, we found
no significant difference between the impacts of positive or negative returns on job
exits. Third, we allowed for both the level effect of shareholder return on CEO exit
and its asymmetry with positive and negative TSR realizations to vary with our
institutional ownership measures. Again, we could find no significant differences of
these on job exit. We return to the issue of CEO exit in more detail in Section 5,
but our initial conclusion here is that it seems unlikely that the findings on the CEO
pay–performance relationships we describe are purely due to dynamic selection bias.
4.2. CEO Pay for Luck
Another way to investigate the issue of whether the pay–performance relationship
is all due to market incentives is to consider the extent to which CEOs are rewarded
for luck. Consider the pay of oil company CEOs. Their pay is related to their firm’s
shareholder returns, but this, in turn, is strongly correlated with the price of oil. Since
the oil price is easily observed and outside the control of the CEO, the standard
Holmstrom and Milgrom (1987) result would argue that the firm should ensure no
link between pay and oil price. However, in practice, the link is strong, suggesting
that CEOs are being partly rewarded for luck. Bertrand and Mullainathan (2001)
show that US CEOs receive the same payoff to a “lucky dollar” of shareholder returns
as they do to a general dollar of shareholder returns. Formally, this is illustrated by
showing that the OLS estimate of the pay–performance elasticity is the same as the
instrumental variable (IV) estimate using industry performance to instrument for firm
performance.22 Since the CEO cannot control industry performance, we can interpret
the IV estimate as identifying those returns that are common to the industry, that is,
22. Many other instruments have been suggested in the literature. Blanchflower et al. (1996) focus on
using lag structures, but potential external instruments have included firm-specific technological innovation
(Kline et al., 2019; Van Reenen, 1996), import/export price shocks (Abowd and Lemieux, 1993; Bertrand,2530 Journal of the European Economic Association
luck.23 There is substantial debate in the literature on whether pay for luck may be
consistent with optimal contracting rather than rent skimming, as argued by Bertrand
and Mullainathan. For example, Gopalan et al. (2010) suggest that it may be used to
incentivize CEOs to optimally choose the level of sector exposure, whilst Hoffman
and Pfeil (2010) show that if luck shocks are correlated with future investment
opportunities for the firm, then pay for luck may be optimal in a dynamic setting.
We follow this idea by instrumenting shareholder returns with the returns in the
global industry (the Datastream Industrial Sub-Sector Global-ex-UK Index) but drop-
Downloaded from https://academic.oup.com/jeea/article/19/5/2513/6128672 by guest on 18 November 2021
ping the UK firms from this index to avoid a mechanical relationship (i.e., we construct
the leave-out mean). We have 92 such sub-sectors. Column (1) of Table 4 reports the
OLS (in panel A) and IV (in panel B) estimates for ln(new pay)—the same measure of
CEO pay as used in Table 3. The coefficient on lnTSR is significant in both specifica-
tions and we cannot reject that the IV and OLS are equal at the 5% significance level.24
CEO “pay for luck” appears prevalent, just as in Bertrand and Mullainathan (2001).25
The evidence for substantial CEO pay hikes from rises in industry TSR may
appear surprising. The substantial corporate reforms in the United Kingdom in the
late 1990s were supposed to explicitly control for improvements in the firm position
that were due to industry-wide shocks. So, is it simply that the reforms failed in this
objective or is something more complex going on? An obvious starting point is to
focus on those LTIPs with an explicit sector performance hurdle. At a minimum, we
would expect such awards to exhibit much less sector pay for luck. Thus, for all LTIP
awards, we identify those who have at least some part of the award that vests only on
the performance of shareholder returns relative to a sector benchmark. We term these
“sector LTIPs” (and their converse “non-sector” or “general LTIPs”)—these are the
splits shown in Figure 1.26
2004), and oil price shocks (Bertrand and Mullainathan, 2001). Card et al. (2014) instrument the value-
added per worker of each firm (their measure of rents) by the value-added per worker of all firms in the
same four-digit industry outside the region of Italy on which their analysis is conducted. The identifying
assumption is then that industry demand shocks affect firm-level profitability but have no direct effect on
local labour supply.
23. Subsequent work in the United States has examined whether the pay-for-luck effect is asymmetric.
Garvey and Milbourn (2006) show that CEO pay rises when firm performance increases due to good luck
but does not go down to the same extent when firm performance decreases due to bad luck. By contrast,
Daniel et al. (2016) argue that this apparent asymmetry is a result of not controlling for firm size.
24. This equivalence between the OLS and IV estimates is also the case if we use the narrower measure
of pay (cash pay) or the broadest measure (total pay).
25. We have also investigated whether the pay-for-luck effect is larger in less well governed firms. If
we take the estimates in column (1) of Table 4 and instrument returns allowing for a differential effect
between strong and weak governance, we do find that the pay–performance elasticities are much closer
when instrumenting than in the OLS specification. This is consistent with such an interpretation, though
the effect is not statistically significant.
26. Note that relative sector LTIPs account for 40% of all LTIPs by the end of the sample. The remaining
60% are still benchmarked, but against either a general index such as the FTSE 100 or some absolute
performance target.Bell, Pedemonte & Van Reenen CEO Pay and Relative Performance Contracts 2531
TABLE 4. Pay for luck?
(1) (2) (3) (4) (5)
Dependent variable: Change in Vesting Vesting Percentage Percentage
new pay percentage percentage change in change in
sector LTIP non-sector sector LTIP non-sector
LTIP value LTIP value
Mean of dependent
Variable: 0.117 0.544 0.663 0.323 0.548
Downloaded from https://academic.oup.com/jeea/article/19/5/2513/6128672 by guest on 18 November 2021
Panel A: OLS estimates
lnTSR 0.162
(0.027)
P lnTSR 0.227 0.159 1.631 1.412
(0.022) (0.018) (0.096) (0.116)
Panel B: IV estimates
lnTSR 0.173
(0.047)
P lnTSR 0.078 0.168 1.206 1.511
(0.041) (0.039) (0.136) (0.162)
# firms 467 229 362 229 362
# CEOs 1,199 428 696 428 696
Observations 5,243 2,054 3,780 2,054 3,780
First stage F-stat 167 59 36 59 36
Notes: Panel (A) for each column reports results from an OLS regression, while panel (B) reports the results of
an equivalent IV specification with lnTSR instrumented by the ICB Industrial Sub-Sector Global ex-UK index
TSR. Column (1) uses ln(new pay) as the dependent variable and the yearly change in TSR (total shareholder
return) as the explanatory variable. Columns (2) and (3) use the vesting percentage of the relevant LTIP (long-term
incentive plan) as the dependent variable, while columns (4) and (5) use the ex-post percentage change in value
of LTIP as the dependent variable. Sector LTIPs are all performance-related equity plans that have at least some
sector TSR comparison component, while non-sector LTIPs are all other equity plants. P lnTSR is the percentage
change in TSR over the performance period p of the LTIP. All regressions include time dummies. Standard
errors are clustered at the firm level for OLS and at the industry level (92 clusters) for IV. Significant at 10%;
significant at 5%; significant at 1%.
We now conduct the OLS/IV comparison for two outcomes: (i) the percentage
of the LTIP award that ultimately vests; and (ii) the percentage change in value of
the LTIP from grant date to vest date. We are interested in the extent to which these
two outcomes for CEOs successfully condition out the sector pay for luck (i.e., the
OLS coefficient being significantly larger than the IV coefficient). Columns (2)–(5) of
Table 4 reports the results. Columns (2) and (3) show that the percentage of the LTIP
that ultimately vests is strongly correlated with firm returns, as one would expect.
When we instrument firm returns with sector returns, the IV coefficient for sector
LTIPs drops substantially and is no longer significant at the 5% level.27 By contrast,
27. It would be surprising for the estimated IV coefficient to fall to zero even if the sector LTIP perfectly
conditioned out sector luck. There are two key reasons for this. First, our sector instrument is not inYou can also read