CFA Society Perth Curtin University - CFA Institute Research Challenge Hosted by
←
→
Page content transcription
If your browser does not render page correctly, please read the page content below

CFA Institute Research Challenge
             Hosted by
         CFA Society Perth
         Curtin University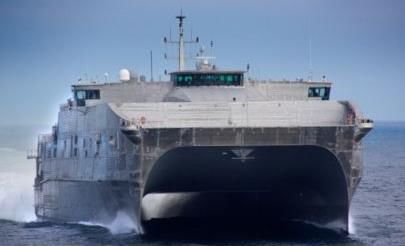
This report is published for educational purposes Curtin University Student Research
only by student competing in the CFA Institute
Research Challenge Industrial Sector, Shipbuilding Industry
Australian Stock Exchange (ASB: ASX)
Austal Shipping Limited
Date: 21-Oct-2016 Closing Price: $1.54 Recommendation: BUY (26.6% total return)
Ticker: ASB AU Headquarters: Henderson, WA Target Price: $1.95
Austal: Becoming Australian’s Global Shipbuilder
Market Profile
We issue a strong BUY recommendation for Austal Limited (ASB) based on a one-year target
Closing Price $1.54 price of $1.95 through analysis using Discounted Cash Flow to Firm and Relative Valuations
52-week methods. This offers a 26.6% upside from the $1.54 closing price on October 21, 2016. Our
$2.56 / $0.94
High / Low recommendation is driven by:
Market Cap $522.6 million
Insider Holdings 9.41% Growth Strategy – Austal has historically relied on order book growth by securing lucrative
Institutional contracts to increase its value. This has been a successful strategy, and has seen ASB become
40.65%
Holdings a player in the large international market of American defence. The latest growth strategy
Dividend Yield 3.81% brings that experience home to Australia, by becoming the preferred contractor of projects
Beta 1.3 for Australian Royal Navy, and capitalising on the high margins of post-construction support
P/E -6.2 works.
EV/Revenue 0.35
EV/EBITDA -5.13 Valuation – A combination of discounted cash flow to firm (DCF) and relative valuation
Target Price $1.95 models were used to establish a one-year target price of $1.95 per share. Perpetuity growth
Source: Bloomberg and terminal EBIT multiples were considered for the DCF. Price to earnings, price to book
and EV/EBITDA multiples were considered in the comparable company analysis. Each of the
five multiples were weighted equally to establish the $1.95 target price
Figure 1: Valuation
Substantial Risks – The primary concern facing Austal is contract risk stemming from the
DCF nature of defence work, which is dependent favourable budget allocation. Uncertainty
$2.04
Perpetuity regarding global economic growth, foreign exchange movements and operating margins are
DCF EBIT also risks to ASB.
$2.30
Exit
A Year in the News:
2017E P/E $1.34
ASB announce new CEO (Apr 4, 2016) – David Singleton has taken the head position at ASB
2017E following Andrew Bellamy’s retirement after 5-years of service as Managing Director and
$2.10
EV/EBITDA CEO.
2016A P/B $1.97 ASB writes back profits from previous years (July 7, 2016) – Upon developments of the
initial stages of the LCS program being less profitable than originally expected, ASB made
Target Price $1.95 the decision to write down AUD $156 million in profit.
$1.0 $1.5 $2.0 $2.5
EPF 11 & 12 contract won (Sep 16, 2016) – ASB USA was awarded an A$434m contract for
Source: Bloomberg, Team Estimates the design and construction of two Expeditionary Fast Transport (EPF) vessels (EPF 11 and
EPF 12). The two additional EPF grow ASB order book to over AUD $3.3B and extend ASB
USA’s contracted production schedule to CY2022.
2.5
ASB acquires Delays in LCS 6, Pressure on Australian Defense White
Philippines shipyard EBIT
Paper commits to Navy
ASB Daily Closing Price (AUD)
2 spending
Military Sealift Command
Hosts Change of
1.5
Command on Austal
HSSV
Slower than expected EBIT
1
growth on LCS program
9-year low after Equity
raising at 50c share Write-down of WIP
0.5
ASB secures $697 million New CEO announced
Contract for LCS 14 & 16
0
10/2011 04/2012 10/2012 04/2013 10/2013 04/2014 10/2014 04/2015 10/2015 04/2016 10/2016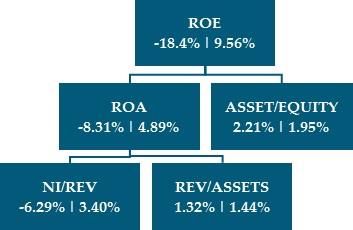
CFA Institute Research Challenge 24 Oct 2016
Figure 2: ASB v ASX200
Business Description
$3.0 7 ASB was founded by current chairman, John Rothwell, in 1987 as a commercial aluminium fishing
ASB Closing Share Price (AUD)
boat builder in Henderson, Western Australia. This saw a period where the company expanded
ASX 200 Closing Value (000's)
$2.5 6
operations into high speed aluminium passenger ferries and cruise ships, before going public in 1998.
5
$2.0 ASB has since diversified into a global defence prime contractor, providing design, construction and
4
$1.5
support capabilities. Construction is undertaken in three yards around the world, with design centred
3 at Henderson, WA.
$1.0
2
$0.5 To gain exposure to the world’s largest defence market, ASB USA was established in 1999. ASB USA
1
is ASB’s largest operation by size and revenue, accounting for 84% of revenue in FY2016. ASB USA is
$0.0 0
home to the Littoral Combat Ship (LCS) and Expeditionary Fast Transport (EPF) ship building and
Oct-11
Oct-12
Oct-13
Oct-14
Oct-15
Oct-16
support projects for the US Navy. This shipyard is the only foreign defence contractor in the world to
ASB ASX 200
sell ships to the US Navy, the worldwide largest defence spender.
Source: Bloomberg In 2012, ASB opened a shipyard in Cebu, Philippines in a labour cost-cutting initiative. This operation
also gave ASB greater exposure to the South-East Asian seas market. Commercial shipbuilding for
Figure 3: Littoral Combat high-speed vehicle-passenger ferries and offshore support vehicles will be mainly now be undertaken
Ship (LCS) in Cebu, which will help create greater capacity in the Henderson shipyard. In 2016, ASB re-entered
the Chinese ferry market by forming a joint venture with Jianglong Shipbuilding to further pursue
Asian opportunities.
Lucrative Contracts
Littoral Combat Ship (LCS) Program – The LCS program is the largest shipbuilding project
undertaken in ASB’s history. The program consists of 52 full service naval combatants for the US
Navy, 11 of which have been awarded to ASB USA for construction. This creates an order book of
approximately US $3.5 billion value through 2021, before the potential benefits of ongoing support
Source: Austal Website contracts.
Figure 4: Expeditionary Fast Expeditionary Fast Transport (EPF) – In November 2008, ASB was awarded as prime contractor to
Transport (EFP) build ten, 103m EFPs with a total contract value of US $1.6bn. Austal has so far delivered seven EPF’s,
with three under construction. An additional two EPF’s have been ordered by the US Navy taking
the buy block to 12 ships valued at US$1.9bn. In early 2014, Austal announced it had been awarded
an AUD $124.9m contract for two High Speed Support Vessels (HSSV) for the Royal Navy of Oman.
Strategy
Form a partnership with the Royal Australian Navy – The highest emphasised goal currently
occupying Austal’s focus. Success in this market will provide growth to the strength of the current
order book and form the building blocks of becoming “The Australian Shipbuilder”.
Source: Austal Website
Capture opportunities in support functions – A strategic goal to capitalise on the constant annuity
that is a product of support contracts. 10% of the value of a ship is spent per annum on service and
support functions, providing a constant and stable source of revenue with higher profit margins.
Figure 5: Shareholder Analysis
Productivity improvement through cost reduction – The goal is to become the world’s lowest cost
producer of ships within the product market. This will be improving on the already competitive
history amongst competitors.
50.67 39.92
% %
Executives
ASB’s executive management team consists of six professionals, led by new CEO, David Singleton
being appointed in April 2016. Singleton brings with him previous experience working in defence
prime contractor businesses, previously working for BAE Systems. (Good move, as Austal continues
to develop into a primarily defence contractor business). The board of directors comprises four
members, with relevant industry experience in defence, engineering and contract work. The board is
chaired by John Rothwell founder.
9.41%
Institutional Insider Other Shareholder Analysis
ASB CEO David Singleton describes the target shareholder as being long-term growth investors, with
Source: Bloomberg
at least a five-year view associated with their investment in the business. At 19.57%, the majority
owner of ASB equity is Allan Gray Australia, an investment fund focused on contrarian asset
opportunities. Allan Gray’s investment fund is focused on long term return appreciation, but has
2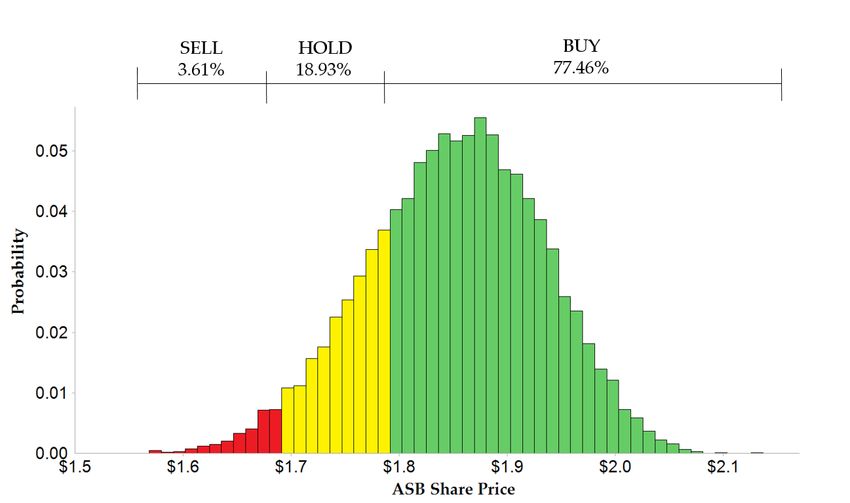
CFA Institute Research Challenge 24 Oct 2016
recently shown the propensity to buy and sell with ASB price fluctuations. The second highest
shareholder is ASB founder and chairman John Rothwell, at 9.33%.
Industry Overview and Competitive Positioning
Figure 6: Past 5-year AUS v US The Global Military Shipbuilding Industry
Military Expenditure The past five years have resulted in stunted growth in the Global Military Shipbuilding industry,
directly affected by declining defence spending in the US and Europe. The global economic slowdown
750 33
meant governments attempted to deal with widening budget deficits by cutting defence spending.
Shipbuilding's long lead times and the industry's importance to national defence meant that industry
AUS Military Expenditure - US$B
US Military Expenditure - US$B
31
700 projects were less impacted by defence cuts.
29
650
27 Increases in the US defence budget, growth in defence budgets of key nations around the world and
600 25 a resurgence of global security threats suggest that the global military shipbuilding industry is
23 expected to return to growth in the next coming years as governments increase military spend to
550
recapitalize their defence infrastructure.
21
500
19
450 Australian Domestic Overview
17
The Australian Shipbuilding Industry has rebounded from spending cuts in 2010-11 defence budget
400 15
to undergo consistent growth over the past 5 years and is set to continue to grow with the Australian
Federal government announcing it will invest AUD $89 billion in Navy ships over the next 20 years.
Industry revenue will be boosted with the Offshore Patrol Vessel (OPV) program, estimated budget
AUS USA of AUD $3-5 billion and the Future Frigate program to replace the ANZAC class frigates, estimated
to be worth AUD $30 billion.
Historically the Federal Government has awarded all defence shipbuilding and support contracts to
Figure 7: Total Market Share of the Australia-based companies, however this has changed in the past 5 years with domestic shipbuilders
Shipbuilding Industry facing strong overseas competition from overseas competitors such as Fincantieri and Navantia for
these contracts. This is due to foreign shipbuilder’s ability to operate with low wage costs and large
economies of scale gaining a competitive advantage over Australian firms. Austal’s primary domestic
35%
31.5% 31.3% focus is on building patrol boats and winning the OPV program could provide in excess of AUD $200
30% 27.8% million per annum in revenue to Austal for over a decade.
25% United States of America and International Overview
US Navy spending will remain essential for global industry growth as they contribute to more than
20% one-third of industry revenue. As the US Navy attempts to meet its objective of creating a 308 ship
fleet to encounter the challenges of the coming years, demand for new naval vessels is expected to
15%
rise. The US Shipbuilding industry represent very high barriers to entry with domestic US
Shipbuilders protected by the Jones Act, where foreign-built vessels are prohibited on routes between
10%
US ports. This Act extends to Navy procurement.
5.3% 4.1%
5%
Sequestration and other government spending cuts post presidential election could derail the Navy’s
0% procurement plans. However, rising geopolitical tensions and the rise of Chinese Navy and continued
tension in the south China Sea mean the US is expected to increase spending on Navy products as it
Others
Huntington Ingalls
General Dynamics
Austal USA
BAE Systems
pivots its navy toward the more maritime-focused Asia, while also modernising its fleet.
Drivers for Future Demand
Federal Funding for Defence – Federal government defence policies, budgets and other political and
security considerations heavily decide the fate of the Global Military Shipbuilding industry. Winning
contracts with the US Defence and Royal Australian Navy (RAN) will contribute largely to revenue
Sources: IBISworld
growth of the shipbuilding and repair service industry in Australia, especially for Austal. With
growth in defence budgets, increased government expenditure tends to generate greater demand for
naval ships.
Real GDP Growth – Many countries usually expand their fleet when they have the funds to do so.
When countries’ economies expand, they have more money to spend on defence industry products.
Conversely, when their economies shrink, defence budgets are cut and funding for defence industry
products declines. Continued economic growth globally increase the demand for Navy’s to increase
their fleets.
3CFA Institute Research Challenge 24 Oct 2016
Political Tensions and Global Arms War – Geopolitical factors such as increased tensions with rivals,
Figure 8: Porter's Five Forces wars and national security threats being heightened increase the demand for Navy products.
Countries are more pressured than ever to increase spending on new naval ships whilst modernising
Bargaining Power
their fleet to maintain its ability to project power abroad, protect trade lanes and defend allies. In
Bargaining Power
of Suppliers
Suppliers particular, if a rival navy attains more combat ships, capacity and technology, national Navy’s
of
5 especially the US will try to outmatch that. Also abnormal events such as terrorist attacks on the US
Bargaining
4 on September 11 tend to lead to higher demand for defence equipment.
Power of
3 Threat of
Buyers 2
argaining SubstitutesThreat of
1 Competitive Positioning
wer of Buyers Substitutes
0 Over the past three decades Austal has built a world renowned business in shipbuilding, systems and
support. Centred on their expertise in aluminium design and construction, ASB has utilised this
position to expand from predominately commercial shipbuilding contracts to becoming a defence
prime contractor. Becoming the first non-American company to win defence contracts with the US
Navy is a testament to their success in this transition, and can be attributed to developing a
Industry Threat of
Rivalry
Industry ThreatNew
of Entrants competitive position from their strong base of experience, skill and managerial confidence.
Rivals New Entrants
Austal’s whole-of-ship production capabilities separates them from many other commercial
Source: Team Estimates shipbuilders, and continues to be a strength driving the defence contracting growth. Their capabilities
in design, construct and support of vessels provides confidence for buyers of an efficient one-stop
facility. Whole-of-ship production capability helped win initial contracts with the US Navy, with this
Figure 9: Australia vs Philippines achievement compounding to securing further lucrative defence contracts, and assuring their global
Ave Hourly Wage reputation.
25
Efforts to overcome a lull in key commercial ferry markets caused by weak economic conditions in
Hourly Rate in AU$
20 the wake of the 2008 Global Financial Crisis led to the opening of facilities in Cebu, Philippines. This
facility is in close proximity to high growth Asian markets, providing a new foothold to expand into
15 a new lucrative market. Furthermore, the Cebu facilities frees up capacity constraints on the
Henderson facilities, allowing it to focus upon future defence contracts.
10
5 Strong and experienced management has been a cornerstone of the company’s success, allowing them
to overcome the shrinking ferry demand and mitigate the challenges of transitioning into the defence
0 contracting space. With the changes to the businesses operations, Austal has recruited highly
Philippines Australia experienced senior management and board members to support the transition into.
Source: Trading Economics
Investment Summary
We issue a strong BUY recommendation on Austal Limited with a one-year target price of $1.95 using
Figure 10: Recommendation Criteria a Discounted Cash Flow to Firm Relative Multiples model. This indicates a 26.6% upside from the
October 21, 2016 closing price of $1.54 per share.
$2.00
Merits
Buy Balance Sheet Strength – The considerable steps Austal has taken in the past financial year to shore
$1.90
abov up their balance sheet places them in a robust position going forward. The sale of stock products has
e: buoyed ASB to a net positive cash in hand with excess of AUD $220 million at the ready to be
$1.80 deployed. With the prospective of lucrative defence programs upcoming, this leaves ASB in a strong
$1.80 position to act on the necessary capital expenditure required to facilitate these major programs.
Investments of $50 million in PP&E during FY2016 further solidifies this position and the readiness
Hold
undertake new contracts.
$1.70
Strong Pipeline of Contracts – With a current order book in excess of AU $3.5 billion through 2021,
Sell Austal is well placed to ensure that shipyards are working at capacity over the short-run until further
belo work can be secured. Expansion into new markets including High Speed Support Vessels for Oman
$1.60
w: and commercial ferries for Denmark show a diversification of business operations. Once the current
$1.70
order book has been delivered, ASB should be able to grow its support business which has the
potential to become a low risk, high margin annuity.
$1.50
Solidified Position in Defence Sector – Austal’s unique position as the only non-American prime
Expected Return (%)
contractor for the US Navy is indication of the design innovation and build quality. Proven
Sell Hold Buy
capabilities in delivering on time, cost-effective vessels combined with high industry barriers to
WACC - 3 WACC ± 3 WACC + 3 entry/exit places ASB in a secure position going into a change of US government and potential budget
< 10.6 10.6 – 16.6 > 16.6 sequestration. Strong performance abroad has demonstrated the capabilities required for potential
Source: Team Estimates involvement with planned Australian naval expansion.
4CFA Institute Research Challenge 24 Oct 2016
Figure 11: LCS Modifications Further Along the Cost Curve – Minimal reference points caused integration difficulties in the initial
phases of the LCS program due to Austal’s unique aluminium trimaran. With over 5,000 design
modifications each to LCS 6 and LCS 8, the increased costs related with the design modifications
LCS 6 5,200 reduced profitability on the early ships. Vessel modifications have fallen continuously from LCS 8 to
LCS 8 5,400 LCS 20, allowing ASB to now produce further along the cost curve and reap the benefits of the fixed-
price incentive contract structure of the current 10 ship buy block. A continuation of the LCS program
LCS10 4,900
and the associated design streamlining forms the basis of our gross profit growth assumptions from
LCS 12 4,500 its current level at 6.6% to 9% in 2026.
LCS 14 3,700
Concerns
LCS 16 2,900
Long-run Uncertainty – Being so heavily involved in contract work causes cash flow uncertainty past
LCS 18 1,300 the known pipeline of 2021 when LCS 26 is scheduled to be completed. Funding to the Department
LCS 20 300 of Defence is subject to change at the discretion of political motives. A dependence on revenue
streaming from a limited number of sources increases the risk profile of Austal should there be
changes from the status-quo.
Source: Company Data Negative US Press Towards LCS Program – While the US Navy continue to publically voice their
support for the LCS program, there are high-ranking Senate members of the Armed Services
Committee (SASC) and media pundits who vocally express their disdain for the program. Much of
Figure 12: Target Price Components criticism surrounds the ships initial costs overruns, and perceived limited lethality capabilities against
$2.0 air, sea and subsea adversaries. The US Navy continues to back through numerous administration
and leadership changes with the LCS forming a key role in the Navies strategic strategy going
$1.8 P/B forward building toward a 300 ship strong Navy.
$0.39
$1.6
EV/E Valuation
$1.4 BITD Our price target of $1.95 was formed with equal weightings between 10yr DCF perpetuity growth,
A
$1.2
10yr DCF exit multiple, Price/ FY+1 Earnings, Enterprise Value / FY+1 EBIT, and Price / Book value.
$0.42
Forward year earnings estimates were used as last years’ results were marred by the AUD $156
P/E
$1.0 million write down to works in progress, which we don’t expect to be recurring.
$0.27
$0.8
EBIT We chose a combination of valuation methods in our assessment of Austal, choosing a 40-60 split
$0.6 exit between discounted cash-flows (DCF) and comparable multiples respectively. This places less
$0.46 emphasis on the lack of predictability surrounding the future growth prospects of ASB, and more on
$0.4 relative valuations of comparable companies. Relative valuation multiples also encompass the much
Perp
etuit of the variables used in the DCF model, such as expectations of cash flows and risk, and are priced
$0.2
y accordingly. Austal’s failure to pay consistent dividends over the previous 5-10 years, and their lack
$0.0 $0.41 of current dividend policy were reasons the DDM model was not used.
Source: Team Estimates Sensitivity tables varying the WACC in the DCF valuations Appendix G, and small multiple ranges
around the comparable medians were used to plot high low prices, the midpoints of which were
averaged to give us our price of $1.95 This implies ASB’s EV/FY+1 EBIT of 12.0x and EV/FY+1 EBITDA
of 8.1x, a 26.6% premium over its $1.54 closing price on 21 October.
st
Figure 13: Historical Dividend
Payouts
Discounted Cash Flow Model
The DCF method was used to discount to present value, the estimated Unlevered Free Cash-Flows to
14
Firm (FCFF). FCFF is the standard measure of how much cash the company has left over, after
12 accounting for expenses, capital expenditure and before debt repayments. It gives investors an
indicator how much cash is available to pay-down debt, and increase shareholder wealth.
Cents per share
10
8
We chose to use a 10-year DCF model so that we could more gradually bring Austal’s margins in line
6 with their targets. The key assumptions driving the DCF model are detailed below. This is illustrated
4 in Appendix F.
2
Revenue - Austal’s largest current source of revenue is from their US Operations in Mobile, Alabama,
0 as seen in Figure 14. This has been due to the recent LCS contracts which have doubled ASB’s
revenues over the previous 5 years. The US Secretary of Defence has recently put forth plans to reduce
the Navy’s total buy from 52 to 40 ships, and even changing from a split buy to a single manufacturer,
Source: 2016 Annual Report
though the US Senate and Congress have somewhat halted this decision. The final verdict on the
5CFA Institute Research Challenge 24 Oct 2016
continuation of the LCS program will be made by the new government forming late 2016, with the
Figure 14: Revenue from ASB last ships likely being more combat focused frigates.
Subsidiaries The Australian government has also announced its plans to spend $39 billion on new navy ships, and
$1,600 we believe Austal is in a prime position to win some portion of that deal in the form of the Future
Frigate program.
$1,400
$1,200 While we view the future outlook for Austal highly, their current order book in excess of AUD $3.5
Revenue (AUD millions)
billion through 2021 forms the basis of our conservative revenue growth assumptions. These future
$1,000 contracts though are problematic to predict and value, and we acknowledge that any new contracts
being finalised in the near term will dramatically raise our revenue assumptions and price target
$800 going forward.
$600 Terminal Values – The first method for estimating the 10 year terminal value was an EBIT exit
multiple of 11x EBIT multiple was used as it better represents the depreciation levels of Austal’s
$400
largest assets, its property plant and equipment (PP&E). This multiple was sourced from the median
EV/ FY+1EBIT multiples of our 8 chosen comparable companies.
$200
$- A perpetuity growth rate of 2.5% to grow the terminal value of the final FCFF in our other DCF
valuation. The growth rate is centred on the RBA’s target for inflation of 2-3%, and too was a modest
2010
2011
2012
2013
2014
2015
2016
assumption considering the lack of certainty behind their future contracts. See Appendix F.
US Australia & Phillipines
Weight Average Cost of Capital (WACC) – Austal’s WACC was calculated using a build-up method
Source: Annual Reports
based around CAPM. Cost of equity was calculated using the Capital Asset Pricing Model (CAPM).
The 10-year Australian Government bond rate of 2.26% was selected in order to match the analysis
Table 1: Weighted Average Cost of
period. Beta was determined using the Defence Industry Beta by NYU Stern at 1.30. The market risk
Capital Components
premium was calculated at 7.37% based on a 10 year historical examination of the Australian market
risk premium. ASB’s size also warranted a firm-size premium of 2.5% in order to account for the
WACC Breakdown
riskiness of the relatively small firm. See Appendix H.
Risk-free Rate 2.26%
Beta 1.30 Using industry averages for defence and shipbuilding we determined a 3.6% pre-tax cost of debt.
Industry average debt and equity ratio of 0.19, and USA’s marginal tax rate of 40% were then used to
Market Risk Premium 7.37%
calculate ASB’s WACC of 13.6%.
Cost of Equity 13.2%
Cost of Debt 3.6% Relative Valuation
Austal’s size and location make it difficult to find direct competitors. Of the 8 companies chosen 6
Marginal Tax Rate 40%
were defence and naval contractors, 4 being direct competitors for future LCS and Australian frigate
Weight of Equity 81% contracts. The list was rounded out with 2 Australian based engineering firms, who source much of
their revenue from contract based manufacturing and more closely emulated ASB’s size. Before we
Weight of Debt 19%
begun comparing multiples, data from our chosen peers was converted into AUD $, while this was
WACC 13.60% not strictly needed for multiple calculations, it does show a better view of the size of the various
Source: Bloomberg, Team Estimates companies, across 5 different countries. See Appendix I.
Due to ASB’s write-down in 2016, their negative earnings cause mostly negative valuation multiples.
Table 2: Relative Multiples Earnings based multiples used 2017 forecasts for ASB’s EBITDA and Earnings with Bloomberg
estimates for the comparable companies. Price / Earnings was used as a good metric to compare
against selected industry peers, the value the market puts on $1 of ASB’s earnings. The EV/EBITDA
P/E EV / EBITDA P/B
multiple expands on this concept further. The median value of 15.3x implies ASB’s EV to be $381
ASB:AU 16.7 x 5.9 x 1.1 x Million, with a share price of $1.24.
LMT:US 19.3 x 12.2 x 21.8 x
Where share price equates to the market value of a company’s common equity, enterprise value
GD:US 15.3 x 9.9 x 4.1 x
expands further on the true value of the entire company, by subtracting cash levels and adding in
BA/:LN 13.6 x 8.7 x 4.6 x their total debt. EBITDA too gives a better comparable picture of earnings from an outside
perspective, where capital structure can greatly affect the bottom line earnings levels. The median
HII:US 14.6 x 7.9 x 4.7 x
value of 8.7x implies ASB’s EV to be $657 Million, with a share price of $2.04.
FCT:IM 101.1 x 12.0 x 0.6 x
WOR:AU 17.3 x 8.7 x 1.2 x The last multiple used was Price/Book value. The data used was normalised to IFRS standards as to
6269:JP 11.1 x 9.7 x 1.1 x
better compare the internal asset valuation methods between companies. P/B is used as an indicator
of the value the market places on the book value of a companies’ equity. The median P/B of 1.6x
UGL:AU 11.0 x 5.2 x 1.6 x implies an EV of $681 Million, with a share price of $2.11. See Appendix J.
Median: 15.3 x 8.7 x 1.6 x
Source: Team Estimates
6CFA Institute Research Challenge 24 Oct 2016
Financial Analysis
Figure 15: EBIT vs EBIT Margin Financial Ratios Unit 2015A 2016A 2017E 2018E 2019E 2020E 2021E
Profitability Ratios
105 8% Operating Profit Margin % 8.31 -4.34 6.60 7.10 7.90 8.05 8.20
EBITDA Margin % 7.75 -6.79 5.34 5.87 6.81 7.03 7.24
80 6%
EBIT Margin % 6.03 -9.03 3.60 4.10 5.00 5.18 5.36
Net Income Margin % 3.76 -6.29 2.00 2.41 3.07 3.24 3.41
55 4%
Return on Assets % 4.97 -8.31 2.78 3.42 4.40 4.67 4.90
30 2% Return on Fixed Assets % 12.01 -17.15 5.31 6.82 9.26 10.45 11.78
Return on Equity % 10.37 -18.40 6.02 7.27 9.08 9.36 9.56
Millions $
5 0%
Liquidity Ratios
Current Ratio x 1.30 1.53 1.37 1.41 1.50 1.59 1.69
-20 -2%
Cash Ratio x 0.30 0.73 0.61 0.65 0.73 0.82 0.93
-45 -4% Quick Ratio x 0.53 1.15 1.00 1.04 1.13 1.22 1.32
Efficiency Ratios
-70 -6%
Total Asset Turnover x 1.43 1.29 1.39 1.44 1.46 1.47 1.47
Fixed Asset Turnover x 3.50 2.87 2.76 2.80 2.98 3.18 3.40
-95 -8%
Current Asset Turnover x 2.54 2.50 3.15 3.34 3.20 3.03 2.86
-120 -10% Inventory Turnover x 3.88 6.23 12.06 12.23 12.18 12.23 12.23
2018 E
2017 E
2019 E
2020 E
2021 E
2015 A
2016 A
Leverage Ratios
Long-term Debt-to-Asset x 0.01 0.17 0.15 0.13 0.12 0.10 0.09
EBIT EBIT Margin Long-term Debt-to-Equity x 0.01 0.37 0.33 0.28 0.24 0.20 0.17
Source: 2016 Annual Report, Team Debt to Equity x 1.09 1.21 1.17 1.13 1.06 1.01 0.95
Estimates Net Debt to Equity x 0.03 -0.11 -0.08 -0.15 -0.23 -0.40 -0.47
Debt to Capital x 0.52 0.55 0.54 0.53 0.52 0.50 0.49
Equity Ratios
Earnings Per Share (EPS) $ 0.15 -0.24 0.08 0.10 0.14 0.15 0.16
Figure 16: Historical and Forecasted Book Value Per Share $ 1.48 1.32 1.35 1.41 1.49 1.59 1.70
Revenue
Asset Value Per Share $ 3.09 2.91 2.93 2.99 3.08 3.19 3.32
Growth Ratios
$1,800
Sales Growth % 26.0 -5.3 5.6 4.5 4.0 4.0 4.0
$1,600
Operating Income Growth % 53.5 -241.7 -142.1 19.0 26.8 7.7 7.6
Revenue ( AUD millions)
$1,400
Net Income Growth % 66.8 -258.4 -133.6 25.6 32.6 9.9 9.4
$1,200 Source: Bloomberg, Team Estimates
$1,000
Overview
$800
The financial ratios chart above reveals ASB’s prospects moving forward, highlighting our
$600 assumptions Historical data is presented from FY12-16 with forecasting period from 2017E-2021E.
$400
Flexibility in Financing New Contracts
$200
ASB’s extra capacity for debt, positions it well to finance future growth opportunities. ASB has the
$0 option to finance new opportunities with its cash in hand or debt. Historically the financial statements
have shown strong liquidity ratios, highlighted with the FY16 current ratio at 1.53x and interest
coverage ratio >4.0x historically, ignoring FY16 results due to the LCS write-downs. We expect this to
Source: Bloomberg, Team Estimates
continue in the near future.
This puts ASB in a strong credit position and demonstrates the ability to meet its interest payments
and debt obligations. The FY16 long-term debt to asset ratio is currently 0.17x, with majority of debt
consisting of tax-exempt Go Zone Bonds (avg. cost of 1.85%). The abnormally low rate of debt creates
a position where ASB is better served holding onto its cash and receiving tax benefits from these
bonds than repaying.
7CFA Institute Research Challenge 24 Oct 2016
Sustainable Earnings
Figure 17: Efficiency Ratios ASB’s revenue and EBIT margins are reliant on contract wins and as a result could see future high
fluctuation. The procurement of the Cebu shipyard emphasises ASB’s strategy to reduce labour costs
8 and hence boost margins. Between FY12 and FY16 ASB’s revenue doubled to AU$1.3B, with two
major contracts with the US Navy coming into full operation during this period. FY16 however saw
Efficency Ratios
6 negative EBIT due to WIP write-downs on the LCS operations, and reduced demand in Philippines
4 and Australian operations over the year. Through successful acquisition of new commercial contracts
for the Philippines and PPB for the Australian operations our group estimates show ASB returning
2 to positive EBIT in FY17. EBIT should continue to grow with a number of key contracts being awarded
in past 12 months coming on line in the coming periods to further improve margins.
0
Efficiency Ratios
Total Asset Turnover Over the preceding five years ASB has seen a steady albeit fluctuating improvement over the four
Fixed Asset Turnover key efficiency ratios. Total Asset turnover, Fixed Asset turnover and Current asset turnover all
reached highs in FY15 before falling slightly during FY16. Total Asset turnover saw improvements
Current Asset Turnover
from 0.79x FY12 to 1.29x FY16 down from FY15 high due to a reduction in current assets from the sale
Inventory Turnover
of inventory and WIP write down. Fixed Asset turnover improved from FY12 levels of 1.76x to 2.87x
Source: Company Data FY16 down from high in FY15, from an increase in PP&E at the same time revenue decreased over
the year. Current Assets rose from 1.49x FY12 to 2.5x FY16, with a small drop from FY15 due to
aforementioned reduction in Inventories. All three are expected to maintain trend improvement over
FY17. Inventory turnover likewise saw improvements over the FY12 – FY16 period of 3.15x to 6.23x
with the jump in FY16 increase coming from the aforementioned changes in inventory. This growing
trend of improving asset utilisation bodes well for the forward outlook.
Figure 18: DuPont Analysis
(2016A | 2021E)
DuPont Analysis
Historically, ASB has shown steady growth in profitability, with FY15 ROE of 10.37%. The WIP write
down of the LCS program in FY16 saw ROE fall to –18.4%. We forecast a return to positive ROE in
FY17 of 6.02%, with steady growth returning to FY15 levels at the end of our analysis period. Our
analysis showed ROA being a main driver, and looking forward through our decomposition,
profitability will be driven by improvements in operating efficiency. Following the expiration of
cheap long term debt, moving into a more equity based model will lead to a further improved
financial leverage position. See Appendix V.
Source: Bloomberg, Team Estimates Monte Carlo Simulation
A Monte Carlo Simulation was conducted to simulate the impact that variation in key variables would
have on the share price. 10,000 iterations of the simulation were run accounting for these internal and
external variances.
In defining gross profit and revenue a scenario analysis was used allowing for upper and lower
Table 3: Monte Carlo Simulation bounds derived from financial forecasts. A dual approach was taken in calculating an appropriate
Statistics gross profit volatility, using ASB’s historical margin in conjunction with the proportion of ship costs
exposed to material volatility such as aluminium and steel. Distributions for the risk free rate,
Summary
perpetuity growth and market return were derived from historical analysis of the 10-year Australian
Number of Iterations 10,000
government bond, RBA inflation band and the ASX200 respectively.
Minimum $1.57
Maximum $2.13
Mean $1.85
These inputs, as seen in Appendix W, forecast a 1-Year Price Target of $1.85 and a 77.24% confidence
Skewness -0.193 in our BUY recommendation.
Kurtosis 2.799
Median $1.85
5% CI $1.71 Figure 21: Monte Carlo Simulation
95% CI $1.98
% of Simulations > 1.79 77.24%
Probability
% of Simulations < 1.79 22.76%
Source: Team Estimates, Bloomberg,
ModelRisk
ASB Share Price (AUD)
Source: Team Estimates, Bloomberg, ModelRisk
8CFA Institute Research Challenge 24 Oct 2016
Corporate Governance
Table 4: Board of Directors Peer Management
Comparison The management team at Austal is comprised of four directors each of which possesses a strong
background in shipbuilding, defence or engineering. Non-Executive Chairman and Founder John
Board of Directors Rothwell has over 40 years of experience in shipbuilding and facilitated the transition of Austal from
Ticker No. Tenure Shares commercial to defence work. Chief Executive Officer David Singleton has previous experience in the
ASB 4 9.6 9.35% role of CEO in both the defence and engineering industries. Independent directors Jim McDowell and
LMT 10 7.8 0.06% Giles Everist provide defence and finance experience respectively. See Appendix O
BAE 11 4 0.07%
HII 8 4.5 1.8%
Source: Bloomberg
Governance
Austal is compliant with the majority of guidelines stipulated in the ASX Corporate Governance
Council’s Principles and Recommendations. This includes the formation of the Nomination and
Remuneration Committee and Audit & Risk Committee to oversee internal controls, policies and
compensation.
The equity holdings of board members John Rothwell (9.3% equity stake) and David Singleton (share
Table 5: Beneficial Ownership based remuneration package) disqualify them from an independent classification. As only 2 of the 4
board members can be classified as independent, this raises questions regarding the independent
Stakeholders Outstanding judgement and decision making ability of the board. There is an overlap of 2/3 audit and
Shares compensation committee members which research suggests can improve intra-board information
Directors 9.34% flows and financial reporting quality at the potential expense of governance quality. Third party
governance analyst ISS rates Austal 8/10 (High Risk) echoing the concern regarding the sub-optimal
Executives 0.01%
board and committee structure. ASB’s increased susceptibility to weaker corporate governance is also
Total 9.35% demonstrated through defence contractor peer comparison. The smaller board size with increased
Source: 2016 Annual Report tenure and percentage of outstanding shares is indicative of management entrenchment.
Corporate Social Responsibility
By analysing Austal’s commitment to social objectives, CSRHub calculated a 56/100 rating for overall
CSR, placing it in the 62nd percentile for the manufacturing industry. Austal’s key strategies regarding
these objectives can be summarised as follows:
Employees – Austal has established a supportive, diverse and community-oriented workplace that
aims to retain employees and promote a work-life balance. Austal’s Equity and Diversity reports
detail their commitment to inclusiveness including a fair representation of women in management
and professional roles
Environment – Projects are delivered in an environmentally responsible manner in compliance with
relevant environmental laws and regulations as outlined in Austal’s Environmental Policy Summary
Figure 19: Risk Matrix
Community – Austal supports organisations targeting mental and physical health through its “Austal
5 Giving” program by giving financial support, leadership and advocacy of health initiatives. Austal
has assisted to charities such as Cystic Fibrosis WA, Anglicare WA and Lifeline WA.
4
Probability
3 MR1 BR1 Investment Risks
2 MR2 OR2
Business Risk
1 OR1 Contract Risk (BR1) - In order to maintain strong revenue growth, ASB must continue to service and
acquire contracts to ensure shipyards are working near capacity over the valuation period. ASB
1 2 3 4 5 currently holds a contract pipeline of AUD $4 billion through 2021 across their three shipyards. US
operations contributed to 84% of total revenue during FY16 indicating there currently there exists a
Impact
large dependence on the success of US operations and in particular the LCS program. The proposed
Source: Team Estimates
truncating of the LCS program would drastically alter the valuation should the US Navy decide not
to continue with ASB’s trimaran LCS design. Whilst the Mobile shipyard would be repurposed to
accommodate alternative work, a dissociation from the US Navy would likely have disastrous flow-
on effects including diminishing the possibility of landing additional work for the Royal Australian
Navy (RAN).
Following the Federal Government’s decision to reinforce the RAN through an AUD$89bn
investment in surface ships and submarines, ASB shifted its Australian focus into securing the build
9CFA Institute Research Challenge 24 Oct 2016
contracts for the Offshore Patrol Vessel (OPV) and Future Frigate programs. With construction
commencing in 2018 and 2020 respectively, these programs represent significant opportunities for
ASB to secure a long-term contract pipeline and establish themselves as the premier Australian
shipbuilder.
Figure 20: Military Expenditure as a Failure to win these contracts would reduce revenue generation in the latter years of our valuation
Percentage of GDP and potentially lead to under-utilisation of Australian operations resulting from the lack of work.
Assuming the continuation of the LCS program which contributes the bulk of current revenue,
5% minimal effects would be seen to the valuation. However, being overlooked for the OPV and Future
Frigate programs would signify a lack of faith from the RAN and potentially diminish future
4% prospects whilst also missing out on this generation of Australian shipbuilding.
3%
Operational Risks
Transition from Aluminium to Steel (OR1) – Both the Future Frigate and Offshore Patrol Vessel
2%
programs will be steel-hulled ships, requiring a deviation from ASB’s historically aluminium designs.
Steel is traditionally easier to weld with than aluminium however the transition does increase the
1%
level of operational risk associated with selecting ASB as the shipbuilder. The success of the Pacific
Patrol Boat contract consisting of 19 steel-hulled vessels will be instrumental in demonstrating ASB’s
0%
steel shipbuilding competency for these future projects.
Margin (OR2) – Our valuation is predicated on the growth of Austal’s operating margins over the 10
US AU year DCF period as a function of the continued growth of the support business and the stability of
input costs. Given ASB’s EBIT target of 5-7%, an EBIT of 3.6% in FY 2016 rising to 6.3% in FY 2026
Source: Bloomberg should provide conservative earnings estimates. Should margins stay constant at 3.6% and fail to
reach ASB’s targets, a $1.72 price would be reached issuing a HOLD recommendation.
Market Risks
Foreign Exchange (MR1) - ASB faces exposure to currency movements on future transactions
denominated in currencies other than AUD for the Australian operation and USD for the US
operation. Foreign currency exposures are 100% hedged for known input costs and contracted
Table 6: Risk Mitigation
receipts. A stronger USD reduces US input costs and increases relative Australian export
attractiveness. In recent years, the strong USD has additionally provided a tailwind for profit
Risk Mitigating Factors translation from US operations. The 2016 Annual Report also shows a high level of exposure to the
Material Pacific Patrol Boat to EUR/AUD and EUR/USD rates on equity valuation.
Transition demonstrate
capabilities Macroeconomic Trends (MR2) – A high level of correlation exists between military expenditure and
Margin Growth of low-risk GDP including a soft 2% target set by the Australian government. Despite this correlation,
support business and governments aim to allocate defence spending with respect to security requirements rather than
input cost stability
solely GDP. An economic slowdown would have tangible, albeit slightly delayed effects felt through
Foreign Hedge all known
tightening fiscal policy. Defence spending as a portion of GDP is trending downwards in the US
Exchange inputs and contracts
Contract Diversification of client
indicating a public focus in alternative sectors placing ASB’s largest source of revenue generation at
base to reduce the potential risk. On the commercial side of business where shorter lead times and contract lengths allow
dependence on LCS for greater elastic demand variability, economic instability would have a more pronounced effect.
Macro Securing long-term
Trends contracts that bridge Political Risks
cycles
Policy Change (PR1) – As primarily a defence contractor, ASB’s vessel demand is at the discretion of
Policy Future expansion into
global political agendas, in particular Australian and the US. Reductions in military presence or
Change integral Australian
projects expenditure would pose a significant risk to our valuation as the LCS/FF programs are the key drivers
Source: Team Estimates of ASB’s growth potential and future development.
The LCS program has already faced pressures from the current US Secretary of Defence to downsize
from 52 to 40 ships whilst committing to a single design. The next executive branch will be expected
decide on the direction of the LCS program and given the pro-military backgrounds of both 2016
presidential candidates’ significant naval cutbacks are unlikely. However, further legislative branch
disapproval regarding the LCS may cause funding problems regardless of president.
10CFA Institute Research Challenge 24 Oct 2016
Appendix A: Statement of Financial Position
In 000s’ AUD $
2012 A 2013 A 2014 A 2015 A 2016 A 2017 E 2018 E 2019 E 2020 E 2021 E 2026 E
Assets
Current Assets
Cash and equivilents $51,811 $38,030 $74,428 $138,413 $224,318 $192,390 $213,089 $246,844 $288,365 $336,804 $688,748
Trade and receivables 96,172 102,743 95,753 104,315 128,340 121,747 127,226 132,315 137,608 143,112 174,118
Inventories 193,529 277,888 328,142 339,703 108,974 110,044 114,380 117,931 122,449 127,139 153,420
Prepayments 6,538 7,653 4,054 6,321 5,408 2,356 2,462 2,476 2,548 2,622 3,022
Derivatives 36,041 7,749 2,701 106 147 141 148 154 160 166 202
Assets held for sale 1,561 - - - 2,908 2,908 2,908 2,908 2,908 2,908 2,908
Total Current Assets $438,592 $503,736 $514,610 $598,913 $470,095 $429,587 $460,213 $502,627 $554,037 $612,751 $1,022,417
Non-Current Assets
PP&E 370,383 399,917 366,500 442,522 490,798 532,406 521,092 508,785 495,445 481,032 391,293
Other financial assets 944 4,141 - 3,784 7,638 7,638 7,638 7,638 7,638 7,638 7,638
Derivatives 10,625 1,651 5,787 9 340 340 340 340 340 340 340
Deferred tax assets 380 22,647 9,022 14,089 34,959 34,959 34,959 34,959 34,959 34,959 34,959
Intangibles and goodwill 5,045 12,526 9,473 9,637 9,296 14,939 16,118 17,345 18,620 19,947 27,420
Total Non-Current Assets $387,395 $440,882 $396,687 $470,041 $543,031 $590,281 $580,147 $569,066 $557,003 $543,916 $461,650
Total Assets $825,987 $944,618 $911,297 $1,068,954 $1,013,126 $1,019,869 $1,040,360 $1,071,694 $1,111,039 $1,156,667 $1,484,067
Liabilities
Current Liabilities
Interest bearing loans -$18,973 -$243,614 -$13,192 -$144,979 -$2,545 -$2,291 -$2,061 -$1,855 -$1,670 -$1,503 -$887
Trade and other payables -128,626 -133,813 -183,570 -223,497 -229,774 -220,088 -228,761 -235,862 -244,897 -254,278 -306,840
Derivatives -2,186 -12,193 -1,972 -21,337 -10,690 -14,138 -14,775 -15,366 -15,980 -16,619 -20,220
Provisions -18,250 -25,128 -33,704 -33,830 -42,291 -42,415 -44,324 -46,097 -47,941 -49,858 -60,660
Deferred grant income -3,561 -4,221 -3,550 -3,244 -8,543 -5,655 -5,910 -6,146 -6,392 -6,648 -8,088
Income tax payable -27,394 -24,537 -10,980 -7,493 -98 -23 -28 -35 -38 -41 -58
Pre-payments -27,288 -21,790 -29,062 -26,177 -12,812 -29,345 -30,501 -31,448 -32,653 -33,904 -40,912
Total Current Liabilities -$226,278 -$465,296 -$276,030 -$460,557 -$306,753 -$313,956 -$326,360 -$336,810 -$349,571 -$362,851 -$437,666
Non-Current Liabilities
Derivatives -5,757 -4,885 -2,229 -14,737 -5,712 -5,712 -5,712 -5,712 -5,712 -5,712 -5,712
Interest bearing loans -246,444 -1,163 -142,264 -7,658 -170,066 -153,059 -137,753 -123,978 -111,580 -100,422 -59,298
Provisions -2,060 -2,217 -1,023 -1,139 -1,052 -1,052 -1,052 -1,052 -1,052 -1,052 -1,052
Deferred govt grants -48,753 -52,794 -49,892 -63,722 -71,991 -76,497 -81,003 -85,509 -90,015 -94,521 -117,051
Total Non-Current Liabilities -$322,662 -$72,135 -$202,035 -$95,998 -$248,821 -$236,320 -$225,520 -$216,251 -$208,359 -$201,707 -$183,113
Total Liabilities -$548,940 -$537,431 -$478,065 -$556,555 -$555,574 -$550,276 -$551,880 -$553,061 -$557,930 -$564,558 -$620,779
Equity
Contributed equity 31,762 111,328 111,598 112,523 114,738 114,738 114,738 114,738 114,738 114,738 114,738
Reserves 22,595 37,309 27,292 55,846 100,672 100,672 100,672 100,672 100,672 100,672 100,672
Retained earnings 222,690 258,560 294,041 343,798 242,142 254,182 273,070 303,223 337,699 376,700 647,878
Total Equity to owners $277,047 $407,197 $432,931 $512,167 $457,552 $469,592 $488,480 $518,633 $553,109 $592,110 $863,288
11CFA Institute Research Challenge 24 Oct 2016
Appendix B: Statement of Cash-flows
In 000s’ AUD $
2012 A 2013 A 2014 A 2015 A 2016 A 2017 E 2018 E 2019 E 2020 E 2021 E 2026 E
Cash flow from operating activities
Net Income / (loss) after tax $11,043 $35,742 $31,859 $53,156 -$84,182 $28,249 $35,461 $47,057 $51,719 $56,588 $84,696
Depreciation and amortisation 16,324 24,509 23,776 24,266 29,899 23,429 24,907 26,443 28,041 29,703 39,065
Total changes in Working Capital 13,504 -117,496 -10,159 51,235 159,161 16,037 2,706 1,997 3,058 3,171 3,804
Cash from (used) in operating activities 33,136 -55,868 41,628 110,434 102,066 67,715 63,073 75,498 82,818 89,463 127,565
Cash flow from investing activities
Purchase of PP&E -131,459 -21,265 -11,884 -28,126 -12,793 -70,692 -14,775 -15,366 -15,980 -16,619 -20,220
Receipts from govt grants 8,698 4,763 4,506 4,986 14,463 4,506 4,506 4,506 4,506 4,506 4,506
Proceeds from sale of PP&E 0 9,351 24,611 2,355 2,469 5,655 1,182 1,229 1,278 1,330 1,618
Purchase of intangible assets -1,849 -3,478 -1,263 -1,053 -995 -5,643 -1,179 -1,227 -1,276 -1,327 -1,614
Cash from (used) in operating activities -124,610 -6,645 18,972 -21,838 -24,977 -66,173 -10,266 -10,857 -11,471 -12,111 -15,711
Cash flow from financing activities
Repayments of debt -40,557 -93,368 -114,238 -40,575 -11,992 -17,261 -15,535 -13,981 -12,583 -11,325 -6,687
Dividends paid -11,284 - - -3,468 -15,767 -16,208 -16,573 -16,905 -17,243 -17,588 -19,418
Cash from (used) in financing activities 18,191 64,168 -89,321 -34,594 -4,713 -33,470 -32,108 -30,886 -29,826 -28,913 -26,105
Change in cash and equivalents -73,283 1,655 -28,721 54,002 72,376 -31,928 20,699 33,755 41,521 48,440 85,749
Cash and equivilents
Cash at beginning of year 171,102 104,751 107,703 83,960 148,468 224,318 192,390 213,089 246,844 288,365 602,999
Net increase /(decrease) in cash -73,283 1,655 -28,721 54,002 72,376 -31,928 20,699 33,755 41,521 48,440 85,749
Cash and equivilents at end of year $104,751 $107,703 $83,960 $148,468 $224,318 $192,390 $213,089 $246,844 $288,365 $336,804 $688,748
Appendix C: Statement of Consolidated Income
In 000s’ AUD $
2012 A 2013 A 2014 A 2015 A 2016 A 2017 E 2018 E 2019 E 2020 E 2021 E 2026 E
Revenue $652,351 $897,260 $1,122,542 $1,414,006 $1,338,864 $1,413,840 $1,477,463 $1,536,562 $1,598,024 $1,661,945 $2,022,010
Cost of Goods Sold -609,506 -807,330 -1,028,599 -1,296,439 -1,396,921 -1,320,527 -1,372,563 -1,415,173 -1,469,383 -1,525,666 -1,841,040
Gross Profit 42,845 89,930 93,943 117,567 -58,057 93,313 104,900 121,388 128,641 136,280 180,970
Gross profit margin % 6.6% 10.0% 8.4% 8.3% -4.3% 6.6% 7.1% 7.9% 8.1% 8.2% 9.0%
SG&A -26,268 -51,864 -38,378 -32,294 -62,808 -42,415 -44,324 -44,560 -45,863 -47,199 -54,392
EBITDA 32,901 62,575 79,341 109,539 -90,966 75,561 86,793 104,663 112,295 120,347 167,699
EBITDA margin % 5.04% 6.97% 7.07% 7.75% -6.79% 5.34% 5.87% 6.81% 7.03% 7.24% 8.29%
D&A 16,324 24,509 23,776 24,266 29,899 24,662 26,217 27,835 29,517 31,266 41,121
EBIT 16,577 38,066 55,565 85,273 -120,865 50,898 60,576 76,828 82,778 89,080 126,578
EBIT margin % 2.5% 4.2% 4.9% 6.0% -9.0% 3.6% 4.1% 5.0% 5.2% 5.4% 6.3%
Net interest expense -4,020 -11,340 -8,421 -4,110 -5,499 -5,853 -5,125 -4,418 -3,742 -3,096 -111
EBT 12,557 26,726 47,144 81,163 -126,364 45,045 55,451 72,411 79,036 85,985 126,467
Profit Margin % 1.9% 3.0% 4.2% 5.7% -9.4% 3.2% 3.8% 4.7% 4.9% 5.2% 6.3%
Income tax expense -1,514 9,016 -15,285 -28,007 42,182 -16,796 -19,990 -25,353 -27,317 -29,396 -41,771
Effective tax rate 9% -24% 28% 33% 35% 33% 33% 33% 33% 33% 33%
Net Income / (loss) $11,043 $35,742 $31,859 $53,156 -$84,182 $28,249 $35,461 $47,057 $51,719 $56,588 $84,696
Other comprehensive income 929 13,450 -6,467 27,624 46,077 7,069 7,387 7,683 7,990 8,310 10,110
Total comprehensive income $11,972 $49,192 $25,392 $80,780 -$38,105 $35,318 $42,848 $54,740 $59,709 $64,898 $94,806
Earnings per share (cents) 4.54 12.01 9.30 15.38 -24.21 8.13 10.20 13.54 14.88 16.28 24.36
12CFA Institute Research Challenge 24 Oct 2016
Appendix D: Depreciation Schedule
In 000s’ AUD $
Debt schedule was used build up approximations for depreciation and capital expenditure for the DCF model through to 2026.
Useful life sourced from annual reports.
2016 A 2017 E 2018 E 2019 E 2020 E 2021 E 2022 E 2023 E 2024 E 2025 E 2026 E
PP&E (beg of year) 490,798 532,406 521,092 508,785 495,445 481,032 465,502 448,811 430,911 495,445
CAPEX 12,793 70,692 14,775 15,366 15,980 16,619 17,284 17,976 18,695 19,442 20,220
As a % of revenue 1.0% 5.0% 1.0% 1.0% 1.0% 1.0% 1.0% 1.0% 1.0% 1.0% 1.0%
Useful life
PP&E Years 30
CAPEX Years 10
Depreciation (straight line)
Existing PP&E 16,360 16,360 16,360 16,360 16,360 16,360 16,360 16,360 16,360 16,360
2017 CAPEX 7,069 7,069 7,069 7,069 7,069 7,069 7,069 7,069 7,069 7,069
2018 CAPEX 1,477 1,477 1,477 1,477 1,477 1,477 1,477 1,477 1,477
2019 CAPEX 1,537 1,537 1,537 1,537 1,537 1,537 1,537 1,537
2020 CAPEX 1,598 1,598 1,598 1,598 1,598 1,598 1,598
2021 CAPEX 1,662 1,662 1,662 1,662 1,662 1,662
2022 CAPEX 1,728 1,728 1,728 1,728 1,728
2023 CAPEX 1,798 1,798 1,798 1,798
2024 CAPEX 1,869 1,869 1,869
2025 CAPEX 1,944 1,944
2026 CAPEX 2,022
Total book depreciation $29,899 $23,429 $24,907 $26,443 $28,041 $29,703 $31,432 $33,229 $35,099 $37,043 $39,065
13CFA Institute Research Challenge 24 Oct 2016
Appendix E: Operating Working Capital Schedule
In 000s’ AUD $
Operating working capital schedule was used to forecast the changes in working capital for the DCF model. Averages of the 4 years
before the write-down were used to estimate payable, prepaid and turnover days. The write down of work in progress was booked to
inventories, and is the reason for the negative working capital.
2016 A 2017 E 2018 E 2019 E 2020 E 2021 E 2022 E 2023 E 2024 E 2025 E 2026 E
Current Asset
Trade and receivables 128,340 121,747 127,226 132,315 137,608 143,112 148,836 154,790 160,981 167,421 174,118
Days receivable 31.28 31.00 31.00 31.00 31.00 31.00 31.00 31.00 31.00 31.00 31.00
Inventories 108,974 110,044 114,380 117,931 122,449 127,139 132,008 137,064 142,313 147,762 153,420
Inventory turnover days 57.81 30.00 30.00 30.00 30.00 30.00 30.00 30.00 30.00 30.00 30.00
Prepayments 5,408 2,356 2,462 2,476 2,548 2,622 2,698 2,776 2,856 2,938 3,022
Days prepaid -36.36 20.00 20.00 20.00 20.00 20.00 20.00 20.00 20.00 20.00 20.00
Derivatives 147 141 148 154 160 166 173 180 187 194 202
% Of revenue 0.01% 0.01% 0.01% 0.01% 0.01% 0.01% 0.01% 0.01% 0.01% 0.01% 0.01%
Total current assets $242,869 $234,289 $244,216 $252,875 $262,764 $273,039 $283,716 $294,810 $306,337 $318,315 $330,762
Current Liabilities
Trade and other payables -229,774 -220,088 -228,761 -235,862 -244,897 -254,278 -264,017 -274,128 -284,626 -295,525 -306,840
Days payable 58.41 60.00 60.00 60.00 60.00 60.00 60.00 60.00 60.00 60.00 60.00
Derivatives -10,690 -14,138 -14,775 -15,366 -15,980 -16,619 -17,284 -17,976 -18,695 -19,442 -20,220
% Of revenue 1.20% 1.00% 1.00% 1.00% 1.00% 1.00% 1.00% 1.00% 1.00% 1.00% 1.00%
Provisions -42,291 -42,415 -44,324 -46,097 -47,941 -49,858 -51,853 -53,927 -56,084 -58,327 -60,660
% Of revenue 2.84% 3.00% 3.00% 3.00% 3.00% 3.00% 3.00% 3.00% 3.00% 3.00% 3.00%
Deferred grant income -8,543 -5,655 -5,910 -6,146 -6,392 -6,648 -6,914 -7,190 -7,478 -7,777 -8,088
% Of revenue 0.44% 0.40% 0.40% 0.40% 0.40% 0.40% 0.40% 0.40% 0.40% 0.40% 0.40%
Income tax payable -98 -23 -28 -35 -38 -41 -44 -47 -51 -54 -58
Days payable (0.0023) 0.50 0.50 0.50 0.50 0.50 0.50 0.50 0.50 0.50 0.50
Pre-payments -12,812 -29,345 -30,501 -31,448 -32,653 -33,904 -35,202 -36,550 -37,950 -39,403 -40,912
Days payable 5.02 8.00 8.00 8.00 8.00 8.00 8.00 8.00 8.00 8.00 8.00
Total current Liabilties -$304,208 -$311,665 -$324,298 -$334,954 -$347,901 -$361,348 -$375,313 -$389,818 -$404,883 -$420,529 -$436,779
Total operating working capital -$61,339 -$77,376 -$80,082 -$82,079 -$85,137 -$88,309 -$91,597 -$95,008 -$98,545 -$102,213 -$106,017
Change operating working capital 196,206 -16,037 -2,706 -1,997 -3,058 -3,171 -3,289 -3,411 -3,537 -3,668 -3,804
14CFA Institute Research Challenge 24 Oct 2016
Appendix F: Discounted Cash-Flow
In 000s’ AUD $
The Unlevered Free Cash-Flows available to the Firm (UFCFF) were discounted back at the WACC of 13.6% to arrive at the net present
value of the cash-flows, $348,160.
2016A 2017E 2018E 2019E 2020E 2021E 2022E 2023E 2024E 2025E 2026E
Net Sales $1,338,864 $1,413,840 $1,477,463 $1,536,562 $1,598,024 $1,661,945 $1,728,423 $1,797,560 $1,869,462 $1,944,241 $2,022,010
% growth -5.3% 5.6% 4.5% 4.0% 4.0% 4.0% 4.0% 4.0% 4.0% 4.0% 4.0%
EBITDA -90,966 75,561 86,793 104,663 112,295 120,347 128,840 137,798 147,244 157,202 167,699
% margin -6.8% 5.3% 5.9% 6.8% 7.0% 7.2% 7.5% 7.7% 7.9% 8.1% 8.3%
(-) Depreciation 29,899 24,662 26,217 27,835 29,517 31,266 33,086 34,978 36,946 38,992 41,121
EBIT -120,865 50,898 60,576 76,828 82,778 89,080 95,755 102,820 110,298 118,210 126,578
% Margin -9.0% 3.6% 4.1% 5.0% 5.2% 5.4% 5.5% 5.7% 5.9% 6.1% 6.3%
(-) Taxes -42,182 16,796 19,990 25,353 27,317 29,396 31,599 33,931 36,398 39,009 41,771
Marginal tax rate 34.9% 33.0% 33.0% 33.0% 33.0% 33.0% 33.0% 33.0% 33.0% 33.0% 33.0%
Unlevered Net Income -78,683 34,102 40,586 51,475 55,461 59,684 64,156 68,890 73,900 79,201 84,807
(+) D&A 29,899 24,662 26,217 27,835 29,517 31,266 33,086 34,978 36,946 38,992 41,121
(+) Working capital changes 159,161 16,037 2,706 1,997 3,058 3,171 3,289 3,411 3,537 3,668 3,804
(-) CAPEX -12,793 -70,692 -14,775 -15,366 -15,980 -16,619 -17,284 -17,976 -18,695 -19,442 -20,220
Unlevered FCFs $97,584 $4,109 $54,734 $65,942 $72,056 $77,502 $83,246 $89,303 $95,688 $102,419 $109,512
Discounted Cash-flows $3,617 $42,413 $44,980 $43,267 $40,966 $38,734 $36,578 $34,501 $32,507 $30,597
NPV of UFCFF $ 348,160
Terminal Values:
Exit Multiple 11x Perpetuity growth 2.5%
2026E EBIT 126,578 2026E FCFF 109,512
Terminal Value 1,392,356 Terminal Value 1,011,256
PV of Terminal Value $389,016 PV of Terminal Value $282,539
DCF Value: EBIT Exit Perpetuity Growth
Present Value of Cash Flows 348,160 348,160
Present Value of Terminal Value 389,016 282,539
Total Enterprise Values $737,176 $630,699
Net Debt -51,707 -51,707
Share Count 347,665 347,665
Equity Value $788,883 $682,406
Estimated share price $2.27 $1.96
15You can also read