Changes in complement activation products after anti VEGF injection for choroidal neovascularization in age related macular degeneration and ...
←
→
Page content transcription
If your browser does not render page correctly, please read the page content below
www.nature.com/scientificreports
OPEN Changes in complement activation
products after anti‑VEGF injection
for choroidal neovascularization
in age‑related macular
degeneration and pachychoroid
disease
Keiichiro Tanaka1, Yasuharu Oguchi1, Tomoko Omori2, Yumi Ishida2, Hiroaki Shintake1,
Ryutaro Tomita1, Akihito Kasai1, Masashi Ogasawara1, Yukinori Sugano1, Kanako Itagaki1,
Akira Ojima1, Takeshi Machida2, Hideharu Sekine2 & Tetsuju Sekiryu1*
We evaluated changes in the complement system resulting from anti-vascular endothelial growth
factor (VEGF) in eyes with age-related choroidal neovascularization (CNV) including neovascular
age-related macular degeneration, pachychoroid neovasculopathy, and polypoidal choroidal
neovasculopathy. We measured the concentrations of the complement activation products (C3a,
C4a), VEGF, and monocyte chemotactic protein-1 in the aqueous humor during intravitreal anti-
VEGF injections for CNV. The VEGF level decreased significantly (P < 0.001), while the C3a and C4a
levels increased significantly (P < 0.001 for both comparisons) 1 month after two monthly anti-VEGF
injections. The VEGF level was correlated with the C3a (R = 0.328, P = 0.007) and C4a (R = − 0.237,
P = 0.055) levels at baseline, but the correlation between the VEGF and C3a levels (R = − 0.148,
P = 0.242) changed significantly (P = 0.028 by analysis of covariance) after anti-VEGF treatment. The
C3a increase after anti-VEGF therapy did not change the visual outcomes in eyes with CNV for 1 year.
Dysregulation of the complement system can be induced after anti-VEGF therapy.
Age-related macular degeneration (AMD) is a leading cause of blindness in developed c ountries1.The estimated
number of people with AMD is 196 million in 2020 and is expected to increase to 288 million in 2040 w orldwide2.
Therefore, an effective therapeutic strategy for AMD treatment has a significant impact on elderly persons and
society as a whole. AMD is classified as atrophic or neovascular AMD; the former is characterized by atrophy of
the photoreceptors and retinal pigment epithelium (RPE) without exudative changes and the latter by choroidal
neovascular membranes (CNV) and retinal edema at the macula. Recently, “pachychoroid disease” that includes
pachychoroid neovascularization (PNV) and polypoidal choroidal vasculopathy (PCV) was proposed. PNV and
PCV are characterized by type 1 CNV with a thick choroid and no or rare soft d rusen3.
Although the AMD etiology is unknown, a disorder of the complement system may be deeply involved in
AMD development. Previous genetic studies have reported the high incidence of the polymorphism related to
the complement system in patients with AMD4. Histopathologic studies reported that complement activation
products deposit in the drusen on the RPE cells, Bruch’s membrane, and choriocapillaris5,6.
The complement system plays a pivotal role both in the innate and adaptive immune system. The comple-
ment system is comprised of three activation pathways: classical, lectin, and alternative pathways. Complement
activation finally leads to phagocytosis and the cell-killing process by the membrane attack complex. Comple-
ment activation products 3a (C3a), 4a (C4a), and 5a (C5a) are fragments resulting from complement activation,
which cause smooth muscle contraction, vasodilation, histamine release from mast cells, and enhance vascular
permeability7. Activation of all three pathways generate C3a. C4a is induced in the classical and lectin pathway.
1
Department of Ophthalmology, Fukushima Medical University, Fukushima 960‑1295, Japan. 2Department of
Immunology, Fukushima Medical University, Fukushima 960‑1295, Japan. *email: sekiryu@fmu.ac.jp
Scientific Reports | (2021) 11:8464 | https://doi.org/10.1038/s41598-021-87340-6 1
Vol.:(0123456789)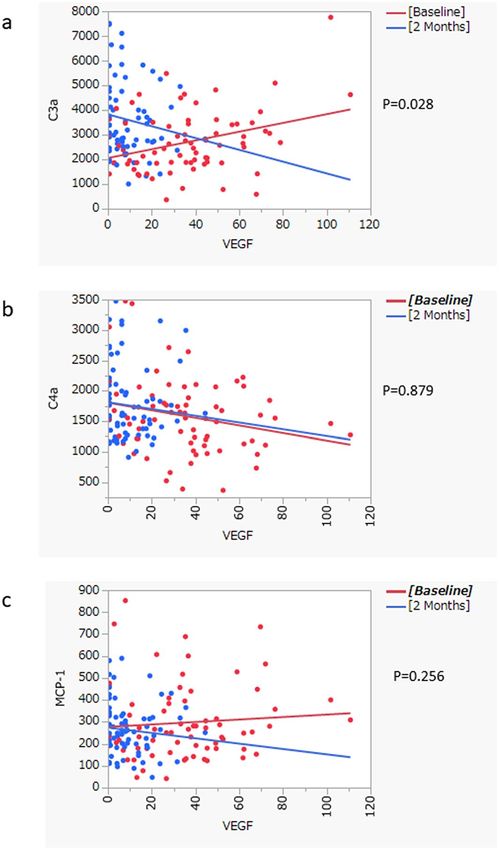
www.nature.com/scientificreports/
C5a is generated as a result of activation of the terminal pathway. Elevated C3a in the intraocular fluid in neo-
vascular AMD (nAMD) suggests the involvement of the complement s ystem8.
Proangiogenic cytokines are also profoundly involved in the development of nAMD. Anti-vascular endothelial
growth factor (VEGF) drugs have revolutionized treatment of nAMD. Intravitreal administration of anti-VEGF
drugs has become the first-line treatment. However, recent reports have enumerated several concerns about
anti-VEGF therapy.
RPE atrophy developed in 10% to 20% of patients treated with anti-VEGF therapy during 5 years of follow-
up9. Inflammation, photooxidation of retinol d erivatives5, oxidative s tress10, and lipid a ccumulation11 may induce
RPE degeneration resulting in loss of photoreceptors and choriocapillaris12. The photoreceptors, RPE, and cho-
riocapillaris complex survive these cellular stresses by organizing the secretory protein n etwork13. VEGF is a key
cytokine in this network. Reduced VEGF secretion from the RPE by paracrine and autocrine can cause atrophy
of the RPE and endothelium of the choriocapillaris. The number of fenestrations in the endothelial cells of the
choriocapillaris decreases after intravitreal bevacizumab (Avastin, Genentech Inc., South San Francisco, CA,
USA) injections in primates, and the elimination of VEGF-induced degeneration of the photoreceptors and
choriocapillaris in mice14. Considering these facts, some researchers have pointed out that anti-VEGF adminis-
tration could lead to RPE atrophy14–16. However, the mechanism of RPE atrophy after anti-VEGF therapy is not
well understood. A genetic analysis recently suggested that the polymorphism of the gene encoding complement
factor H (CFH) reduced the response to anti-VEGF t herapy17. An interaction between anti-VEGF therapy and
the complement system may be associated with the ocular tissue damage after anti-VEGF treatment.
The cytokines including VEGF and complement activation products are measurable in the aqueous humor
of eyes with n AMD8,18. Analysis of the aqueous humor can help investigate the interaction between VEGF and
complement systems after intravitreal anti-VEGF injections. The results of previous studies regarding comple-
ment activation in the aqueous humor after anti-VEGF therapy were controversial. Keir et al. reported elevated
C3a after intravitreal bevacizumab injections in small number of patients with n AMD19. Schick et al. reported
that the C3a concentrations in the aqueous humor were not elevated in the patients including undergoing anti-
VEGF treatment8.
To clarify the changes in complement activation products after anti-VEGF therapy in a clinical setting, we
measured the concentrations of C3a, C4a, and proangiogenic cytokines, VEGF, and monocyte chemoattractant
protein-1 (MCP-1) in the aqueous humor at baseline and one months after two monthly intravitreal injections
in eyes with CNV in nAMD, PNV, and PCV. The measured protein levels were compared to the 12-month treat-
ment outcomes of anti-VEGF therapy.
Results
Clinical features. Table 1 shows the demographic and clinical characteristics of patients with CNV and
controls. A total of 102 patients (eyes) (72 patients with CNV and 30 controls) were enrolled. To avoid ambiguity
or confusion, we use the words drusen-associated nAMD to indicate typical nAMD, which is common in Cau-
casian patients. The patients with drusen-associated nAMD were a median age of 73.0 years (interquartile range
[IQR], 68.0–78.0) and the controls were a median age of 69.0 years (IQR 67.0–74.5) (P = 0.118). The proportion
of female patients with CNV (n = 20) was lower than that in the control group (n = 17, P = 0.006). Of the 72 eyes
with CNV, the numbers of eyes with PNV, PCV, and drusen-associated nAMD were 22 (30.6%), 25 (34.7%),
and 25 (34.7%), respectively. There were no significant differences in age (P = 0.054), sex (P = 0.218), logarithm
of the minimum angle of resolution (logMAR) (P = 0.212), axial length (P = 0.902), equivalent spherical power
(P = 0.166), incidence of subretinal fluid (SRF) (P = 0.06), intraretinal fluid (IRF) (P = 0.288), pigmentary abnor-
malities (P = 0.501), greatest linear dimension (GLD) (P = 0.916), CNV lesion size (P = 0.146), and central retinal
thickness (CRT) (P = 0.349) among the three subtypes. The incidence rates of soft drusen and subfoveal choroi-
dal thickness (SFCT) (P < 0.001 for both comparisons) differed among the three subtypes, with the SFCT thicker
in the PNV (P < 0.001) and PCV groups (P = 0.004) than in the drusen-associated nAMD group. There was no
difference in the SFCT between the PNV and PCV (P = 0.385) groups.
Levels of complement activation products and cytokines. No patients had clinically significant
inflammation after intravitreal aflibercept (Eylea, Regeneron Pharmaceutics, Tarrytown, NY, USA) injections
(IAIs) in our series. The median levels of C3a, C4a, VEGF, and MCP-1 in the aqueous humor were 2480 (IQR
1862–3433) pg/mL, 1545 (IQR 1146–1919) pg/mL, 36.68 (IQR 20.90–51.50) pg/mL, and 252.6 (IQR 178.8–
382.8) pg/mL, respectively, in the eyes with CNV, and 1929 (IQR 1374–3010) pg/mL, 1278 (IQR 836–1638) pg/
mL, 23.79 (IQR 16.34–35.11) pg/mL, and 174.8 (IQR 116.1–260.3) pg/mL in the controls at baseline (Table 2).
In the eyes with CNV, one month after two monthly injections, the median C3a levels increased to 3095
(2524–4464) pg/mL at 2 months, and the median C4a levels increased to 1633 (1353–2153) pg/mL (P < 0.001
for both comparisons). While the median VEGF levels decreased to 8.57 (4.31–18.29) pg/mL from 36.68
(20.90–51.50) (P < 0.0001), the VEGF level in 15 of 72 eyes (20.8%) was under the limit of detection (LOD)
2 months after the treatment. No significant differences were seen in the median MCP-1 (P = 0.57) levels between
baseline and 2 months later.
The tendency of VEGF to decrease at 2 months was similar in each subgroup. The C3a level in PNV (P = 0.017)
and drusen-associated nAMD (P < 0.001) increased 2 months after the initial treatment. The MCP-1 level in PCV
(P = 0.023) decreased and drusen-associated nAMD (P = 0.045) increased 2 months after the initial treatment
(Table 3).
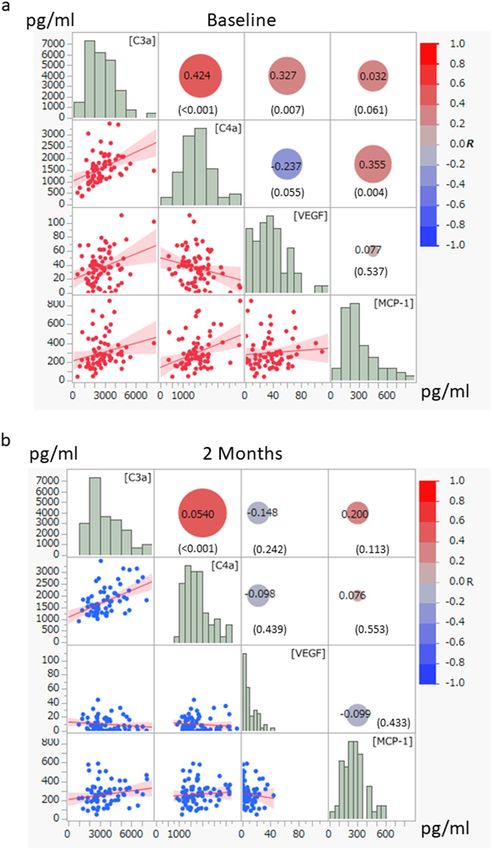
The C3a level was correlated positively with the VEGF level at baseline (R = 0.327, P = 0.007), whereas it was
correlated negatively with the C3a level at 2 months after IAI (R = − 0.148, P = 0.242) (Fig. 1). The C4a level was
correlated negatively with the VEGF level both at baseline (R = − 0.237, P = 0.055) and 2 months (R = − 0.098,
Scientific Reports | (2021) 11:8464 | https://doi.org/10.1038/s41598-021-87340-6 2
Vol:.(1234567890)www.nature.com/scientificreports/
Eyes with CNV (n = 72)
PNV PCV DA nAMD All eyes with CNV Controls
(n = 22) (n = 25) (n = 25) P* (n = 72) (n = 30) P**
Age, median (IQR) 72.0 72.0 77.0 73.0 69.0
0.054 0.118
(year) (63.8–76.3) (66.5–77.5) (69.0–82.0) (68.0–78.0) (67.0–74.5)
4 6 10 20 17
Female, sex, n (%) 0.218 0.006
(18.2) (24.0) (40.0) (27.8) (56.7)
0.22 0.22 0.22 0.22 0.35
LogMAR, median (IQR) 0.212 0.020
(0.05–0.43) (0.10–0.35) (0.15–0.70) (0.10–0.52) (0.22–0.57)
Axial length, median 23.58 23.55 23.51 23.57 24.04
0.902 0.040
(IQR) (D) (23.04–23.88) (22.91–24.25) (22.93–24.21) (22.97–24.18) (23.36–24.38)
Spherical equivalent, 0.50 0.25 − 0.63 0.00 − 0.31
0.166 0.050
median (IQR) (D) (− 0.63 to 2.50) (− 1.44 to 1.31) (− 2.13 to 1.25) (− 1.36 to 1.44) (− 2.47 to 0.25)
CRT, median (IQR) 404 392 422 402
0.349 – –
(μm) (213–551) (271–510) (348–575) (288–548)
SFCT, median (IQR) 344 268 182 260
< 0.001 – –
(μm) (261–415) (191–356) (107–252) (170–358)
GLD, median (IQR) 3.96 3.89 4.55 4.19
0.916 – –
(μm) (2.92–6.29) (3.52–6.05) (2.69–6.58) (3.09–6.24)
CNV size, median (IQR) 1.50 1.06 1.27 1.18
0.146 – –
(mm2) (0.90–4.09) (0.64–1.22) (0.39–2.70) (0.66–2.15)
19 24 18 61
SRF, n (%) 0.060 – –
(86.4) (96.0) (72.0) (84.7)
4 5 9 18
IRF, n (%) 0.288 – –
(18.2) (20.0) (36.0) (25.0)
0 0 16
Soft drusen, n (%) 16 (64.0) < 0.001 – –
(0) (0) (22.2)
Pigmentary abnormal- 12 17 15 44
0.501
ity, n (%) (80.0) (89.5) (75.0) (81.5)
Table 1. Demographics of patients with CNV and controls ar baseline The Kruskal–Wallis test was used for
comparisons between three categories. The Mann–Whitney U test was used for comparisons between all eyes
with CNV patients and controls. nAMD, neovascular age-related macular degeneration; PNV, pachychoroid
neovasculopathy; PCV, polypoidal choroidal vasculopathy; DA nAMD, drusen-associated neovascular age-
related macular degeneration; SD, standard deviation; PVD, posterior vitreous detachment; CRT, central
retinal thickness; SFCT, subfoveal choroidal thickness; GLD, greatest linear dimension; CNV, choroidal
neovascularization; SRF, subretinal fluid; IRF, intraretinal fluid. *The Kruskal–Wallis test was used for analyses
among the nAMD subtypes. **The Mann–Whitney U-test was used for analyses between all nAMD and
controls.
Eyes with CNV (n = 72)
Controls (n = 30) P (Controls vs Baseline) Baseline 2 months P (Baseline vs 2 months)
1929 2480 3095
C3a, median (IQR) (pg/mL) 0.033 < 0.001
(1374–3010) (1862–3433) (2524–4464)
1278 1545 1633
C4a, median (IQR) (pg/mL) 0.021 < 0.001
(836–1638) (1146–1919) (1353–2153)
VEGF, median (IQR) (pg/ 23.79 36.68 8.57
0.016 < 0.001
mL) (16.34–35.11) (20.90–51.50) (4.31–18.29)
MCP1, median (IQR) (pg/ 174.8 252.6 262.4
0.002 0.570
mL) (116.1–260.3) (178.8–382.8) (193.1–331.3)
Table 2. Changes in Levels of complement factors and cytokines in the aqueous humor-patients and controls.
The data were analyzed using the Mann–Whitney U-test; the eyes with CNV and controls, and baseline and
at 2 months. C3a, complement component 3a; C4a, complement component 4a; VEGF, vascular endothelial
growth factor; MCP-1, macrophage chemoattractant protein 1. IQR, interquartile range.
P = 0.439) after treatment. The MCP-1 level was correlated positively with the VEGF level at baseline (R = 0.537,
P = 0.077) and negatively at 2 months (R = − 0.099, P = 0.433). The correlations between the C3a, C4a, MCP-1,
and VEGF levels were analyzed by analysis of covariance. The correlation between the C3a and VEGF levels
differed significantly at baseline and 2 months (P = 0.028) (Fig. 2). The C3a level was especially higher in the
eyes with VEGF under the LOD.
The influence of the C3a level on the outcome of anti-VEGF treatment was analyzed in a limited number of
the patients (37 patients). The C3a levels at baseline and 2 months were not correlated with the changes in the
logMAR VA at 12 months and the number of injections administered over 12 months (Table 4). Dry maculas
(defined as those with no SRF, IRF, or hemorrhages) were achieved at 12 months in 22 (59%) of 37 eyes. The
Scientific Reports | (2021) 11:8464 | https://doi.org/10.1038/s41598-021-87340-6 3
Vol.:(0123456789)www.nature.com/scientificreports/
Analyte PNV (n = 22) PCV (n = 25) DA nAMD (n = 25)
median
(IQR) (pg/
mL) Baseline 2 months P Baseline 2 months P Baseline 2 months P
2059 3406 2668 3084 2539 3047
C3a 0.017 0.187 < 0.001
(1853–3171) (2194–4760) (1886–3932) (2701–4956) (1811–3319) (2453–3748)
1518 1683 1601 1762 1503 1594
C4a 0.003 0.804 < 0.001
(971–2066) (1494–1889) (1192–2133) (1252–2546) (1147–1832) (1231–2184)
35.67 08.39 38.73 12.90 36.07 6.96
VEGF < 0.001 < 0.001 0.011
(25.03–47.27) (6.34–16.32) (20.47–65.93) (04.31–22.44) (18.45–52.21) (4.06–17.61)
223.8 203.0 314.2 265.1 266.6 289.1
MCP1 0.649 0.023 0.045
(131.1–386.8) (117.3–315.8) (231.4–476.9) (192.9–327.9) (179.1–291.4) (226.1–344.1)
Table 3. Changes in Levels of complement factors and cytokines in the aqueous humor of patients with
CNV. Changes in levels of complement factors and cytokines in the aqueous humor of eyes with choroidal
neovascularization (CNV). Wilcoxon signed rank test was used for comparisons between baseline and
2 months. nAMD, neovascular age-related macular degeneration; PNV, pachychoroid neovasculopathy;
PCV, polypoidal choroidal vasculopathy; DA nAMD, drusen associated neovascular age-related macular
degeneration; IQR, interquartile range; C3a, complement component 3a; C4a, complement component 4a;
VEGF, vascular endothelial growth factor; MCP-1, macrophage chemoattractant protein 1. The Mann–
Whitney U-test was used for analysis between baseline and 2 months.
median C3a levels in the eyes with dry maculas at 12 months were 2654 pg/mL (IQR 2167–3338, P = 0.687) at
baseline and 2727 pg/mL at 2 months (IQR 2332–3144; P = 0.621).
Methods
Patients. This prospective observational study adhered to the tenets of the Declaration of Helsinki. The
Institutional Review Board of Fukushima Medical University approved this research before patient enrollment
began at the Department of Ophthalmology, Fukushima Medical University Hospital, Fukushima City, Japan.
All patients provided informed consent before enrollment.
Seventy-two treatment-naïve eyes of patients over 50 years old and age-matched 30 eyes were included. All
patients underwent comprehensive ophthalmic examinations; slit-lamp biomicroscopy with non-contact fundus
lens, and funduscopy. Color fundus photographs and fluorescein angiography (FA) were obtained using a fundus
camera TRC-DX™ (Topcon, Tokyo, Japan). Fundus autofluorescence and indocyanine green angiography (ICGA)
images were obtained using the HRA2™ (Heidelberg Engineering, Heidelberg, Germany). Optical coherence
tomography (OCT) (Spectralis™, Heidelberg Engineering) and OCT angiography (PLEX Elite 9000™, Carl Zeiss
Meditec, Inc., Dublin, CA, USA) also were performed.
Seventy-two eyes of elderly patients with CNV included PNV and PCV. The differences in the pathogenesis
among PNV, PCV, and typical nAMD, namely drusen-associated nAMD, continue to be discussed. However,
the clinical features of CNV in elderly persons are common characteristics in three categories. We used drusen-
associated nAMD to indicate typical nAMD, the clinical features of which were defined as nAMD characterized
by soft drusen exceeding 63 microns or a total area exceeding a 125-μm circle20 in the treated eyes or contralateral
eyes, excluding PNV, PCV, and retinal angiomatous proliferation. The diagnoses of PNV and PCV were made
based on previous r eports3,21,22. The diagnostic criteria for PNV were type 1 CNV detected in one or both eyes;
no or non-extensive drusen (total area ≤ 125-μm circle), or hard drusen (≤ 63 μm) in both eyes (Age-Related
Eye Disease S tudy20: category 1, no AMD), choroidal vascular hyperpermeability detected on late-phase ICGA
images; dilated choroidal vessels below type 1 CNV detected by ICGA and OCT; and the presence of central
serous chorioretinopathy or pachychoroid pigment epitheliopathy-related RPE abnormalities independent of
CNV lesions detected by fundus autofluorescence or a history of central serous chorioretinopathy. PCV was
diagnosed in the presence of a branching vascular network with terminal aneurysmal dilatations on ICGA images
corresponding to a steep RPE elevation seen on OCT images. Other characteristics on the OCT, FA, and ICGA
images were the same as PCV. The exclusion criteria were eyes with a history of any other retinal diseases; uveitis;
glaucoma including ocular hypertension with any antiglaucoma eye drops; any intraocular surgery including
cataract surgery; or high myopia (spherical equivalent 26.5 mm), or eyes hav-
ing received intravitreal anti-VEGF injections in the past; and patients with any systemic diseases potentially
involved in complement system activation, such as diabetes, autoimmune diseases, cancer, cardiovascular disease,
cerebrovascular disease, or systemic corticosteroid medications. The aqueous humor of patients with cataracts
without drusen or retinal disease on funduscopy and OCT was measured as the control group.
Image analysis. Soft drusen and pigmentary abnormalities were evaluated using color fundus photographs.
Soft drusen were graded based on the simplified severity scale for AMD from the Age-Related Eye Disease
Study20. The CRT, SRF, IRF, and SFCT were evaluated on OCT images. The CRT and SFCT were measured using
the caliper function of the Spectralis™. The CRT was defined as the distance between the surface of the RPE and
that of the internal limiting membrane. SFCT was defined as the distance between the hyperreflective line cor-
responding to the Bruch’s membrane beneath the RPE and the chorioscleral border. The diagnosis of polypoidal
lesions was confirmed by the presence of dilated polyps at the end of the branching vascular network on ICGA
Scientific Reports | (2021) 11:8464 | https://doi.org/10.1038/s41598-021-87340-6 4
Vol:.(1234567890)www.nature.com/scientificreports/
Figure 1. The correlation among complement factors and cytokines in the aqueous humor of eyes with
choroidal neovascularization (CNV). Pearson’s correlation analysis was used. C3a, complement component
3a; C4a, complement component 4a; VEGF, vascular endothelial growth factor; MCP-1, macrophage
chemoattractant protein 1. R, correlation coefficient. The scale of the axis is adjusted in the same range between
(a) and (b). the sizes of the circles indicate the magnitude of the correlation; red circle, positive correlation; blue
circle, negative correlation. Number in parenthesis indicates the P value of R.
images. Choroidal vascular hyperpermeability was defined as multifocal hyperfluorescence in the middle and
late phases of ICGA3. The GLD was measured manually using a tool in the software of the Topcon ImageNet
system as the lesion dimension covering the CNV area, including the areas of dye leakage, pigment epithelial
Scientific Reports | (2021) 11:8464 | https://doi.org/10.1038/s41598-021-87340-6 5
Vol.:(0123456789)www.nature.com/scientificreports/
Figure 2. Analyses of covariance. Red dot: baseline. Blue dot: 2 months. The correlation between VEGF and
C3a levels (a) is statistically different between baseline and 2 months (P = 0.028). There was no difference in C4a
(b) and MCP-1 levels (c).
C3a at baseline C3a at 2 months
Analyte P value P value
logMAR change rs = − 0.0744 0.662 rs = − 0.2006 0.234
Number of injections rs = 0.0806 0.635 rs = 0.0864 0.611
Dry macula (22 of 37 eyes) median (IQR) 2654 pg/mL (2167–3338) 0.687 2727 pg/mL (2332–3144) 0.621
Table 4. C3a and treatment outcomes at twelve months. rs: correlation of Spearman’s analysis. C3a,
complement component 3a; VEGF, vascular endothelial growth factor.
detachment, and subretinal hemorrhage on FA. The CNV lesion size was calculated manually in each early
ICGA image using the draw lesion tool in the Image explorer attached to the HRA2.
Treatment regimen. All patients initially received a monthly IAI (2 mg) injection three times as a loading
dose at the beginning of the treatment and 1 and 2 months later; IAI was administered based on a treat-and-
extend regimen. In that regimen, IAI prolonged the administration interval by 1 month if there were no exuda-
Scientific Reports | (2021) 11:8464 | https://doi.org/10.1038/s41598-021-87340-6 6
Vol:.(1234567890)www.nature.com/scientificreports/
tive changes or hemorrhage in the macula, and shortened the injection interval by 1 month if a subretinal hem-
orrhage, retinal edema, or serous retinal detachment was present. The maximal dosing interval was 3 months.
Aqueous humor collection. Aqueous humor was aspirated before IAI and cataract surgery under topical
anesthesia using a syringe with a 30-gauge needle (Nipro, Osaka, Japan) by the same procedure. The aqueous
humor samples were immediately mixed with 2 μL of protease inhibitor cocktail (Sigma, St. Louis, MO, USA) to
prevent complement and anaphylatoxin activation. Aliquots of the obtained aqueous humor samples were stored
at − 80 °C until analysis.
Measurements of complement activation products and cytokines levels. The levels of comple-
ment activation products (C3a and C4a) in the aqueous humor were measured using an Human Anaphylatoxin
Kit (BD Biosciences, Franklin Lakes, NJ, USA). The levels of cytokines (VEGF and MCP-1) in the aqueous
humor were measured using a Human Soluble Protein Master Buffer Kit (BD Biosciences). The bead-based
immunoassay was performed according to the manufacturer’s instructions.
Statistical analysis. The Mann–Whitney U-test was used to compare the levels of complement activation
products and cytokines in the aqueous humor between the groups. The Kruskal–Wallis test was used to compare
the levels of anaphylatoxins and cytokines in the aqueous humor among the three CNV subtypes. Post-hoc
analysis was performed by Steel–Dwass analysis. The differences in the cytokine and C3a and C4a levels between
baseline and 2 months were calculated using the Wilcoxon signed-rank test. The Pearson correlation coefficient
was used to evaluate the correlation between each measurement. The evaluation of the linear regression in two
groups was performed by analysis of covariance. When we evaluated the correlation between the VEGF level
after anti-VEGF treatment and another measurement, the VEGF level under the LOD was substituted by the
minimal value of the VEGF. The correlation between the C3a levels, logMAR changes, and number of injections
was analyzed by Spearman’s rank correlation analysis. Statistical analyses were performed using JMP software
(SAS Institute Inc, Cary, NC, USA). P < 0.05 was considered statistically significant.
Discussion
We measured the changes in the complement activation products and cytokines in the aqueous humor of eyes
with drusen-associated nAMD, PNV, and PCV during anti-VEGF therapy. The VEGF level decreased signifi-
cantly, while the C3a level increased at 2 months after the initial anti-VEGF injections. The tendency of C3a to
increase and for VEGF to decrease at 2 months was similar in each CNV category. The correlations between the
C3a and VEGF levels differed at baseline and 2 months. The activation of the complement system after anti-VEGF
therapy did not change the clinical outcome of the eyes with CNV for 1 year.
Anti-VEGF therapy is a remarkable advancement in nAMD treatment and has become a current therapeutic
standard. The decade of experience with anti-VEGF therapy for nAMD has shed light on the undesirable conse-
quences of this therapy. Long-term treatment can reduce response to anti-VEGF d rugs23,24 and RPE a trophy15,16.
The mechanism of ocular tissue damage by anti-VEGF therapy has not been elucidated. Inflammation after
anti-VEGF therapy was suggested as a causative factor of the tissue d amage25,26.
The current study showed that the C3a level increased at 2 months after anti-VEGF treatment, while the VEGF
levels decreased significantly. These results were consistent with a previous study. Keir et al. reported that C3a
was elevated in the aqueous humor 48 h after intravitreal bevacizumab injections in 10 patients with n AMD19.
The investigators found that CFH decreased after anti-VEGF treatment in an experimental study. The authors
hypothesized that increasing the vulnerability of complement activation by decreasing CFH after anti-VEGF
injection may increase the C3a level. We found that the C3a elevation continued for 1 month after anti-VEGF
injection in the clinical setting. However, there is still room for discussion because the positive correlation
between the C3a and VEGF levels changed after anti-VEGF treatment. We should consider two possibilities. One
is that C3a generation is, indeed, not controlled by VEGF. Another possibility is that residual anti-VEGF drugs
that combine with VEGF could mask the VEGF elevation. Therefore, this possibility implies VEGF involvement
in C3a generation. The interaction between the complement system and VEGF warrants further investigation.
A difference in the pathophysiology between PNV and drusen-associated nAMD was suggested. A hypoxia-
driven mechanism in PNV was postulated from an OCT angiography s tudy27. However, the correlation between
VEGF and C3a after anti-VEGF therapy was similar among PNV, PCV, and drusen-associated nAMD. The
changes after anti-VEGF injection may be common regardless of the pathophysiology of the neovascularization.
Elevated C3a can damage the choroidal vasculature. A recent study reported that the choriocapillaris expresses
the cell cycle gene that responds to complement activation and induces apoptosis of endothelial cells28.The
expression of this gene was examined along the choroidal vessel tree. The endothelial cells of the choriocapillaris
from patients with nAMD specifically expressed this gene compared to arterial and venous endothelial cells. If
the endothelial cells of the choriocapillaris are exposed to complement activation products by repeated treat-
ments with anti-VEGF drugs, the function and number of endothelial cells may decrease, causing circulatory
insufficiency of the choriocapillaris and RPE atrophy. Interestingly, Sakamoto et al.26 reported that only matrix
metalloproteinase-9 (MMP9) was the cytokine that increased after anti-VEGF injections among several cytokines
2 months after anti-VEGF injections. MMP9 reportedly increases when the endothelial cells are damaged by the
membrane attack comples29, indicating complement-induced cell injury. Together with increasing intraocular
C3a, the vascular endothelial cells may be damaged by the complement system after anti-VEGF injections.
The choroidal thickness decreases as a result of IAI with a treat-and-extend regimen for nAMD, especially in
PNV and PCV30. Thus far, the choroid might become thinner as a result of anti-VEGF treatment during recovery
of the choroidal vasculature from the pathologic changes in nAMD. However, we reported that the tendency
Scientific Reports | (2021) 11:8464 | https://doi.org/10.1038/s41598-021-87340-6 7
Vol.:(0123456789)www.nature.com/scientificreports/
for the choroid to become thin did not stop during 3 years of anti-VEGF therapy31. The VEGF levels after the
treatment reportedly decreased below the lower limit of the quantification for about 3 months m aximally32. The
long-term complement dysregulation by low VEGF may affect the choroidal vasculature resulting in long-lasting
choroidal thinning after the treatment.
The C4a level was higher in the eyes with CNV and elevated after anti-VEGF therapy in our study. The
activation of the classical or lectin pathways in nAMD was reported previously33. Regarding C4a elevation after
the injection, aflibercept is potentially associated with the activation in the classical pathway. Bevacizumab is a
humanized monoclonal IgG1 antibody which potentially causes intraocular inflammation after the i njection34.
IgG1 antibody is composed of Fab and Fc domain. The classical pathway was reportedly activated by the Fc
portion of the antibody35. Aflibercept is a recombinant fusion glycoprotein comprised of the second immuno-
globulin-like C2 domain of human VEGF receptor (VEGFR) 1, the third Ig-like C2 domain of human VEGFR
2, and the Fc domain of human IgG1. Degraded aflibercept could be associated with the increase in C4a after
the injection.
Noninfectious inflammation was reported after anti-VEGF i njections34. Although the incidence was very low,
most anti-VEGF agents have caused inflammation after intravitreal i njections36–38. Complement dysregulation
may be a predisposing factor after the anti-VEGF treatment.
The complement system activation after anti-VEGF therapy may affect the clinical outcomes of anti-VEGF
therapy. We did not find a significant difference between the elevation of C3a after anti-VEGF treatment and
the logMAR changes, achievement of dry maculas, and the number of injections for 12 months after treatment.
These undesirable responses could not reflect clinical outcomes since VEGF production may recover at some
time regardless of whether it is pathologic or not. However, long-term unnecessary complement activation by
anti-VEGF therapy can reduce the efficacy of anti-VEGF d rugs23 or induce tissue damage by local depletion of
15,16
VEGF . Consideration should be given to overtreatment when choosing the treatment regimen to avoid the
undesirable consequences of anti-VEGF therapy.
The current study had a few limitations First, there may be a selection bias regarding patients because this
study was performed in one institution. Second, the consistency of the PNV diagnosis was insufficient because
the criteria are not established. The diagnosis of PNV was based on previous r eports3,21,39. Third, the VEGF con-
centration after anti-VEGF drugs may have been underestimated, as suggested by Takahashi et al.40. Although
the measured value of the VEGF concentration itself may be low, its correlation with C3a can be evaluated.
Fourth, C5a was not evaluated because the measurements of C5a in the aqueous humor were out of range in
some samples and should be evaluated in another study. Fifth, we recruited the eyes with cataract as controls, and
these eyes could be associated with intraocular inflammation. However, it is ethically difficult to collect aqueous
humor from completely healthy eyes. The healthy eyes without cataracts should be examined in a future study.
Although this study suggested the interaction between VEGF and the complement system, we could not fully
elucidate the mechanism of the interaction. Further studies are needed.
In conclusion, we demonstrated dysregulation of the complement system following anti-VEGF therapy for
nAMD. Physicians should consider treatment regimens to avoid overtreatment during prophylactic or intensi-
fied treatment for nAMD.
Received: 24 November 2020; Accepted: 24 March 2021
References
1. Congdon, N. et al. Causes and prevalence of visual impairment among adults in the United States. Arch. Ophthalmol. 122, 477–485.
https://doi.org/10.1001/archopht.122.4.477 (2004).
2. Wong, W. L. et al. Global prevalence of age-related macular degeneration and disease burden projection for 2020 and 2040: a
systematic review and meta-analysis. Lancet Glob. Health 2, e106–e116. https://doi.org/10.1016/S2214-109X(13)70145-1 (2014).
3. Cheung, C. M. G. et al. Pachychoroid disease. Eye (London) 33, 14–33. https://doi.org/10.1038/s41433-018-0158-4 (2019).
4. Klein, R. J. et al. Complement factor H polymorphism in age-related macular degeneration. Science 308, 385–389. https://doi.org/
10.1126/science.1109557 (2005).
5. Zhou, J., Jang, Y. P., Kim, S. R. & Sparrow, J. R. Complement activation by photooxidation products of A2E, a lipofuscin constituent
of the retinal pigment epithelium. Proc. Natl. Acad. Sci. USA 103, 16182–16187. https://doi.org/10.1073/pnas.0604255103 (2006).
6. Nozaki, M. et al. Drusen complement components C3a and C5a promote choroidal neovascularization. Proc. Natl. Acad. Sci. USA
103, 2328–2333. https://doi.org/10.1073/pnas.0408835103 (2006).
7. Hugli, T. Biochemistry and Biology of Anaphylatoxins. Complement 3, 111–127. https://doi.org/10.1159/000467889 (1986).
8. Schick, T. et al. Local complement activation in aqueous humor in patients with age-related macular degeneration. Eye (London)
31, 810–813. https://doi.org/10.1038/eye.2016.328 (2017).
9. Maguire, M. G. et al. Five-year outcomes with anti-vascular endothelial growth factor treatment of neovascular age-related macular
degeneration: the comparison of age-related macular degeneration treatments trials. Ophthalmology 123, 1751–1761. https://doi.
org/10.1016/j.ophtha.2016.03.045 (2016).
10. Datta, S., Cano, M., Ebrahimi, K., Wang, L. & Handa, J. T. The impact of oxidative stress and inflammation on RPE degeneration
in non-neovascular AMD. Prog. Retin. Eye Res. 60, 201–218. https://doi.org/10.1016/j.preteyeres.2017.03.002 (2017).
11. Starita, C., Hussain, A. A., Pagliarini, S. & Marshall, J. Hydrodynamics of ageing Bruch’s membrane: implications for macular
disease. Exp. Eye Res. 62, 565–572. https://doi.org/10.1006/exer.1996.0066 (1996).
12. Sohn, E. H. et al. Choriocapillaris degeneration in geographic atrophy. Am. J. Pathol. 189, 1473–1480. https://doi.org/10.1016/j.
ajpath.2019.04.005 (2019).
13. Paraoan, L. et al. Secretory proteostasis of the retinal pigmented epithelium: impairment links to age-related macular degeneration.
Prog. Retin Eye Res. https://doi.org/10.1016/j.preteyeres.2020.100859 (2020).
14. Kurihara, T., Westenskow, P. D., Bravo, S., Aguilar, E. & Friedlander, M. Targeted deletion of Vegfa in adult mice induces vision
loss. J. Clin. Invest. 122, 4213–4217. https://doi.org/10.1172/JCI65157 (2012).
15. Xu, L. et al. Geographic atrophy in patients receiving anti-vascular endothelial growth factor for neovascular age-related macular
degeneration. Retina 35, 176–186. https://doi.org/10.1097/iae.0000000000000374 (2015).
Scientific Reports | (2021) 11:8464 | https://doi.org/10.1038/s41598-021-87340-6 8
Vol:.(1234567890)www.nature.com/scientificreports/
16. Young, M. et al. Exacerbation of choroidal and retinal pigment epithelial atrophy after anti-vascular endothelial growth factor
treatment in neovascular age-related macular degeneration. Retina 34, 1308–1315. https://doi.org/10.1097/iae.0000000000000081
(2014).
17. Chen, G. et al. Pharmacogenetics of complement factor H Y402H polymorphism and treatment of neovascular AMD with anti-
VEGF agents: a meta-analysis. Sci. Rep. 5, 14517. https://doi.org/10.1038/srep14517 (2015).
18. Sato, T., Takeuchi, M., Karasawa, Y., Takayama, K. & Enoki, T. Comprehensive expression patterns of inflammatory cytokines in
aqueous humor of patients with neovascular age-related macular degeneration. Sci. Rep. 9, 19447. https://doi.org/1 0.1038/s41598-
019-55191-x (2019).
19. Keir, L. S. et al. VEGF regulates local inhibitory complement proteins in the eye and kidney. J. Clin. Invest. 127, 199–214. https://
doi.org/10.1172/jci86418 (2017).
20. Ferris, F. L. et al. A simplified severity scale for age-related macular degeneration: AREDS Report No. 18. Arch. Ophthalmol. 123,
1570–1574. https://doi.org/10.1001/archopht.123.11.1570 (2005).
21. Pang, C. E. & Freund, K. B. Pachychoroid neovasculopathy. Retina 35, 1–9. https://doi.org/10.1097/iae.0000000000000331 (2015).
22. Terao, N. et al. Distinct aqueous humour cytokine profiles of patients with pachychoroid neovasculopathy and neovascular age-
related macular degeneration. Sci. Rep. 8, 10520. https://doi.org/10.1038/s41598-018-28484-w (2018).
23. Hara, C. et al. Tachyphylaxis during treatment of exudative age-related macular degeneration with aflibercept. Graefes Arch. Clin.
Exp. Ophthalmol. 257, 2559–2569. https://doi.org/10.1007/s00417-019-04456-2 (2019).
24. Koike, N. et al. Results of switchback from ranibizumab to aflibercept in patients with exudative age-related macular degeneration.
Clin. Ophthalmol. 13, 1247–1251. https://doi.org/10.2147/opth.S206910 (2019).
25. Luo, C., Chen, M. & Xu, H. Complement gene expression and regulation in mouse retina and retinal pigment epithelium/choroid.
Mol. Vis. 17, 1588–1597 (2011).
26. Sakamoto, S. et al. Changes in multiple cytokine concentrations in the aqueous humour of neovascular age-related macular degen-
eration after 2 months of ranibizumab therapy. Br. J. Ophthalmol. 102, 448–454. https://d oi.o
rg/1 0.1 136/b
jopht halmo
l-2 017-3 10284
(2018).
27. Dansingani, K. K., Balaratnasingam, C., Klufas, M. A., Sarraf, D. & Freund, K. B. Optical coherence tomography angiography of
shallow irregular pigment epithelial detachments in pachychoroid spectrum disease. Am. J. Ophthalmol. 160, 1243-1254.e1242.
https://doi.org/10.1016/j.ajo.2015.08.028 (2015).
28. Voigt, A. P. et al. Single-cell transcriptomics of the human retinal pigment epithelium and choroid in health and macular degenera-
tion. Proc. Natl. Acad. Sci. USA 116, 24100–24107. https://doi.org/10.1073/pnas.1914143116 (2019).
29. Zeng, S. et al. Molecular response of chorioretinal endothelial cells to complement injury: implications for macular degeneration.
J. Pathol. 238, 446–456. https://doi.org/10.1002/path.4669 (2016).
30. Maruko, I. et al. Two-year outcomes of treat-and-extend intravitreal aflibercept for exudative age-related macular degeneration:
A prospective study. Ophthalmol. Retina 4, 767–776. https://doi.org/10.1016/j.oret.2020.03.010 (2020).
31. Itagaki, K. et al. Three-year outcome of aflibercept treatment for Japanese patients with neovascular age-related macular degenera-
tion. BMC Ophthalmol. 20, 276. https://doi.org/10.1186/s12886-020-01542-6 (2020).
32. Fauser, S., Schwabecker, V. & Muether, P. S. Suppression of intraocular vascular endothelial growth factor during aflibercept treat-
ment of age-related macular degeneration. Am. J. Ophthalmol. 158, 532–536. https://doi.org/10.1016/j.ajo.2014.05.025 (2014).
33. Omori, T. et al. Evidence for activation of lectin and classical pathway complement components in aqueous humor of neovascular
age-related macular degeneration. Ophthalmic Res. 63, 252–258. https://doi.org/10.1159/000503258 (2019).
34. Williams, P. D., Chong, D., Fuller, T. & Callanan, D. Noninfectious vitritis after intravitreal injection of anti-vegf agents: variations
in rates and presentation by medication. Retina 36, 909–913. https://doi.org/10.1097/iae.0000000000000801 (2016).
35. Vignesh, P., Rawat, A., Sharma, M. & Singh, S. Complement in autoimmune diseases. Clin. Chim Acta 465, 123–130. https://doi.
org/10.1016/j.cca.2016.12.017 (2017).
36. Baumal, C. R. et al. Retinal vasculitis and intraocular inflammation after intravitreal injection of brolucizumab. Ophthalmology
https://doi.org/10.1016/j.ophtha.2020.04.017 (2020).
37. Greenberg, J. P. et al. Aflibercept-related sterile intraocular inflammation outcomes. Ophthalmol. Retina 3, 753–759. https://doi.
org/10.1016/j.oret.2019.04.006 (2019).
38. Kunimoto, D. et al. Evaluation of abicipar pegol (an Anti-VEGF DARPin therapeutic) in patients with neovascular age-related
macular degeneration: studies in Japan and the United States. Ophthal. Surg. Lasers Imaging Retina 50, e10–e22. https://doi.org/
10.3928/23258160-20190129-13 (2019).
39. Yanagi, Y. Pachychoroid disease: A new perspective on exudative maculopathy. Jpn. J. Ophthalmol. 64, 323–337. https://doi.org/
10.1007/s10384-020-00740-5 (2020).
40. Takahashi, H. et al. Vascular endothelial growth factor (VEGF) concentration is underestimated by enzyme-linked immunosorbent
assay in the presence of anti-VEGF drugs. Invest. Ophthalmol. Vis. Sci. 57, 462–466. https://doi.org/10.1167/iovs.15-18245 (2016).
Acknowledgements
JSPS KAKENHI Grant Number JP17K11427 supported this work.
Author contributions
Contributions were as follows: K.T., Y.O., T.S., and H.S, conception and design; K.T., Y.O., T.O., Y.I., H.S., R.T.,
A.K., M.O, Y.S., K.I, A.O. collection and assembly of data; K.T., Y.O., and T.S.; data analysis and interpretation;
and K.T., T.S., T.O., T.M.; writing manuscript text and preparing figures. All authors reviewed the manuscript.
Competing interests
The authors declare no competing interests.
Additional information
Correspondence and requests for materials should be addressed to T.S.
Reprints and permissions information is available at www.nature.com/reprints.
Publisher’s note Springer Nature remains neutral with regard to jurisdictional claims in published maps and
institutional affiliations.
Scientific Reports | (2021) 11:8464 | https://doi.org/10.1038/s41598-021-87340-6 9
Vol.:(0123456789)www.nature.com/scientificreports/
Open Access This article is licensed under a Creative Commons Attribution 4.0 International
License, which permits use, sharing, adaptation, distribution and reproduction in any medium or
format, as long as you give appropriate credit to the original author(s) and the source, provide a link to the
Creative Commons licence, and indicate if changes were made. The images or other third party material in this
article are included in the article’s Creative Commons licence, unless indicated otherwise in a credit line to the
material. If material is not included in the article’s Creative Commons licence and your intended use is not
permitted by statutory regulation or exceeds the permitted use, you will need to obtain permission directly from
the copyright holder. To view a copy of this licence, visit http://creativecommons.org/licenses/by/4.0/.
© The Author(s) 2021
Scientific Reports | (2021) 11:8464 | https://doi.org/10.1038/s41598-021-87340-6 10
Vol:.(1234567890)You can also read