Changing patterns of shark attacks in Australian waters
←
→
Page content transcription
If your browser does not render page correctly, please read the page content below
CSIRO PUBLISHING

Marine and Freshwater Research, 2011, 62, 744–754                                                         www.publish.csiro.au/journals/mfr

      Changing patterns of shark attacks in Australian waters

      John G. West

      Coordinator, Australian Shark Attack File, Taronga Conservation Society Australia, PO Box 20,
      Mosman, NSW 2088, Australia. Email: jwest@zoo.nsw.gov.au

      Abstract. Although infrequent, shark attacks attract a high level of public and media interest, and often have serious
      consequences for those attacked. Data from the Australian Shark Attack File were examined to determine trends in
      unprovoked shark attacks since 1900, particularly over the past two decades. The way people use the ocean has changed
      over time. The rise in Australian shark attacks, from an average of 6.5 incidents per year in 1990–2000, to 15 incidents per
      year over the past decade, coincides with an increasing human population, more people visiting beaches, a rise in the
      popularity of water-based fitness and recreational activities and people accessing previously isolated coastal areas. There
      is no evidence of increasing shark numbers that would influence the rise of attacks in Australian waters. The risk of a
      fatality from shark attack in Australia remains low, with an average of 1.1 fatalities year1 over the past 20 years. The
      increase in shark attacks over the past two decades is consistent with international statistics of shark attacks increasing
      annually because of the greater numbers of people in the water.

      Additional keywords: beach recreation, bull shark, marine, ocean swimming, shark biology, swimmer safety, tiger
      shark, whaler, white shark, wobbegong.

Introduction                                                             Materials and methods
Sharks are large top-order marine predators and some species             The ASAF is held at Taronga Zoo (Taronga Conservation Society
occur in areas of the ocean where human activities occur.                Australia), Sydney, and is affiliated with the International Shark
Although shark attacks occur relatively infrequently, they often         Attack File (ISAF). Initially, Australian shark-attack data were
have serious consequences for those involved, invoke a dramatic          compiled from a variety of sources, including Coppleson (1933,
emotional response from the public and therefore attract a high          1958), Whitley (1940, 1951) and Baldridge (1969, 1974). The
level of media interest. Given that Australia is well known for          ASAF is a dynamic database that is continually researched and
its beach culture, with ,35 000 km of coast, containing an               is subject to change as new incidents occur or new information
estimated 11 900 beaches (SLSA 2010), has a mostly favourable            becomes available on previously recorded incidents.
climate, and a range of popular beach- and water-related                     The ASAF relies on a network of contacts throughout
activities, it is not surprising that it has a relatively high rate of   Australia, including shark researchers, scientists and managers
shark attack (West 1993). Globally, the numbers of shark attacks         in all Australian State Fisheries Departments, researchers at
have been increasing and this has been attributed to the increase        Commonwealth Scientific and Industrial Research Organisation
in the human population and more people entering the water               (CSIRO), museum curators, university researchers, surf life-
(Burgess 2009).                                                          saving organisations, underwater naturalists and film makers
    Records of shark attacks in Australia have been kept since           who assist in obtaining incident reports. Information also comes
the early days of settlement (first attack was recorded in 1791),        from a range of sources including print media and internet news
although the quality and completeness of reports in the earlier          service, State and National Library searches, on-line archival
years are variable. In an effort to standardise reporting of             newspaper databases, official investigation reports, coronial and
shark attacks in Australia, the Australian Shark Attack File             police reports, surf life-saving report logs and personal commi-
(ASAF) was developed in 1984. A report on attacks up to 1990             nication. The most reliable sources of detail come from direct
suggested that unprovoked shark attacks per decade had                   personal communication with victims or witnesses who are sent a
slowly declined and remained relatively stable after shark-              questionnaire, and visits at the hospital by investigating authori-
management practices were introduced around Sydney in the                ties where an inspection of the bite wound can be undertaken.
1930s (West 1993). The present paper describes the patterns
of shark attacks in Australian waters, examines how this has
changed over time, identifies factors that may help reduce the           Australian Shark Attack File database
incidence of attacks, and contributes to our understanding of            There are 101 fields of information for each incident, including
shark behaviour.                                                         details on the victim, the victim’s activities, witnesses’

Ó CSIRO 2011                                                                                  10.1071/MF10181         1323-1650/11/060744
Shark attacks in Australia Marine and Freshwater Research 745
activities, injuries sustained, recovery outcome and diversionary where flesh was removed (including limbs bitten off) and
action by the victim or others. It contains biological information surgery and/or a long period of hospitalisation was required.
on the shark, its description, size and behaviour, and any other Fatalities can be recorded for Serious and Severe classifications
animals nearby. Environmental parameters such as water depth, following sanguination or post-surgical complications and for
temperature and site description are recorded where known. The events where the body was not recovered and it is suspected that
database includes shark attacks recorded in Australian waters, the shark has taken the victim away from the attack site or the
including the Torres Strait Islands and Cocos, Christmas body was consumed.
and Lord Howe Islands, and generally within Australia’s 200-
nautical-mile Economic Exclusion Zone (EEZ). Beach visitations
In the absence of definitive beach-visitation numbers, and for
Criteria for inclusion
the purpose of the present study, a conservative figure of a 20%
A ‘shark attack’ is defined in the ASAF as any human–shark annual increase was assumed as a surrogate for assessing the
interaction where either a shark (not in captivity) makes a probable increase in beach visitations and water-related activi-
determined attempt to attack a person who is alive and in the ties over the past decade. This figure is derived from an average
water or the shark attacks equipment held by the victim or of the Australian population increase of 15% and an increase in
attacks a small-water craft containing the victim (the full criteria surf life-saver beach rescues of 29% over the past decade.
can be found at www.zoo.org.au, accessed 1 June 2010).
Incidents classified as ‘provoked’ are not included in the Results
present paper. The provoked category relates to circumstances
where the person involved was fishing for, spearing, stabbing, Over the 218 years for which records were available, there have
feeding, netting or handling a shark, or where the shark was been 592 recorded unprovoked incidents in Australian waters,
attracted to the victim by activities such as fishing, spear-fishing comprising 178 fatalities, 322 injuries and 92 incidents where no
and cleaning of captured fish. injury occurred. Most of these attacks have occurred since 1900,
with 540 recorded unprovoked attacks, including 153 fatalities,
302 injuries and 85 incidents where no injury occurred. Attacks
Identification of sharks involved in attacks
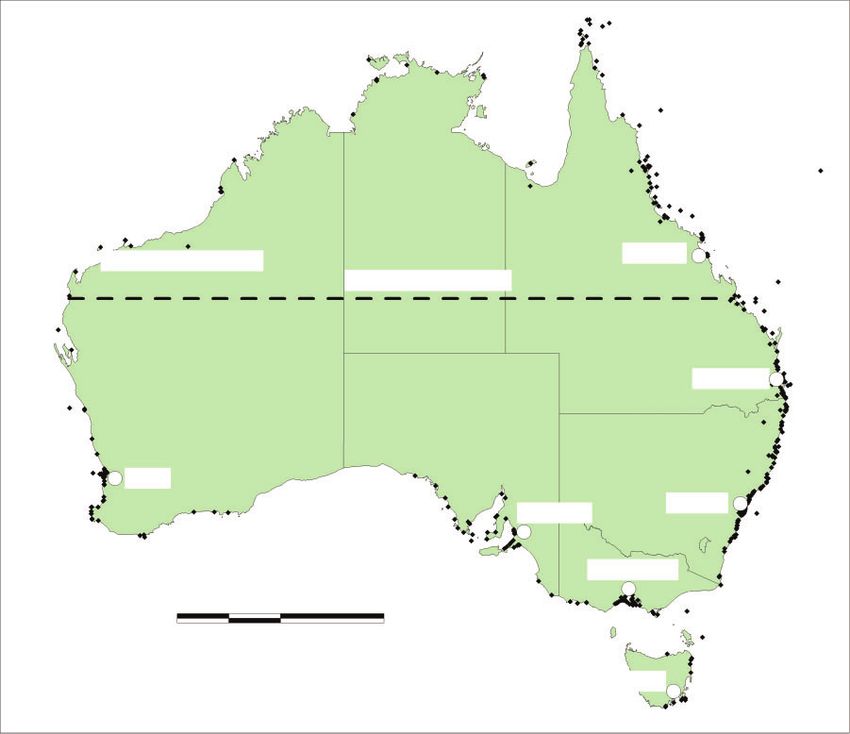
have occurred around most of the Australian coast, most fre-
Where the species of shark cannot be positively identified either quently on the more densely populated eastern coast and near
through direct examination of the bite, identification of the major cities (Fig. 1).
captured shark, forensic assessment of the bite marks, teeth In the first half of the 20th century, there was an increase in
or tooth fragments recovered, or identification by a creditable the number of recorded shark attacks, culminating in a peak in
witness, the ASAF establishes the most likely shark species the 1930s when there were 74 incidents (Fig. 2). The number of
(or family) through a review of the physical and behavioural attacks then dropped, to stabilise ,35 incidents per decade from
description of the shark from victim, witnesses, or other avail- the 1940s to the 1970s. Since 1980, the number of reported
able reports. This is compared with previous incidents from the attacks has increased to 121 incidents in the past decade (Fig. 2).
same or similar locations where the circumstances were similar There had been a decrease in the average annual fatality rate,
and the species had previously been identified. Environmental which had fallen from a peak of 3.4 year1 in the 1930s, to an
parameters, shark-distribution data, location and time of year are average of 1.1 year1 for the past two decades. The number of
also reviewed. Considered opinion from experts in the field of fatal attacks relative to the number of total attacks per decade has
shark research is also sought. The lengths of sharks recorded also decreased over this period, from 45% in the 1930s to 10%
were usually been estimated by the victims or witnesses. There in the past decade. These declining chances of a shark attack
have been 18 incidents where the shark’s size has been identified resulting in fatality are also reported elsewhere in the world
through bite-mark analysis and three incidents verified through (Woolgar et al. 2001; Burgess 2009). In the 20-year period of
capture of the shark involved. the 1930s and 1940s, the fatality ratio was 1 : 2.4 incidents. In
the past 20 years, the fatality ratio has been 1 : 8.5 incidents.
Impacts on victims Comparison of attacks per capita indicated that the number of
Where injuries are recorded, the location is assigned to the incidents was highest in the 1930s, at 10 attacks per million
following: ‘Legs’, including injuries to any part of the foot, calf, people per decade, decreasing to an average of 3.3 attacks per
knee, and thigh; ‘Arm’, including injuries to the fingers, hand, million people per decade until the 1990s. The past two decades
forearm and upper arm; ‘Torso’, including anywhere on the have exhibited an increase in attacks, up to 3.5 attacks per
body such as buttocks, stomach, chest or shoulder; or ‘Head’, million people per decade (1990–1999) and 5.4 attacks per
including anywhere above the shoulders to the top of the head. million people per decade 2000–2009 (Fig. 3).
‘Multiple bites’ relate to two or more bites to different parts of In the 20 years since 1990, there have been 186 reported
the body (e.g. arm and torso). incidents, including 22 fatalities (Table 1). This represents a
The severity of injuries (including fatalities) are classified as 16% increase in reported attacks during 1990–1999 and a 25%
follows: ‘Minor’, where bruising, grazes, teeth marks, scratches increase over the past 10 years (Fig. 3). The majority of attacks
or a small laceration requiring first aid or minor stitches occurred in New South Wales (NSW) with 73 incidents (39%),
occurred; ‘Serious’, where larger lacerations occurred, requiring then Queensland with 43 incidents (23%), Western Australia
extensive stitches, or where small amounts of flesh were (WA) with 35 incidents (19%), South Australia with 20 inci-
removed such that hospitalisation was required; or ‘Severe’, dents (11%), Victoria with 12 incidents (6%), Tasmania with746 Marine and Freshwater Research J. G. West
Mackay
Montebello Islands
Tropic of Capricorn
Brisbane
Perth
Sydney
Adelaide
Melbourne
0 500 1000
Kilometres
Hobart
Fig. 1. The distribution of Australian shark attacks 1791–2009. Each attack is represented by a black dot.
two incidents (1.5%) and Northern Territory with one incident during the previous two decades to 55 incidents, including 15
(0.5%). fatalities, 23 injuries and 17 uninjured incidents, the bull shark
(Carcharhinus leucas), with an increase from three incidents
Species of shark involved in attacks during the previous two decades to 25 incidents, including four
Of the 186 recorded incidents since 1990, there have been fatalities, 15 injuries and six uninjured incidents, and the tiger
57 incidents (30%) where the shark species (or family) was shark (Galeocerdo cuvier), with a decrease from 14 incidents for
identified beyond a reasonable doubt. in 13 incidents (7%), the the previous two decades down to 10 incidents, including three
species was unknown because of insufficient detail to make a fatalities, two injuries and five uninjured incidents (Table 2).
considered assessment. For the remaining 117 incidents (63%), Of the 15 fatalities attributed to white sharks, seven involved
sufficient information was recorded to assign the ‘most likely’ a single bite and seven resulted from multiple bites (unknown
species (or family) involved. number of bites for one fatality). Seven fatal attacks by white
Since 1990, 12 species of shark were identified as responsi- sharks occurred at the surface while the victim was surfing
ble for unprovoked attacks (Table 2). The three species histori- (33%), swimming (7%) or sailboarding (7%). Eight of the
cally considered to represent the biggest threat to humans (the fatalities by white sharks occurred while the victim was sub-
white, tiger and bull shark combined) represent 48% of attacks. merged, either SCUBA diving (40%) or snorkelling (13%). Of
A further 20% of attacks was attributed to unidentified species in the four fatalities attributed to bull sharks, one involved a single
the Carcharhinidae family (designated as ‘whaler sp. Group’) bite and three involved multiple bites. All four fatal incidents
and 20% for the wobbegong shark. occurred at the surface; three while swimming and one while
Only three shark species have been responsible for fatal surfing. Two of the four fatalities occurred in human-made
attacks over the past 20 years. These were the white shark canals. Of the three fatalities attributed to tiger sharks, two
(Carcharodon carcharias), with an increase from 24 incidents involved a single bite. One fatal attack occurred at the surface onShark attacks in Australia Marine and Freshwater Research 747
120
100
80
60
40
20
0
1900–1909
1910–1919
1920–1929
1930–1939
1940–1949
1950–1959
1960–1969
1970–1979
1980–1989
1990–1999
2000–2009
Total attacks per decade Fatalities
% of fatal attacks
Fig. 2. Number of unprovoked shark attacks, number of fatalities and percentage of attacks that were fatal from
1900 to 2009 by decade.
25 140
120
20
100
Pop ⫻ millions
Attack cases
15
80
60
10
40
5
20
0 0
1900–1909
1910–1919
1920–1929
1930–1939
1940–1949
1950–1959
1960–1969
1970–1979
1980–1989
1990–1999
2000–2009
Total attacks per decade Attacks per million people
Population growth
Fig. 3. Decadal distribution of shark attacks in Australia between 1900 and 2009, including total number of
attacks, the total population of Australia and the shark attacks per million people.
a sailboarder and two occurred subsurface on a snorkeler and a injuries), an increase of 20% over the previous decade, and
hookah diver. the whaler sp. group with 37 incidents, including 26 injuries and
Species involved in attacks that did not result in a fatality 11 uninjured incidents. The bronze whaler had six incidents
include the wobbegong with 33 incidents (all resulting in recorded, with four injuries and two uninjured incidents, and the748 Marine and Freshwater Research J. G. West
dusky whaler had two incidents recorded, with one injury and SCUBA or hookah diving, 14 (7%) while snorkelling, 12 (6%)
one uninjured incident. There were five other species with one while standing in shallow water, 15 (8%) on small water craft
incident recorded for each (Table 2). (kayak, ski, dinghy, rowing scull) and four (2%) while kite-
boarding or sailboarding (Fig. 4). By comparison, for the two
Shark size previous decades (1970–1989), there were 83 incidents where
There have been 121 incidents where the length of the shark was the victim’s activity was recorded. During this period, 24 (29%)
recorded. The reported size ranged between 0.4 and 6.0 m. Over occurred while surfing on a board or body board, 25 (30%) while
80% of incidents involved white sharks and tiger sharks .3 m; swimming, 11 (13%) while SCUBA or hookah diving, three
for bull sharks, 78% of incidents involved sharks .2 m, 56% of (4%) while snorkelling, four (5%) while standing in shallow
whalers (sp.) were .2 m, and 72% of wobbegongs exceeded water, and two (2%) in small boats (Table 3). Because of
1 m. Of the 28 incidents where a shark was reported to be .4 m, increased activities occurring in cooler waters all year round,
85% were white sharks (24 incidents), resulting in nine fatali- 49% of all shark-attack victims were wearing a wetsuit.
ties. Large tiger sharks .4 m long were involved in four inci-
dents, with one fatality. Bull sharks .2 m in length were Victim’s injuries
involved in 13 incidents, resulting in four fatalities. There were Of the 186 incidents recorded for the past 20-year period, 117
no fatalities recorded for any species ,2 m. incidents (63%) resulted in an injury to the victim. Fatalities
accounted for 22 incidents (11.8%), which include eight inci-
Activities of victims dents where the body was not recovered (six attributed to a white
The activities of victims (1990–2009) were recorded for 186 shark and two to a tiger shark). The fatality rate is consistent with
incidents, of which 78 (42%) occurred while surfing on a board the International Shark Attack File (ISAF) global fatality rate of
or body board, 38 (21%) while swimming, 25 (14%) while 10.1% for the same period.
Table 1. Number of shark attacks for each state of Australia (1990]2009), including number of fatalities, injuries, or where the person was uninjured
and the location of the last fatality since 1990
State Total no. of cases No of fatal attacks No. of injured No. of uninjured Last fatality (since 1990)
NSW 73 2 45 26 2008, Ballina, Lighthouse Beach
Qld 43 5 32 6 2006, North Stradbroke Island
WA 35 6 23 6 2005, Houtman Abrolhos Islands
SA 20 8 11 1 2005, Glenelg Beach
Vic. 12 0 5 7
Tas. 2 1 1 0 1993, Tenth Is, Georgetown
NT 1 0 0 1
Total 186 22 117 47
Table 2. The total number of unprovoked shark attacks by identified shark species from 1900 to 2009, including the number of fatalities
(in parentheses)
Decadal details are provided post-1970
Species No. of cases (fatal) No. of cases (fatal) No. of cases (fatal) No. of cases (fatal) No. of cases (fatal)
1900–2009 1970–1979 1980–1989 1990–1999 2000–2009
White shark (Carcharodon carcharias) 120 (41) 14 (5) 10 (3) 16 (7) 39 (8)
Bull shark (Carcharhinus leucas) 84 (38) 2 1 10 15 (4)
Tiger shark (Galeocerdo cuvier) 85 (41) 4 (4) 10 (5) 6 (3) 4
Whaler sp. (Carcharhinus sp.) 70 (11) 1 4 (1) 13 24
Wobbegong (Orectolobidae sp.) 51 1 8 9 24
Bronze whaler (C. brachyurus) 13 (1) 1 (1) 3 4 2
Dusky whaler (C. obscurus) 3 – – 1 1
Whitetip reef shark (Triaenodon obesus) 1 – – 1 –
Silvertip reef shark (C. albimarginatus) 1 – – – 1
Grey reef shark (C. amblyrhynchos) 1 – – 1 –
Hammerhead (Genus: Sphyrnidae) 1 – – – 1
Mako (Isurus oxyrinchus) 1 – – – 1
School shark (Galeorhinus galeus) 1 1 – – –
Unknown 108 (21) 14 8 4 9
Total (fatal) 540 (153) 38 (10) 44 (9) 65 (10) 121 (12)Shark attacks in Australia Marine and Freshwater Research 749
Of the 139 injuries and fatalities recorded, there were 85 Of the 186 records, there were 27 incidents (14%) recorded
(61%) that occurred on the legs, 20 (14%) on the arms, 17 (12%) where the victim was bitten by the shark following an initial
bites to the torso and one injury was reported to the head (2%) close pass without contact or a pass with contact (e.g. bump) and
and multiple bites occurred in 16 incidents (12%). There were 47 in 35 incidents (19%) the victim was recorded as being aware of
incidents (25%) where no injury occurred. This concentration on the shark before the attack. In all incidents for the past 20 years, a
the body extremities is to be expected, considering the propen- single shark was recorded as being involved in the attack. In
sity of attacks on surfers and swimmers, whose arms and legs 22 incidents where a person was reported as rescuing a shark-
are most likely to be exposed to the potential attack. Of the attack victim, no injuries were recorded.
139 incidents where injuries or fatality occurred, 107 incidents
(77%) were minor injuries, nine incidents (6%) were serious and Diversionary actions
15 incidents (11%) were severe. In eight incidents (6%), a body
was not recovered. There were 54 incidents where physical diversionary action was
The numbers of bites were recorded in 164 incidents; in 126 taken by the victim to deter the attacking shark. In 50 incidents,
incidents (77%), contact or an attempted bite occurred via a the victim hit, punched, gouged the eye, kicked, pushed or
single bite, resulting in 10 fatalities, 91 injuries and 25 incidents grabbed the shark. On four occasions, the victim pushed a
of attempted bite with no injury occurring. In 38 incidents surfboard (2 occasions), a spear gun, or clipboard into the
(23%), there was a consistent or persistent attempt to bite a shark’s mouth resulting in the shark either swimming away or it
person more than once (multiple bites). Multiple bites resulted in keeping at a distance from the victim. In 36 incidents (67%), the
11 fatalities, 25 injuries and two uninjured incidents (Table 3). shark released the victim, ceased the attack or swam away. In
17 incidents (32%), there was no reported change to the attack
60 behaviour.
50 Temporal patterns
Attacks occurred throughout the year, with most incidents (134,
40 72%) occurring in the warmer months from November to April
(Fig. 5). There were 138 incidents where the time of day was
recorded, over the past 20 years, and ranged from 0130 hours to
30
2030 hours (Fig. 6). The following 5-h periods were identified:
dawn (0300–0800 hours), 22 incidents; morning (0800–1300
20 hours), 44 incidents; afternoon (1300–1800 hours), 55 incidents;
dusk (1800–2300 hours), 16 incidents; and late night (4-h
10 period, 2300–0300 hours), one case occurred. The three main
groups of sharks responsible for the majority of attacks
0
throughout a 24-h period were the white shark, bull shark and the
whaler shark group, which feature in all periods from dawn to
Surfing
Swimming
SCUBA/hookah
Snorkelling
Shallow water
Boat/sailboard
Unknown
dusk (Table 4).
Other animals in the vicinity of attacks
There were 54 records where other animals were observed as
being in the area of the attack. In all cases, no specific identi-
1970–1979 1980–1989 1990–1999 2000–2009 fication to species was made. In some incidents, multiple species
of aquatic animals were recorded. Schools of fish were observed
Fig. 4. Frequency of activities conducted by shark-attack victims when in the immediate area in 32 incidents. Marine mammals were
attacked (1970–2009). recorded for 21 incidents, with 11 involving dolphins (one of
Table 3. The activity of victims, number and type of interaction with the shark and the outcome of the interaction, for attacks from 1990 to 2009
Some incidents may have more than one bite or close-pass behaviours recorded
Activity (total no.)* Single bite Multiple bites Bump/graze Close pass, no contact Fatal Injury No injury
Surfing (79) 47 19 15 18 6 46 27
Swimming (39) 28 10 2 4 4 37 2
SCUBA diving (23) 17 3 2 4 6 13 4
Snorkelling (14) 9 3 2 2 3 9 2
Boat (15) 11 1 1 4 – 2 13
Shallow water (11) 11 – – – – 11 –
Kite/sailboard (4) 2 1 – – 2 2 –
Hookah diving (3) 2 – – 1 1 1 1750 Marine and Freshwater Research J. G. West
30
25
20
Cases
15
10
5
0
Jan (15%)
Feb (14.5%)
Mar (10.7%)
Apr (10.2%)
May (2.1%)
Jun (3.7%)
Jul (4.8%)
Aug (7.5%)
Sep (7.5%)
Oct (7%)
Nov (8.6%)
Dec (12.3%)
Fig. 5. Monthly distribution of shark attacks (percentage of total in parentheses) between 1990 and 2009.
18
16
14
12
10
Cases
8
6
4
2
0
1 2 3 4 5 6 7 8 9 10 11 12 13 14 15 16 17 18 19 20 21 22 23 24
Time (h)
Fig. 6. The hourly temporal distribution of shark attacks between 1990 and 2009.
Table 4. Species involved in shark attacks during the 24-h period for 186 incidents during 1990]2009
Species involved Dawn Morning Afternoon Dusk Night
(0300–0800 hours) (0800–1300 hours) (1300–1800 hours) (1800–2300 hours) (2300– 0300 hours)
White shark (Carcharodon carcharias) (%) 31 36 36 20
Bull shark (Carcharhinus leucas) (%) 23 11 13 20 100 (one incident)
Whaler sp. (Carcharhinus sp.) (%) 32 14 18 20
Wobbegong (Orectolobidae sp.) (%) 20 20
All other sharks (%) 14 19 33 20
which was a dead dolphin), nine incidents involving seals and Discussion
one involving a whale. One report recorded the proximity of a The results of the current analysis have demonstrated that shark
penguin and in three incidents other sharks were reported to be in attacks in Australia have increased over the past 20 years. This
close proximity. increase can be explained through (1) changes in population sizeShark attacks in Australia Marine and Freshwater Research 751
that has resulted in more contact between sharks and people, popularity of surfing in current-day Australia was highlighted
(2) changes in the behaviour of people, (3) changes in the in a survey administered in 2005–2006, which estimated that
methods of reporting or (4) an increase in the abundance of ,12% of the adult population of Australian cities participated in
sharks. Information supporting some or all of these explanations the sport of surfing, resulting in ,1.68 million recreational
for the increase in attacks is examined below. surfers in Australia (www.surfersvillage.com, 10 June 2009).
Over the past century, the population of Australia has Applying a 20% increase, similar to the percentage increase
increased from 3.7 million in 1900 to 17 million in 1990, and recorded for beach visitations, it is conservatively estimated that
to 22 million people in 2009, with a 13% and 15% increase, there were ,2.061 million recreational surfers in Australia in
respectively, for the past two decades. Over the past decade, the 2009. Another water-based activity that has increased over the
number of international tourists visiting Australia has increased, past few decades is SCUBA diving. There has been an increase
with ,470 000 visiting Australia each year (Australian Bureau in the popularity of SCUBA diving worldwide, with ,3 381 254
of Statistics 2009). The increased population, tourism and Professional Association of Diving Instructors (PADI) regis-
popularity of water sports and activities such as swimming, tered certified SCUBA divers in 1990, increasing up to
surfing, snorkelling, SCUBA diving and kayaking have resulted 17 532 116 in 2008 (418% increase). The Asian Pacific region
in more people being in the water at beaches, harbours and rivers (including Australia) has had an average of 132 000 new diver
around Australia, therefore increasing the risk of a possible certifications per year from 2002 to 2008 (PADI 2009).
interaction with sharks. The increases in shark attacks of 16% Changes in the popularity of water-based activities over the
and 25% over each of the past two decades are of a very similar past four decades was reflected in the activities of the victims.
magnitude to those of the population and tourism increases, For example, there has been a 310% increase in attacks on
suggesting that the increase could largely be the result of surfers since 1999. There have also been substantial increases in
changes in population. However, population increases before the attacks on swimmers, SCUBA divers and sailboarders.
1990 did not result in increases in the rate of attacks, indicating Historically (pre-1950s), human–shark interactions predom-
that other factors also need to be considered. The trend in inantly occurred in the summer months. In recent decades,
the Australian shark-attack rate is consistent with internat- swimmers, surfers and divers are continuing to pursue these
ional statistics that indicate the number of shark attacks have activities outside of the traditional summer season because of
increased over a similar period, apparently as a result of the improvements in wetsuit technology. This is reflected in the
greater numbers of bathers in the water (Burgess 2009). occurrence of shark attacks throughout the year since the 1950s;
The majority of the population increase has occurred along particularly for surfers, snorkelers and SCUBA divers who can
coastal areas, primarily in NSW and Queensland (ABS 2009), enter the water at any time of the year and extend the time they
with many people leaving the big cities and inhabiting or spend in the water in areas that, in earlier decades, were likely to
holidaying in more isolated coastal areas, consequently acces- be too cold for recreational purposes. In the past 20 years, 49%
sing previously isolated beaches, fishing and surfing spots of all shark-attack victims were wearing a wetsuit. These data
around the coast. Analysis of the distribution of shark attacks support a similar account by Cliff (1991) regarding the effect of
indicates that 171 incidents (91%) in the past two decades have wetsuits on shark-attack increases in South Africa.
occurred away from the major population centres, along the There have been 26 attacks recorded in the cooler months
eastern coast where shark-control programs are not deployed. (May–August) during the past two decades (resulting in six
This may be interpreted as highlighting the efficiency of the fatalities), compared with 15 incidents (resulting in four fatali-
various shark-meshing programs in reducing shark attacks, ties) during the same months in the previous 20-year period.
a view historically taken by the authorities managing the (Fig. 5). There is no suggestion that wetsuits in themselves are
programs (Dudley and Cliff 1993; Queensland Government the cause of an attack, but rather that their use has allowed
Department of Primary Industries and Fisheries 2006); however, people to extend their time in the water, increasing the risk of
it may also relate to differences in the spread of people to encountering a shark.
outlying areas that may support a larger shark population than It is likely that in the early 1900s until the 1960s, not all shark
occurs around major metropolitan meshed beach sites. interactions were reported or recorded, particularly in incidents
At the same time as the increase in population, there has been where serious injury did not occur. The increased awareness
a dramatic increase in the popularity of water-based activities of the existence of the ASAF and the extensive network of the
for leisure or fitness. Given this, it would be expected that the ASAF has increased diligence in reporting incidents. In addi-
risk of a person encountering a shark would also increase tion, the capacity of the media to easily access these encounters
because they are spending longer periods in the water. There via mobile phones and the internet is likely to have contributed
has been a large increase in beach visitations, indicated by to the 190% rise in reported non-injury attacks in the past decade
figures from Surf Life Saving Australia (SLSA 2010), of (2000–2009), compared with the previous decade (1990–1999).
,100 million beach visitations in 2009, an increase of 20% on
the previous year’s estimate of 80 million. This increased beach
use is also reflected in the SLSA data (SLSA, pers. comm.) Changes in the abundance of sharks
which indicate that there has been a 29% increase in the number Throughout the world, human populations are increasing
of beach rescues over the past decade (from 10 226 in the 1999– whereas shark populations are decreasing because of direct and
2000 season to 13 185 in the 2008–2009 season) and an 1100% indirect human impact (Castro et al. 1999). There is evidence
increase in the number of preventative actions taken by surf life that at least some shark populations in Australia have declined as
savers (from 55 212 in 1990 to 662 955 in the 2009 season). The a result of commercial and recreational fishing pressure (Punt752 Marine and Freshwater Research J. G. West
and Walker 1998; Punt et al. 2000; Simpfendorfer et al. 2000; between June and September and resulted in nine fatalities.
McAuley et al. 2007) and, at least in NSW and Queensland, as a White-shark attacks have not been recorded above the latitude
result of shark nets and drum lines (Green et al. 2009). These 268390 S (Maroochydore), Queensland, or 288430 S (Houtman
declines will not be consistent over all of Australia, with local Abrolhos Islands), WA, although they are known to occur in
shark densities influenced by a wide range of factors, including higher latitudes (Last and Stevens 2009). Although white sharks
the type and intensity of fishing. represent only 29% of the attacks, they are responsible for 68%
One indicator of shark abundance is the beach protection of the fatalities, highlighting the potential severity of their bite.
program in NSW where catches have been monitored for The popularity of water-based activities in harbours, estua-
decades and provide a long-term data series. From the introduc- rine areas and rivers has seen an increase in attacks by bull
tion of the shark-meshing program (SMP) in Sydney (1937), sharks (Carcharhinus leucas), with two fatalities occurring in
,1500 sharks were caught in the first 17 months, an average man-made canals (open to the ocean) and two occurring off
of 88 sharks per month (Green et al. 2009). Within a decade, ocean beaches. The increase is possibly due to the propensity of
catches from the SMP averaged less than eight sharks per month this species to inhabit shallow near-shore coastal waters, har-
in the Sydney region (Reid and Krogh 1992). Almost all species bours, estuarine habitats and fresh water (including man-made
have declined over that period. Declines in the number of sharks canals), where encountering people would be enhanced. There
captured following the introduction of shark-control measures were eight bull-shark attacks recorded from December to March
were also found in Queensland (Simpfendorfer 1993), South in the Sydney area. This reflects their seasonal movement along
Africa (Cliff and Dudley 1992), New Zealand (Cox and Francis the NSW coast that is consistent with the annual changes in
1997) and Hawaii (Wetherbee et al. 1994). The shark meshing water temperature (A. F. Smoothey, Cronulla Fisheries Scien-
and commercial catch-rate declines suggest that the increase in tific Officer, pers. comm.). Similarly, bull-shark attacks off
reported shark attacks over the past two decades is not a result of South Africa are biased to warmer-water months (Cliff 1991).
increasing shark numbers. This affinity to warmer water is corroborated by a lack of bull-
shark attacks below the latitude 348320 S (Wollongong, NSW) on
Environmental influences on shark attacks the eastern coast and 318580 S (Swan River, WA) on the western
Shark attacks occur all year round in Australian waters. Over coast. Like bull shark, the tiger shark is also known to move
the past 20 years, the majority of the attacks (71%) occurred south in the summer months and attacks have been recorded as
between November and April (Fig. 5). This seasonal peak period far south as latitude 348030 S (Port Hacking, NSW) and 318590 S
coincides with warmest air and water temperatures and school (Cottesloe Beach, WA) on the eastern and western coasts,
holiday, Christmas, New Year and Easter holiday periods. This respectively. There have been 20 attacks by bull sharks in
is the time of maximal use of beaches, harbours and rivers for estuarine harbours and man-made canals (and 5 in coastal areas)
recreation, and the time when most people are in the water, along the eastern coast, suggesting that increased human activi-
increasing the risk of a shark encounter. ties have increased the risk of an attack by this species in these
A review of attack frequencies indicated that attacks can locations.
occur at any time of the day. Beach surveys conducted in South Attacks by the wobbegong shark (Orectolobus sp.) has seen
Australia (Department for Environment and Heritage South an increase of 9%, compared with the previous 20-year period.
Australia 2003) have indicated that most visitations occur in Although not considered dangerous, the relatively small and
the morning and afternoon periods (66% combined), peaking at sometimes aggressive species has a history of attacking people
1100–1300 hours, and are most likely related to the increasing that inadvertently come close to it in its natural habitat, while
air temperature throughout the day and fewer people visiting swimming, snorkelling and SCUBA diving in relatively shallow
the beach during the dawn and dusk periods (18% and 15%, water. The whaler group of shark (unknown species identified to
respectively). Of the three main groups of sharks implicated in family Carcharhinidae) has shown a 14%increase in recorded
attacks, the white shark, bull shark and whaler shark group attacks, compared with the previous 20-year period. It is
are relatively evenly represented throughout the day (Table 4). believed that most of the increase related to this group may be
More shark attacks are recorded during the morning and after- due to confusion with juvenile white sharks (,3 m), which can
noon periods and fewer attacks are recorded in the dawn and easily be misidentified as whaler sharks and contribute to this
dusk periods, which reflects the beach-visitation survey data. increase (Bruce 1992).
There has been a long-held belief that the relatively small The size of the attacking shark indicated that the larger the
number of people in the water at dawn or dusk are at a potentially shark the more damage it can inflict on the objects it bites. Large
higher risk of shark attack because of increased shark-feeding white, tiger and bull sharks .2 m in length were involved in the
behaviour. While crepuscular and nocturnal feeding behaviour is 22 fatalities. There were no fatalities recorded for any species
known in many species of large predatory sharks (Klimley et al. ,2 m in length. These results support the contention that
1992), they are also known to be opportunistic and inquisitive any shark .2 m in length should be considered potentially
and have been observed to investigate opportunities to feed day dangerous.
and night (Wetherbee 1990; Strong 1996). The small number of There were several marine animals recorded near the attack
incidents analysed for patterns of attack (Fig. 6) are inconclusive site before or during the attack, with 54 incidents where schools
and do not indicate when a specific species is more likely to attack. of migrating fish, other predatory fish, marine birds and marine
Surfboard riders, SCUBA divers and snorkel divers along mammals were observed. Schools of fish were observed in the
the southern Australian states are the main victims of white- immediate area of an attack in 32 incidents, suggesting that
shark attacks (16 incidents) occurring during the cooler months sharks in these circumstances may have mistaken the person forShark attacks in Australia Marine and Freshwater Research 753
their prey item while feeding on school fish. Dolphins (unknown Museum of Natural History, University of Florida.) Available at http://
species) were recorded in close proximity in 11 incidents. www.flmnh.ufl.edu/fish/sharks [accessed 10 April 2010].
Seals (unknown species) were observed in the vicinity in Castro, J. L., Woodley, C. M., and Brudek, R. R. (1999). A preliminary
nine incidents and white sharks were involved in eight of evaluation of the status of shark species. FAO Fisheries Technical Paper
these incidents. Swimming, surfing or diving near seals or seal 380. Food and Agriculture Organization of the United Nations, Rome.
Cliff, G. (1991). Shark attacks on the South African coast between 1960 and
colonies has the highest rate of severe injury and fatalities
1990. South African Journal of Science 87, 513–518.
(89% combined). These results have confirmed the apparent Cliff, G., and Dudley, S. F. J. (1992). Protection against shark attack in
selectivity of pinnipeds in white-shark diet (Bruce 1992; South Africa, 1952–90. Australian Journal of Marine and Freshwater
Long et al. 1996), to the extent that prey can shape white- Research 43, 263–272. doi:10.1071/MF9920263
shark predatory strategies (Bruce et al. 2006). These data have Coppleson, V. (1933). Shark attacks in Australian waters. The Medical
highlighted that swimming, diving or surfing near or amongst Journal of Australia 1, 449–467.
schooling fish, dolphins, seals or near seal colonies has the Coppleson, V. (1958). ‘Shark Attack.’ (Angus and Robertson: Melbourne.)
potential to substantially increase the risk of an interaction with Cox, G., and Francis, M. (1997). ‘Sharks and Rays of New Zealand.’
a shark. (Canterbury Press: Christchurch, New Zealand.)
Department for Environment and Heritage South Australia (2003). Metropol-
itan Adelaide beach users survey: general public and beach user summary
Conclusion
report. Coastal and Marine Branch Project No. 6628, DEH, Adelaide.
Patterns of attack have changed substantially over time as a Dudley, S. F. J., and Cliff, G. (1993). Some effects of shark nets in the Natal
result of the changing population and human behaviour. If nearshore environment. Environmental Biology of Fishes 36, 243–255.
human activity related to water-based activities and the use of doi:10.1007/BF00001720
beaches, harbours and rivers continues to change, we can expect Green, M., Ganassin, C., and Reid, D. D. (2009). NSW DPI. Report into the
to see further changes in the patterns, distribution, frequency and NSW Meshing (Bather Protection) Program, Public Consultation Docu-
ment. NSW Department of Primary Industries, Fisheries Conservation &
types of attacks in the future. Encounters with sharks, although a
Aquaculture Branch, Sydney. 134 pp.
rare event, will continue to occur if humans continue to enter the Klimley, A. P., Anderson, S. D., Pyle, P., and Henderson, R. P. (1992).
ocean professionally or for recreational pursuit. Spatiotemporal patterns of white shark (Carcharodon carcharias) pre-
It is important to keep the risk of a shark attack in perspective. dation at the South Farallon Islands, California. Copeia 1992, 680–690.
On average, 87 people drown at Australian beaches each year doi:10.2307/1446143
(SLSA 2010), yet there have been, on average, only 1.1 fatalities Last, P. R., and Stevens, J. D. (2009). ‘Sharks and Rays of Australia.’
per year from shark attack over the past two decades. It is clear (CSIRO Publishing: Melbourne.)
that the risk of being bitten or dying from an unprovoked shark Long, D. J., Hanni, K. D., Pyle, P., Roletto, J., Jones, R. E., Bandar, R., et al.
attack in Australia remains extremely low. (1996). White shark predation on four pinniped species in central
California waters: geographic and temporal patterns inferred from
Acknowledgements wounded carcasses. In ‘Great White Sharks, the Biology of Carchar-
odon carcharias’. (Eds A. P. Klimley and D. G. Ainley.) pp. 263–274.
I thank the Taronga Conservation Society Australia (TCSA) Board and (Academic Press: San Diego, CA.)
Director and Chief Executive Officer Cameron Kerr for their support and McAuley, R. B., Simpfendorfer, C. A., and Hall, N. G. (2007). A method for
Dr George Burgess of the Florida Museum of Natural History, for his evaluating the impacts of fishing mortality and stochastic influences on
guidance over the past 25 years. I also thank Dr Barry Bruce (CSIRO) and Dr
the demography of two long-lived shark stocks. ICES Journal of Marine
David Slip (TCSA) for their advice on the development of this paper. Thanks Science 64, 1710–1722. doi:10.1093/ICESJMS/FSM146
also go to the Editor (MFR), Guest Editor and referees for their constructive PADI (2009). ‘PADI Statistics.’ Available at http://www.padi.com
advice. I also thank Mr Gordon Hill for his voluntary assistance in [accessed 10 April 2010].
researching archival case information and Mr Mark Williams, Public Punt, A. E., and Walker, T. I. (1998). Stock assessment and risk analysis for
Relations Department (TCSA), for his advice. the school shark (Galeorhinus galeus) off southern Australia. Australian
Journal of Marine and Freshwater Research 49, 719–731. doi:10.1071/
References MF96101
Australian Bureau of Statistics (2009). ‘Australian Population Figures.’ Punt, A. E., Pribac, F., Walker, T. I., Taylor, B. L., and Prince, J. D. (2000).
Available at http://www.abs.gov.au [accessed 1 June 2010]. Stock assessment of school shark Galeorhinus galeus based on a
Baldridge, H. D. (1969). International shark attack file data assimilation spatially-explicit population dynamics model. Australian Journal of
program: final report. Mote Marine Laboratory, Sarasota, FL. Marine and Freshwater Research 51, 205–220. doi:10.1071/MF99124
Baldridge, H. D. (1974). ‘Shark Attack: A Program of Data Reduction Queensland Government Department of Primary Industries and Fisheries
and Analysis.’ (Contributions from the Mote Marine Laboratory: (2006). A report on the Queensland Shark Safety Program. QLD DPIF,
Sarasota, FL.) Brisbane, March 2006.
Bruce, B. (1992). Preliminary observations on the biology of the white Reid, D., and Krogh, M. (1992). Assessment of catches from protective
shark, Carcharodon carcharias, in South Australian waters. Australian shark meshing off New South Wales beaches between 1950 and 1990.
Journal of Marine and Freshwater Research 43, 1–11. doi:10.1071/ Australian Journal of Marine and Freshwater Research 43, 283–298.
MF9920001 doi:10.1071/MF9920283
Bruce, B. D., Stevens, J. D., and Malcolm, H. (2006). Movements and Simpfendorfer, C. (1993). The Queensland Shark Meshing Program:
swimming behaviour of white sharks (Carcharodon carcharias) in analysis of the results from Townsville, north Queensland. In ‘Shark
Australian waters. Marine Biology 150, 161–172. doi:10.1007/S00227- Conservation’. (Eds J. Pepperell, P. Woon and J. West.) pp. 71–85.
006-0325-1 (Taronga Zoo: Sydney.)
Burgess, G. H. (2009). ‘International Shark Attack File. The Relative Risk of Simpfendorfer, C. A., Donohue, K., and Hall, N. G. (2000). Stock
Shark Attacks to Humans: More People Mean More Attacks.’ (Florida assessment for the whiskery shark (Furgaleus macki (Whitely)) in754 Marine and Freshwater Research J. G. West
south-western Australia. Fisheries Research 47, 1–17. doi:10.1016/ Wetherbee, B. M., Lowe, C. G., and Crow, G. L. (1994). A review of shark
S0165-7836(00)00109-0 control in Hawaii with recommendations for future research. Pacific
Strong, W. R. (1996). Shape discrimination and visual prediatory tactics Science 48, 95–115.
in white sharks. In ‘Great White Sharks, the Biology of Carcharodon Whitley, G. P. (1940). ‘Fishes of Australia. Part 1. Sharks, Rays, Devil-Fish
carcharias’. (Eds A. P. Klimley and D. G. Ainley.) pp. 229–240. and other Primitive Fishes of Australia and New Zealand.’ (Royal
(Academic Press: CA.) Zoological Society of NSW: Sydney.)
Surf Life Saving Australia (2010). An update in beach and aquatic safety Whitley, G. P. (1951). Shark attacks in Western Australia. Western Austra-
2010. Beachsafe Newsletter, Issue 17. lian Naturalist 2, 185–194.
West, J. G. (1993). The Australian Shark Attack File with notes on Woolgar, J. D., Cliff, G., Nair, R., Hafez, H., and Robbs, J. V. (2001). Shark
preliminary analysis of data from Australian waters. In ‘Shark Conser- attack: review of 86 consecutive cases. The Journal of Trauma 50,
vation’. (Eds J. Pepperell, P. Woon and J. West.) pp. 93–101. (Taronga 887–891. doi:10.1097/00005373-200105000-00019
Zoo: Sydney.)
Wetherbee, B. (1990). Feeding biology of sharks. In ‘Discovering Sharks’.
(Ed. S. Gruber.) pp. 74–76. (American Littoral Society: Highlands, NJ.) Manuscript received 2 July 2010, accepted 7 March 2011
http://www.publish.csiro.au/journals/mfrYou can also read