Estimating the impact of control measures to prevent outbreaks of COVID 19 associated with air travel into a COVID 19 free country - Nature
←
→
Page content transcription
If your browser does not render page correctly, please read the page content below
www.nature.com/scientificreports
OPEN Estimating the impact of control
measures to prevent outbreaks
of COVID‑19 associated with air
travel into a COVID‑19‑free country
Nick Wilson1,2*, Michael G. Baker2, Tony Blakely3 & Martin Eichner4,5
We aimed to estimate the risk of COVID-19 outbreaks associated with air travel to a COVID-19-
free country [New Zealand (NZ)]. A stochastic version of the SEIR model CovidSIM v1.1, designed
specifically for COVID-19 was utilised. We first considered historical data for Australia before it
eliminated COVID-19 (equivalent to an outbreak generating 74 new cases/day) and one flight per
day to NZ with no interventions in place. This gave a median time to an outbreak of 0.2 years (95%
range of simulation results: 3 days to 1.1 years) or a mean of 110 flights per outbreak. However, the
combined use of a pre-flight PCR test of saliva, three subsequent PCR tests (on days 1, 3 and 12 in
NZ), and various other interventions (mask use and contact tracing) reduced this risk to one outbreak
after a median of 1.5 years (20 days to 8.1 years). A pre-flight test plus 14 days quarantine was an
even more effective strategy (4.9 years; 2,594 flights). For a much lower prevalence (representing only
two new community cases per week in the whole of Australia), the annual risk of an outbreak with
no interventions was 1.2% and had a median time to an outbreak of 56 years. In contrast the risks
associated with travellers from Japan and the United States was very much higher and would need
quarantine or other restrictions. Collectively, these results suggest that multi-layered interventions
can markedly reduce the risk of importing the pandemic virus via air travel into a COVID-19-free
nation. For some low-risk source countries, there is the potential to replace 14-day quarantine with
alternative interventions. However, all approaches require public and policy deliberation about
acceptable risks, and continuous careful management and evaluation.
The COVID-19 pandemic spread rapidly around the world from early 2020. In response, many countries imple-
mented control measures related to international travel with these including border closures, partial travel
restrictions, exit or entry screening, and quarantine of t ravellers1. A systematic review of the effectiveness of these
interventions1 reported that: “broadly, travel restrictions may limit the spread of disease across national borders.
Entry and exit symptom screening measures on their own are not likely to be effective in detecting a meaning-
ful proportion of cases to prevent seeding new cases within the protected region; combined with subsequent
quarantine, observation and PCR testing, the effectiveness is likely to improve”.
Indeed, such measures when combined with various public health and social measures (PHSMs) such as
mask use and physical distancing (sometimes including “lockdowns”), have effectively eliminated community
transmission of the SARS-CoV-2 pandemic virus in a number of jurisdictions 2. These include those with large
land borders such as China and Vietnam, but also islands such as Taiwan, Australia and New Z ealand2. A number
of small Pacific island nations that have used tight border controls have even completely avoided any community
transmission of SARS-CoV-2 (e.g., Samoa, Tonga, Cook Islands).
Despite the apparent economic benefits with elimination strategies in terms of GDP impacts during 2020,
when compared to countries using suppression s trategies2, there is growing interest in how they can safely open
up international travel between them to regain the social and economic benefits of quarantine-free travel (e.g., for
family reunions, for business travel and for tourism). Indeed, there are arguments for how progressive expansion
1
BODE3 Programme, University of Otago, Wellington, New Zealand. 2HEIRU, University of Otago, Wellington,
New Zealand. 3Population Interventions Unit, Centre for Epidemiology and Biostatistics, Melbourne School
of Population and Global Health, University of Melbourne, Melbourne, Australia. 4Epimos GmbH, Dußlingen,
Germany. 5Institute for Clinical Epidemiology and Applied Biometry, University of Tübingen, Tübingen,
Germany. *email: nick.wilson@otago.ac.nz
Scientific Reports | (2021) 11:10766 | https://doi.org/10.1038/s41598-021-89807-y 1
Vol.:(0123456789)www.nature.com/scientificreports/
Parameter Australia (historical base case)* Scenario analysis: Japan Scenario analysis: US
Reported average new cases per day in the period 1 April 2020 to 25
74 1289 104,594 (adjusted for under-reporting**)
February 2021 (WHO data14,15)
Average new cases per day per million population (for the time period in
3.0 10.2 319.7
the above row and using OECD population data16)
Estimated point prevalence per million population of SARS-CoV-2
infection on average day (assuming a 16-day long period that comprises
the latent and prodromal periods plus the rest of the infectious period, 48 163 5115
see Table 2). This is what is used in the model to determine traveller risk
at the time of pre-flight testing prior to departure to NZ
Table 1. Input parameters relating to the countries of origin for the travellers arriving in New Zealand (NZ).
*In the situation in Australia in early 2021 where COVID-19 elimination status had been achieved (albeit
introduced cases being in quarantine and isolation in border facilities), these values are those that could be
generated by a large outbreak from a border control failure. See Table 5 for scenario analyses using much lower
prevalence values that would better equate to small outbreaks following border control failures in Australia.
Furthermore, these historical values also partly represent cases detected at the Australian border and then
managed to eliminate any risk of transmission in the community. ** Adjusted for the 1.24 times greater excess
deaths in the USA relative to deaths attributable to COVID-19 as per the period 8 March 2020 and 9 January
202117.
of “green zones” might open up the possibility of regional elimination of COVID-19 and then ultimately provide
a chance of global eradication3.
Two countries that have had partial quarantine-free travel are Australia and New Zealand, and as of March
2021 they were in the process of expanding on this to make such travel two-way and to involve all Australian
States and Territories4. Given such developments, we aimed to model the risk of COVID-19 outbreaks associ-
ated with international air travel from Australia to New Zealand, along with the likely impact of various control
measures that could be used to minimise the risk of such outbreaks. We also aimed to consider the risk for such
international travel from Japan and the United States (US) to New Zealand in scenario analyses.
Methods
Model design and parameters for SARS‑CoV‑2 and COVID‑19. We used a stochastic SEIR type
model with key compartments for: susceptible [S], exposed [E], infected [I], and recovered/removed [R]. The
model is a stochastic version of CovidSIM which was developed specifically for COVID-19 (http://covidsim.eu;
version 1.1) and built in Pascal. The stochastic simulation of the compartmental model followed the procedure
described by Gillespie 5. If not stated otherwise, one billion simulations were run per combination of interven-
tion strategies. Each simulation started with the random sampling of the initial infection state of 300 passengers
who would then (if infected) progress in their natural history and infect others (see Supplementary Information
for further detail). In a separate set of simulations, probabilistic parameter sampling within parameter uncer-
tainty ranges (probabilistic sensitivity analysis) was also conducted (see Supplementary Information).
Work has been produced from previous versions of this m odel6–8, and the equations and their stochastic
treatment are detailed in two of these o utputs9,10. Code for the model is available online is available online at
GitHub (https://github.com/nick-wilson-github/Air-travel-Covid-risk-modelling/tree/main).
The parameters were based on available publications and best estimates used in the published modelling work
on COVID-19 (as known to us in February 2021).
Prevalence of infection in Australia reflecting an outbreak. To estimate the prevalence of SARS-
CoV-2 infection in Australia as a source country we used historical data on reported cases of infection over the
1 April 2020 to 25 February 2021 period (Table 1). This does not reflect the COVID-19-free status that Australia
has achieved subsequently in early 2021, but rather the situation equivalent to a substantial outbreak (actually
one involving an average of 74 new cases per day). But in scenario analyses we also considered smaller outbreak
sizes. For the simulations, travellers to New Zealand were randomly sampled from the Australian population.
In most of our scenarios, travellers underwent pre-flight testing before boarding (see Fig. 1 and details below).
Selection of control measures. We identified plausible control measures from the published literature1
and also an online review of strategies identified by an IATA Medical Advisory Group11. These controls are
shown in Fig. 1 and Table 3.
Air travel to New Zealand. We simulated one three-hour flight per day from Australia to New Zealand,
carrying 300 passengers. A wide range of aircraft were used on this route in the pre-COVID-19 pandemic era,
with common ones being the Boeing 777-200 which takes 312 passengers and the Airbus A300-300 with 297
passengers. One flight per day is a small proportion of the level of travel in the pre-pandemic time (i.e., 7.1% of
the of 1,542,467 traveller arrivals from Australia to New Zealand prior to the pandemic in the year to January
202012). In additional scenario analyses we also considered flights from Japan and the US (with their different
population burdens of infection and longer flight times), albeit with the same assumptions for passengers as per
flights from Australia to New Zealand.
Scientific Reports | (2021) 11:10766 | https://doi.org/10.1038/s41598-021-89807-y 2
Vol:.(1234567890)www.nature.com/scientificreports/
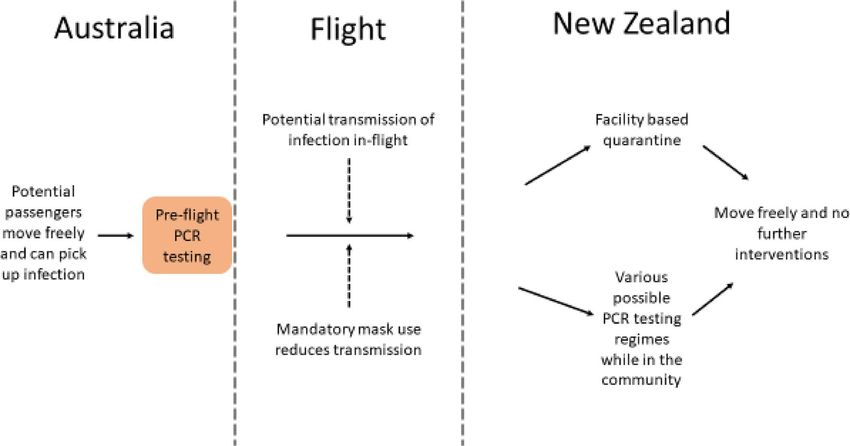
Figure 1. Flow diagram of the modelled movements of air travellers from Australia (when experiencing an
outbreak) including the key interventions (simplified and not showing details around travellers seeking medical
attention when symptomatic in New Zealand, isolation of identified cases and contact tracing).
In‑flight transmission risk. We identified a published review on the transmission of SARS-CoV-2 on
aircraft13. Using this and subsequently published literature (see Supplementary Information for details), we esti-
mated the number of hours of exposure to infected cases (number of infected people on the flights x flight
hours). From this we identified two in-flight infections arising from 933 exposure-hours, giving an estimated
risk of transmission per hour of flying in a plane containing an infectious person of 0.00214 (Table 2).
Arrival in New Zealand. Upon arrival in New Zealand, travellers were either placed in supervised quar-
antine for various periods of days (current practice in New Zealand is for 14 days) and then released to move
freely, or, as an alternative to quarantine, we considered various combinations of PCR testing (on days 1, 3
and 12). Until their last PCR test, we assumed that people could move freely around New Zealand, but were
required to attend official facilities for testing and to wear a mask while in the presence of other people (Table 2).
We further assumed that half of the passengers who develop symptoms during this period would report these
symptoms within one day. Also, we assumed that if passengers are tested positive, or if they reported symptoms
themselves, contact tracing would identify 75% of their infected contacts in New Zealand who would be isolated
after another delay of one day.
Ongoing infection transmission in New Zealand. Secondary cases were assumed to arise from spread
from incoming infected travellers in the community in New Zealand. Tertiary cases were those who were
infected by secondary cases before the latter were isolated, and were assumed to have the full length of their
infectious period ahead of them. Some of them then can trigger an outbreak.
Control measures assumptions. The full details on the control measures we considered are detailed in
Table 3.
Results
Our baseline results used historical data for Australia (equivalent to a border failure resulting in an outbreak
generating 74 new cases/day in an otherwise COVID-19-free Australia) and one flight per day to New Zealand
with no interventions in place (other than mandated masks on flights). This resulted in the median time to an
outbreak in New Zealand being 0.2 years (95% range of simulation results: 3 days to 1.1 years) or after a mean of
110 flights (Table 4). However, the risk progressively declined with the addition of pre-flight testing, testing when
in New Zealand, mask use up to the last test, with symptom reporting, and contact tracing. Given all these (with
testing on days 1, 3 and 12 in New Zealand), the median time to an outbreak was extended to 1.5 years (20 days
to 8.1 years; or a 37% chance per year; or after a mean of 802 flights) (Table 4). Mask wearing by travellers when
in the New Zealand community (up to the time of their last test), had a much larger impact than various aspects
of the proportion self-reporting symptoms and contact tracing performance. However, 14 days quarantine was
a more effective strategy with a median time to an outbreak of 4.9 years (66 days to 26.2 years; mean of 2,594
flights); albeit combined with a pre-flight test. Even better was 21 days of quarantine which was associated with
virtually a zero risk of an outbreak ever occurring.
Scientific Reports | (2021) 11:10766 | https://doi.org/10.1038/s41598-021-89807-y 3
Vol.:(0123456789)www.nature.com/scientificreports/
Parameter Value/s used Further details for parameter inputs into the modelling
We used the best estimate from CDC of a mean of 6 days to symp-
toms (i.e., the latency period plus the prodromal period)18. We
Latency period 5 days
used a standard deviation (SD) of 25% (1 day) (calculated using 16
stages; Erlang distribution)
There is still uncertainty about the length of the prodromal
Prodromal period 1 day period for COVID-19, so we used an assumed value for influenza
(SD = 25%; 0.25 days, Erlang distribution)
The WHO-China Joint Mission report stated that “the median
time from onset to clinical recovery for mild cases is approxi-
mately 2 weeks and is 3–6 weeks for patients with severe or critical
Symptomatic period 10 days (split into 2 periods of 5 days each)
disease”19. But given that mild cases may have been missed in this
particular assessment, we used a slightly shorter total time period
of 10 days (SD = 25%; 2.5 days, Erlang distribution)
We used the best estimate from CDC of 60% symptomatic and 40%
Infections that lead to sickness (symptomatic illness) 60%
asymptomatic18*
Contagiousness
This risk was estimated for transmission from an infectious case
on a flight in which there was mandated masking (i.e., masks are
mandated for all international flights arriving in NZ at the time of
Risk of in-flight transmission 0.00214 per hour of flying writing in March 2020). It is the risk that an index case infects one
of the fellow passengers, not the individual risk of each fellow pas-
sengers to acquire infection. See the Supplementary Information
for our estimates derived from our review of the literature*
For the Australia to NZ flights (e.g., Sydney to Auckland). Times
Flight duration 3h for flights from Japan and the US in scenario analyses are shown
in Table 5*
We used the best estimate from CDC of R0 = 2.518. We assumed
for NZ that the social behaviour with elimination status was fairly
similar to the pre-COVID-19 situation (i.e. negligible additional
Effective reproduction number (Re) in the NZ post-pandemic
2.5 physical distancing, normal occurrence of indoor events in public
setting
settings and no routine mask use by the great majority of the popu-
lation). We also assumed a population with no specific immunity
to SARS-CoV-2 (acquired or via vaccination)
We assumed this was high given that the CDC estimate that 50% of
Relative contagious-ness in the prodromal period 100%
transmission occurs prior to symptom onset18
In the first five days of symptoms, cases were considered to be fully
contagious. In the second five-day period, this was assumed to be
Contagiousness after the prodromal period 100% and 50%
at 50%. The latter figure is still uncertain, but is broadly consistent
with one study on changing viral load20
Table 2. Input parameters used for modelling the potential spread of COVID-19 infections with the
stochastic version of CovidSIM (v1.1) with New Zealand as a case study. *See Supplementary Information for
consideration of uncertainty and probabilistic sensitivity analysis.
Table 5 details a range of scenario analyses including if Australia’s infection prevalence was 10 times lower
than in the historical base case (i.e., approximating if Australia had a small outbreak from a border failure with
around seven new cases per day). For this particular scenario and with no interventions the annual risk of an
outbreak was 28.3% and had a median time to an outbreak of 2.1 years. For an even lower prevalence (represent-
ing only two new community cases per week in the whole of Australia), the annual risk of an outbreak with no
interventions was 1.2% and had a median time to an outbreak of 56 years. But these risks would increase with
higher travel volumes as per the scenario of a 20-fold increase in travel from Australia.
The high prevalence of infection for the US meant that, even with quarantine, the median time to an outbreak
was only 20 days, or after only a mean of 29 flights (Table 5). But the equivalent values for Japan were much
longer (1.7 years) and larger (870 flights).
The stochastic simulations using base case parameters presented in this main text were also directly compared
with a probabilistic sensitivity analysis (PSA) involving random sampling from the parameter distributions
(results in the Supplementary Material: Table S3). This comparison showed almost identical results from the
two approaches.
Discussion
Main findings and interpretation. This analysis examined the risk of COVID-19 outbreaks in a COVID-
19-free nation (New Zealand), if there was air travel from a low-prevalence country (e.g., if Australia experi-
enced various sizes of outbreaks from border failure and lost its COVID-19 “elimination status”). Using the
historical data for Australia (equivalent to an outbreak with 74 new cases per day) and no interventions, we
estimated that there would be such an outbreak of COVID-19 in New Zealand after a median time of only two
to three months. Fortunately, the multi-layered packages of interventions we modelled reduced this risk to much
lower levels. Indeed, without quarantine, the use of a package of measures (pre-flight testing, PCR testing in New
Zealand, mask use and contact tracing) could reduce the risk to potentially tolerable levels—if health authorities
had confidence in the application of these measures in the real world (e.g., adherence with mask use by travellers
and minimal defaulting on testing when in the New Zealand community).
Scientific Reports | (2021) 11:10766 | https://doi.org/10.1038/s41598-021-89807-y 4
Vol:.(1234567890)www.nature.com/scientificreports/
Control measure Value/s used Comment
For test sensitivity we used a meta-analysis that gave a
sensitivity for saliva testing (PCR) at 62.3% (95%CI: 54.5%–
69.6%). This was less than for nasopharyngeal aspirate/swab
Pre-flight testing using saliva (PCR) of travellers in the 24 h and throat swab (73.3%, 95%CI: 68.1%–78.0%); and for
62.3% sensitivity
before departure sputum (97.2%, 95%CI: 90.3%–99.7%)21. We note however,
that the sensitivity we used here for saliva testing may be
an underestimate given other work showing equivalence
between nasopharyngeal and saliva based PCR tests22*
We ran the simulations for three different lengths of
quarantine, including 14 days as used in NZ, and longer as
in some other settings (e.g., 21 days in China). We assumed
a high quality quarantine process where there was no cross-
infection within the quarantine facility to facility workers
or to other travellers in quarantine. But we assumed no
additional PCR testing within quarantine. In reality, NZ
combines the 14-day quarantine process with PCR testing
Facility-based quarantine in NZ for travellers (current
7, 14 and 21 days (nasopharyngeal swab) upon arrival (“day 1”) (travellers
practice as per March 2021 in NZ)
from the majority of countries), and days 3 and 12 (all
travellers). This process further helps reduce the risk by
allowing for infectious individuals to be put into isolation
and so reduce the risk of infecting others who are also in
quarantine. But these additional benefits from testing are
probably outweighed by the limitations in NZ’s processes
that have resulted in various failures of the quarantine/iso-
lation facility system that utilises converted hotels23
We used the results of a study24 which fitted a Bayesian
hierarchical logistic regression model for test sensitivity.
This meant for example, at day 4 after infection, 67% of test
results were false negatives. This decreased to 20% on day 8
and then increased after this e.g., up to 66% on day 21. For
cases who already recovered before their PCR test, we use
the final value reported by Kucirka et al. (i.e., 34% sensitiv-
ity). In the days after arrival and before the next PCR test,
Testing instead of facility-based quarantine: PCR test for The time course of sensitivity values from Kucirka et al. we assume that people act normally and so can potentially
SARS-CoV-2 at various times was used spread infection to the NZ public (albeit with mask use
when with other people as per the details below). For more
details, see Supplementary Information
In the absence of relevant data, we had to assume test result
independence i.e., a false negative for a test was not corre-
lated with a false negative for a later test. If both results were
negative, we assumed no further follow-up. We considered
a wide range of different timing options for PCR tests after
arrival in NZ (see the “Results”)
We used performance data for the cluster of cases in
Auckland in August 2020 where the official estimate was
80% of contacts contacted within 48 h (as reported by the
Contact tracing if (i) a scheduled PCR test is positive or (ii)
Prime Minister)25. We divided this into 60% within the
if people develop symptoms and seek medical attention 80% of infected contacts are traced and isolated within 48 h
first 24 h and 20% in the next 24 h. Of note is that variable
(see below)
performance for contact tracing has been reported for NZ
at other times in August 2020, with 86% of contacts traced
in 48 h at one point26*
We assumed that this proportion is somewhat higher than
that for the general community (see below) on the assump-
tion that these travellers would be provided information on
the flight and on arrival in NZ on the critical importance
of seeking medical attention if they develop any symptoms.
They would also be told that such medical attention would
be provided free of charge. We assumed PCR confirmation
The proportion of infected travellers who when they
50% (self-reporting occurs on average 1 day after symptom of self-reported symptoms and if a positive test, then we
develop any symptoms seek medical attention (i.e., they are
onset) assumed case isolation and potentially triggering contact
in the 60% who will ever develop symptoms)
tracing
Of note is that routinely in NZ, 39.5% of people with “fever
and cough” symptoms seek medical attention, as reported
by the NZ Flutracking surveillance system27. This is very
similar to international estimates for people with influenza
who seeking medical attention at 40% e.g., as used in other
modelling6
Traced contacts are assumed to be effectively quarantined
Quarantine of traced contacts 1 day after detection of index cases
with no further spread of infection
We used the results of the most recent meta-analysis we
could identify which involved 29 studies on infection with
SARS-CoV-2, SARS, or MERS28. It reported that “type N-95
Mandatory mask use by incoming travellers up to the time
66% transmission reduction masks (corresponding approximately to FFP-2), surgical
of their final PCR test in the NZ community
masks, or similar multilayer cotton masks can greatly
reduce the infection risk for the wearers (RR 0.34 [0.26;
0.45]).”*
Table 3. Control measures used and their estimated efficacy in preventing SARS-CoV-2 transmission. *See
Supplementary Information for consideration of uncertainty and probabilistic sensitivity analysis.
Scientific Reports | (2021) 11:10766 | https://doi.org/10.1038/s41598-021-89807-y 5
Vol.:(0123456789)www.nature.com/scientificreports/
Median
Prevented waiting time Mean
PCR tests for Traced infections Symptomatic Traced until next number of
Pre-flight travellers (day contacts after in NZ while travellers who contacts after Annual risk outbreak flights to
saliva test Quarantine of 1 is arrival positive PCR travellers wear self-report self-reporting of outbreak occurs (95% create one
Strategy sensitivity travellers day)* test masks** symptoms *** of symptoms in NZ range) outbreak
0.2 years (y)
– – – – – – – 96.4% (3 days [d]–1.1 110
No PCR tests, y)
no quarantine
0.3 y
62.3% – – – – – – 88.4% 170
(4 d–1.7 y)
Addition of PCR tests after arrival in NZ (in addition to pre-flight testing)
0.4 y
62.3% – day 1 – – – – 80.3% 225
(6 d–2.3 y)
0.7 y
62.3% – days 1 + 3 – – – – 65.4% 344
(9 d–3.5 y)
0.7 y
62.3% – days 1 + 3 75% – – – 65.3% 345
(9 d–3.5 y)
0.8 y
62.3% – days 1 + 3 75% – 50% 75% 58.9% 411
(10 d–4.2 y)
1y
62.3% – days 1 + 3 75% 66% – – 49.8% 530
(13 d–5.4 y)
1.2 y
PCR tests 62.3% – days 1 + 3 75% 66% 50% 75% 42.8% 653
(17 d–6.6 y)
0.7 y
62.3% – days 1 + 3 + 12 – – – – 63.9% 359
(9 d–3.6 y)
0.7 y
62.3% – days 1 + 3 + 12 75% – – – 63.5% 362
(9 d–3.7 y)
0.8 y
62.3% – days 1 + 3 + 12 75% 50% 75% 57.2% 431
(11 d–4.4 y)
1.2 y
62.3% – days 1 + 3 + 12 75% 66% – – 43.0% 650
(16 d–6.6 y)
1.5 y
62.3% – days 1 + 3 + 12 75% 66% 50% 75% 36.6% 802
(20 d–8.1 y)
Facility-based quarantine (in addition to pre-flight testing)
0.6 y
62.3% 7 days – – – – – 67.8% 322
(8 d–3.3 y)
Quarantine 4.9 y
62.3% 14 days – – – – – 13.1% 2594
(66 d–26.2 y)
62.3% 21 days – – – – – 0.0% n.a. 745,000
Table 4. Results of the simulations of the baseline risk (no interventions) and for multi-layered packages of
interventions to prevent COVID-19 outbreaks in New Zealand (NZ) (assuming a historical level of infection
in Australia that was equivalent to a border failure resulting in an outbreak generating 74 new cases/day (as
per Table 1) and mandatory mask use on international flights). One billion stochastic simulations were run for
each intervention strategy. Result values typically rounded to three meaningful digits. Travellers are allowed
to move freely in NZ from arrival to the last PCR test or after being released from quarantine (see Fig. 1). *A
range of days were considered, but the 1 + 3 + 12 day option is the one typically used for travellers to NZ (albeit
combined with quarantine for all travellers to NZ). **Prevention of secondary infections due to wearing of
masks by travellers when in NZ up to the time of the last PCR test. ***The given fraction of passengers who
report having developed symptoms while staying in NZ to the health system; they are assumed to be isolated
one day after symptom onset and contact tracing may occur after this; traced contacts are PCR tested and
isolated after another delay of one day.
More realistically however, for the situation in early 2021 where Australia has effectively eliminated COVID-
19 in the community, is to consider the smaller outbreak scenarios. These would suggest a low risk of an outbreak
in New Zealand (e.g., only a 1.2% annual risk with no interventions and a small outbreak of two new cases per
week in Australia). But even at this low risk level, New Zealand health authorities might still wish to promote
existing digital tools to incoming travellers so as to facilitate rapid outbreak control (e.g., New Zealand encour-
ages QR code scanning when entering buildings and buses etc.).
But for travellers from Japan, the risks are much higher than for travellers from Australia and quarantine
would probably remain appropriate. Whereas for travellers from the US the very high risk might suggest that
tighter travel restrictions are more appropriate until epidemic spread was reduced. Alternatively processes such
as pre-flight quarantine could be considered for US travellers.
Our findings have some compatibility with those of another modelling study which reported that various
interventions (including pre-flight and post-flight testing and five day quarantine) would reduce spread of SARS-
CoV-2 associated with domestic travel within the US29. But the package of interventions modelled were less inten-
sive than in our model and at best reduced the number of “infectious days” in the modelled cohort by only 70%.
Scientific Reports | (2021) 11:10766 | https://doi.org/10.1038/s41598-021-89807-y 6
Vol:.(1234567890)www.nature.com/scientificreports/
Median waiting time until next Mean number of flights to create one
Scenario/country setting Intervention Annual risk of outbreak in NZ outbreak occurs (95% range)**** outbreak#
None 96.4% 76 d (3 d–407 d) 110
Australia to NZ (base case) with the
historical prevalence in Australia of 48/ 2 PCR in NZ* 42.8% 1.2 y (17 d–6.6 y) 652
million (Table 1), 1 flight per day 3 PCR in NZ** 36.6% 1.5 y (20 d–8.1 y) 800
3 h flight time
Quarantine*** 13.1% 4.9 y (66 d–26.2 y) 2593
None 100% 4 d (1 d–22 d) 110
Australia to NZ, as per the historical base
case above but with 20 flights per day 2 PCR in NZ* 100% 23 d (1 d–122 d) 652
(slightly more than the pre-pandemic 3 PCR in NZ** 100% 28 d (1 d–150 d) 800
level)
Quarantine*** 100% 90 d (3 d–480 d) 2593
Australia to NZ, as per base case but with None 28.3% 2.1 y (28 d–11.1 y) 1099
1/10 of the historical base case prevalence 2 PCR in NZ* 5.4% 12.4 y (165 d–65.9 y) 6520
in Australia: 4.8 / million; (equivalent to
a small outbreak from a border failure 3 PCR in NZ** 4.5% 15.2 y (203 d–80.9 y) 8005
averaging 7.4 new cases per day) Quarantine*** 1.4% 49.2 y (1.8–262 y) 25,928
Australia to NZ, as per the base case but None 1.2% 56 y (2–297 y) 29,420
with the prevalence in Australia closer to 2 PCR in NZ* 0.2% 331 y (12–1760 y) 174,114
March 2021 settings and a border failure
generating 2 new cases per week; preva- 3 PCR in NZ** 0.2% 406 y (15–2161 y) 213,809
lence 0.18 / million## Quarantine*** 0.1% 1,314 y (48–6991 y) 691,710
None 100% 23 d (1–124 d) 34
Japan to NZ, with a prevalence of 163 / 2 PCR in NZ* 83.0% 143 d (5 d–2.1 y) 206
million in Japan (Table 1). 1 flight per
day, 10.6 h flight time 3 PCR in NZ** 77.0% 173 d (6 d–2.5 y) 249
Quarantine*** 34.3% 1.7 y (22 d–8.8 y) 870
None 100% 1 d (1–6 d) 2
US to NZ, with a prevalence of 5,115 / 2 PCR in NZ* 100% 5 d (1–27 d) 7
million in the US (Table 1). 1 flight per
day, 13 h flight time 3 PCR in NZ** 100% 6 d (1–32 d) 9
Quarantine*** 100% 20 d (1–109 d) 29
Table 5. Scenario analyses covering different source countries, SARS-CoV-2 infection burdens and flight
volumes (with the base case for comparison). For each intervention strategy, 1 billion stochastic simulations
were run for “Australia base case”, “Australia 20 flights/day” and “Australia 1/10 prevalence”; 100 million
simulations for all other country settings. *Pre-flight saliva test; 2 PCR tests in NZ (on days 1 and 3); until
second PCR, passengers wear masks in NZ and self-report symptoms (contacts are traced and quarantined).
**Pre-flight saliva test; 3 PCR tests in NZ (on days 1, 3 and 12); until third PCR, passengers wear masks in
NZ and self-report symptoms (contacts are traced and quarantined). ***Pre-flight saliva test; quarantine of all
passengers in NZ for 7 days. # The median waiting time until an outbreak occurs only refers to the time until a
plane lands which will cause an outbreak in NZ; further days are needed until a passenger infects somebody,
until the infection spreads in NZ to many others, and until an outbreak is officially declared. Passengers who
are found positive during one of the NZ based PCR tests or traced and detected secondary cases do not trigger
the declaration of an outbreak. Here, an outbreak is assumed to be the out-of-control spread of SARS-CoV-2
which will reach many cases if not prevented by major interventions. ## Due to the very low prevalence,
no additional simulations were run for this scenario, but the outbreak probabilities per flight were linearly
extrapolated from the corresponding base case simulations (based on 1 billion flights each); the reported
output was calculated from the obtained probability per flight as detailed in the Supplementary Information.
It is likely that all these travel-related risks will decline as vaccinations are provided to: (i) the population of
source countries; (ii) travellers (in the weeks prior to travel); and (iii) the population of recipient countries. As
such, future modelling should consider vaccination coverage and vaccination effectiveness in preventing trans-
mission. Future modelling should also ideally factor in costs so that cost-effectiveness ratios can be calculated
for various intervention packages and their marginal adjustments. The relevance of these costs to policy-makers
might also be impacted by who is paying. For example, if all incoming travellers were charged a COVID-19 levy
and aspects of the system could be made user-pays (indeed some charges are already used in the New Zealand
border system for quarantine).
Ultimately, there is also a need for full cost–benefit analyses which consider the benefits of increased travel
to the recipient society and economy—along with the risks of outbreaks that need to be rapidly controlled or
else pose a risk of lockdown measures being required.
Study strengths and limitations. This is the first such study (that we know of), to model such interven-
tions in the context of preventing the re-introduction of SARS-CoV-2 into a country that has eliminated it.
We were also able to consider a wide range of control interventions and to package these in multiple layers of
defence. Nevertheless, there is quite high uncertainty around some of the parameters we used. For example, the
prevalence of infection within source countries is, in reality, highly heterogeneous (by age group, social group
and locality) and will vary over time. Indeed, Australia in early 2021 had effectively eliminated SARS-CoV-2
Scientific Reports | (2021) 11:10766 | https://doi.org/10.1038/s41598-021-89807-y 7
Vol.:(0123456789)www.nature.com/scientificreports/
transmission with just occasional small and rapidly controlled outbreaks arising from border control failures23.
Furthermore, our data on the effectiveness of masks on aircraft was based on a limited amount of real world
experience (i.e., only eight flights with cases on board and mask mandates in place). We also did not model infec-
tion amongst air crew due to the complexity of their international movements and different control measures
used with this occupational group, but note that these personnel have been a rare cause of COVID-19 related
border failures in New Zealand to date.
Another limitation is that we did not account for a small proportion of travellers who might cancel their
flight to New Zealand if becoming symptomatic after infection with SARS-CoV-2. Furthermore, the probability
of symptomatic illness amongst travellers will probably be different than in the general population (e.g., if travel
is dominated by younger adults who are less concerned with pandemic risks). We also assumed full adherence
to testing regimens within the New Zealand community, though potentially this could be achieved if large fines
were imposed or if travellers paid a large financial bond that was only redeemed after full adherence.
Finally, we assumed quarantine only failed due to a tiny proportion of cases having very long incubation
periods. In reality, however, a country like New Zealand has had failures with its COVID-19 quarantine system
with facility workers and other travellers becoming i nfected23. This is because it uses re-purposed hotels instead
of purpose-built facilities and does not confine the travellers to their rooms (i.e., there are shared corridors, lifts,
exercise areas and smoking areas). Given all such issues and ongoing improvements in knowledge of the trans-
mission dynamics of SARS-CoV-2, this type of modelling work should be regularly revised and be performed
using different types of models.
Conclusions
This modelling study suggests that the risk of an outbreak in a previously COVID-19-free country is extremely
dependent on the source country of the incoming travellers. In the situation of Australia experiencing a large
outbreak, the risk could potentially be reduced to tolerable levels with a package of multi-layered interventions
(particularly with repeated testing and mask use) and no quarantine. Nevertheless, quarantine is likely to remain
important where the source country has high disease burdens. However, all approaches require public and policy
deliberation about acceptable risks, and continuous careful management and evaluation.
Received: 26 June 2020; Accepted: 28 April 2021
References
1. Burns, J. et al. Travel-related control measures to contain the COVID-19 pandemic: A rapid review. Cochrane Database Syst. Rev.
10, CD013717, https://doi.org/10.1002/14651858.CD013717 (2020).
2. Baker, M., Wilson, N. & Blakely, T. Elimination may be the optimal response strategy for covid-19 and other emerging pandemic
diseases. BMJ 371, m4907. https://doi.org/10.1136/bmj.m4907 (2020).
3. Wilson, N., Boyd, M., Mansoor, O., Delany, L. & Baker, M. Expansion of “green zones” may provide a chance for the global eradica-
tion of COVID-19. In Public Health Expert 2021. https://blogs.otago.ac.nz/pubhealthexpert/expansion-of-green-zones-may-provi
de-a-chance-for-the-global-eradication-of-covid-19/. Accessed 18 Mar 2021.
4. Radio New Zealand. Trans-Tasman Travel: Date for Bubble to be Announced on 6 April-Ardern. (Radio New Zealand, 2021). https://
www.r nz.c o.n z/n
ews/p oliti cal/4 38900/t rans-t asman-t ravel-d
ate-f or-b
ubble-t o-b e-a nnoun ced-o n-6-a pril-a rdern. Accessed 22 Mar
2021.
5. Gillespie, D. A general method for numerically simulating the stochastic time evolution of coupled chemical reactions. J. Comput.
Phys. 22, 403–434 (1976).
6. Wilson, N. et al. Modelling the potential health impact of the COVID-19 pandemic on a hypothetical European country. medRxiv
(2020). https://medrxiv.org/cgi/content/short/2020.03.20.20039776v1. Accessed 23 Mar 2020.
7. Wilson, N., Telfar Barnard, L., Kvalsvig, A. & Baker, M. Potential Health Impacts from the COVID-19 Pandemic for New Zealand If
Eradication Fails: Report to the NZ Ministry of Health. (University of Otago Wellington, 2020). https://www.health.govt.nz/system/
files/documents/publications/report_for_moh_-_covid-19_pandemic_nz_final.pdf (2020).
8. Wilson, N., Blakely, T., Baker, M. G. & Eichner, M. Estimating the risk of outbreaks of COVID-19 associated with shore leave by
merchant ship crews: Simulation studies for New Zealand. N. Z. Med. J. 134, 26–38 (2021).
9. Wilson, N. et al. When can elimination of SARS-CoV-2 infection be assumed? Simulation modelling in a case study island nation.
medRxiv (2020). https://medrxiv.org/cgi/content/short/2020.05.16.20104240v1. Accessed 20 May 2020.
10. Wilson, N. et al. Detecting the re-emergent COVID-19 pandemic after elimination: Modelling study of combined primary care
and hospital surveillance. N. Z. Med. J. 133, 28–39 (2020).
11. IATA. Restarting aviation following COVID-19: Medical evidence for various strategies being discussed as at 25 May 2020 IATA
Medical Advisory Group. https://www.iata.org/contentassets/f1163430bba94512a583eb6d6b24aa56/covid-medical-evidence-for-
strategies-200525.pdf.
12. Statistics New Zealand. International Travel: January 2020. https://www.stats.govt.nz/information-releases/international-travel-
januar y-2020. Accessed 16 March 2020.
13. Freedman, D. O. & Wilder-Smith, A. In-flight transmission of SARS-CoV-2: A review of the attack rates and available data on the
efficacy of face masks. J. Travel Med. 27, https://doi.org/10.1093/jtm/taaa178 (2020).
14. World Health Organization. Coronavirus Disease 2019 (COVID-19) Situation Report—71. (2020). https://a pps.w ho.i nt/i ris/h
andle/
10665/331684.
15. World Health Organization. WHO Coronavirus Disease (COVID-19) Dashboard. (2021). https://covid19.who.int/. Accessed 25
Feb 2021.
16. OECD. OECD Population Data. https://data.oecd.org/pop/population.htm. Accessed 26 Feb 2021.
17. The Economist. Tracking covid-19 excess deaths across countries. Economist. (2021). https://www.economist.com/graphic-detail/
coronavirus-excess-deaths-tracker. Accessed 23 Feb 2021.
18. Centers for Disease Control and Prevention. COVID-19 pandemic planning scenarios. (2020). https://www.cdc.gov/coronavirus/
2019-ncov/hcp/planning-scenarios.html. Accessed 10 Sep 2020.
19. WHO-China Joint Mission. Report of the WHO-China Joint Mission on Coronavirus Disease 2019 (COVID-19). (2020). https://
www.w ho.i nt/d
ocs/d
efaul t-s ource/c orona virus e/w
ho-c hina-j oint-m
issio
n-o
n-c ovid-1 9-fi
nal-r eport.p
df. Accessed 16–24 Feb 2020.
Scientific Reports | (2021) 11:10766 | https://doi.org/10.1038/s41598-021-89807-y 8
Vol:.(1234567890)www.nature.com/scientificreports/
20. Woelfel, R. et al. Clinical presentation and virological assessment of hospitalized cases of coronavirus disease 2019 in a travel-
associated transmission cluster. medRxiv. (2020). https://doi.org/10.1101/2020.03.05.20030502v1. Accessed 8 Mar 2020.
21. Boger, B. et al. Systematic review with meta-analysis of the accuracy of diagnostic tests for COVID-19. Am. J. Infect. Control 49,
21–29. https://doi.org/10.1016/j.ajic.2020.07.011 (2021).
22. Yokota, I. et al. Equivalent SARS-CoV-2 viral loads by PCR between nasopharyngeal swab and saliva in symptomatic patients. Sci.
Rep. 11, 4500. https://doi.org/10.1038/s41598-021-84059-2 (2021).
23. Grout, L. et al. Estimating the failure risk of quarantine systems for preventing COVID-19 outbreaks in Australia and New Zealand.
medRxiv (2021). https://www.medrxiv.org/content/10.1101/2021.02.17.21251946v3 Accessed 6 May 2021.
24. Kucirka, L. M., Lauer, S. A., Laeyendecker, O., Boon, D. & Lessler, J. Variation in false-negative rate of reverse transcriptase
polymerase chain reaction-based SARS-CoV-2 tests by time since exposure. Ann. Intern. Med. https://doi.org/10.7326/M20-1495
(2020).
25. Star News. Auckland lockdown extended, rest of NZ to stay at level 2. Star News (2020). https://w ww.o dt.c o.n
z/s tar-n
ews/s tar-n atio
nal/auckland-lockdown-extended-rest-nz-stay-level-2. Accessed 24 Aug 2020.
26. Ministry of Health. 7 New Cases of COVID-19 (Media Release) (2020). https://www.health.govt.nz/news-media/media-releases/7-
new-cases-covid-19. Accessed 15 Aug 2020.
27. Flutracking. NZ participant annual report 2018. https://i nfo.fl utra cking.n
et/w
p-c onten
t/u
pload
s/2 020/0 2/N Z-p artic ipant-a nnual-
report-2018.pdf.
28. Hemmer, C., Hufert, F., Siewert, S. & Reisinger, E. Protection from COVID-19: The efficacy of face masks. Dtsch. Arztebl. Int.
https://doi.org/10.3238/arztebl.m2021.0119 (2021).
29. Kiang, M. V. et al. Routine asymptomatic testing strategies for airline travel during the COVID-19 pandemic: A simulation study.
Lancet Infect. Dis. https://doi.org/10.1016/S1473-3099(21)00134-1 (2021).
Acknowledgements
Professor Wilson is supported by the New Zealand Health Research Council (16/443) and Ministry of Business
Innovation and Employment (MBIE) funding of the BODE3 Programme (UOOX1406). Professor Michael Baker
is supported by a New Zealand Health Research Council grant for research on COVID-19 (20/1066).
Author contributions
N.W., M.E. and T.B. designed the study in its upgraded final form. N.W. collected the parameters with additional
input from T.B. and M.E. M.E. wrote the code and performed the modelling. All authors contributed to revising
the text of the manuscript.
Competing interests
The authors declare no competing interests.
Additional information
Supplementary Information The online version contains supplementary material available at https://doi.org/
10.1038/s41598-021-89807-y.
Correspondence and requests for materials should be addressed to N.W.
Reprints and permissions information is available at www.nature.com/reprints.
Publisher’s note Springer Nature remains neutral with regard to jurisdictional claims in published maps and
institutional affiliations.
Open Access This article is licensed under a Creative Commons Attribution 4.0 International
License, which permits use, sharing, adaptation, distribution and reproduction in any medium or
format, as long as you give appropriate credit to the original author(s) and the source, provide a link to the
Creative Commons licence, and indicate if changes were made. The images or other third party material in this
article are included in the article’s Creative Commons licence, unless indicated otherwise in a credit line to the
material. If material is not included in the article’s Creative Commons licence and your intended use is not
permitted by statutory regulation or exceeds the permitted use, you will need to obtain permission directly from
the copyright holder. To view a copy of this licence, visit http://creativecommons.org/licenses/by/4.0/.
© The Author(s) 2021
Scientific Reports | (2021) 11:10766 | https://doi.org/10.1038/s41598-021-89807-y 9
Vol.:(0123456789)You can also read