Changing the mix for the sake of sustainability? - Dr Joe Larragy, Maynooth University - Pension Policy ...

Page created by Stacy Baker
 
CONTINUE READING
Changing the mix for the sake of sustainability? - Dr Joe Larragy, Maynooth University - Pension Policy ...
Changing the mix for the sake of
        sustainability?
    Dr Joe Larragy, Maynooth University
  Presentation to the Pension Policy Research
    Group Conference, Aras an Phiarsaigh,
     Trinity College Dublin, 6 October 2017
Changing the mix for the sake of sustainability? - Dr Joe Larragy, Maynooth University - Pension Policy ...
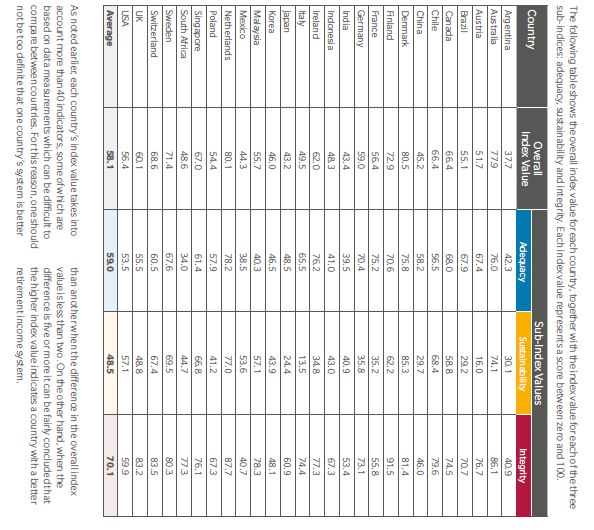
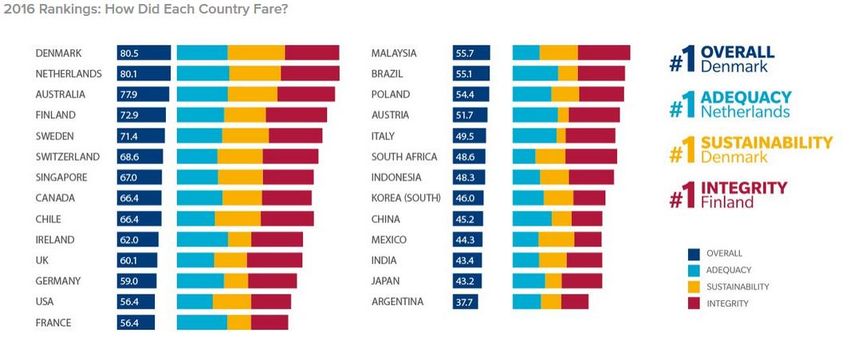
Ireland
gets 62%
Overall in the
Melbourne
Mercer Global
Pension Index
2016
Changing the mix for the sake of sustainability? - Dr Joe Larragy, Maynooth University - Pension Policy ...
3 sub
 indices
• Ireland ranks well
  on Adequacy
  (76%)
• & Integrity
  (77.3%)
• But poorly on
  sustainability
  (34.8%)
Changing the mix for the sake of sustainability? - Dr Joe Larragy, Maynooth University - Pension Policy ...
Comparative performance on sub-indices

• Melbourne
  Mercer
  Global
  Pension
  Index
  2016
Changing the mix for the sake of sustainability? - Dr Joe Larragy, Maynooth University - Pension Policy ...
Sustainability? More than demographics
               Claims about Ireland's ‘demographic crisis’ are
                               commonplace
         The Melbourne index score of 34.8% for sustainability might
                    seem to confirm these statements

                     In fact, nothing could be less true!

          We need to drill deeper into the sustainability sub-index
Indicators for sustainability sub-index score (IR)
Sustainability indicators               Weight Score verdict

Proportion of working age population in private pension plans 20%      23%     Poor

Pension assets (priv., + pub. res. fund) / (GDP)%               20%    31%     Poor

Mandatory ER/EE contributions (% of pay) set aside for
                                                                 15%   0%      ??/!!
(funded) retirement benefits (public/social security or private)
                                                                             Below av.
LFPR, aged (55-64) and LFPR (65+)                               10%    43%
                                                                               (55)
Adjusted government debt /GDP%                                  10%    28%     Poor
Access of older workers to savings/pension? While continue                   Good in
                                                                5%     60%
working? Can continue to accrue benefits?                                     parts

Demographic sub index                                           20%    70%    v. good
Demographic indicator includes

               Projected gap
  The gap                                       Total fertility
                  in ditto in     Projected
between life                                        rate,
                     2035          old-age
expectancy                                        averaged
               (adjusted for    dependency
 and state                                      over the past
               expected fall    ratio in 2035
pension age                                        7 years
                in mortality)
Ireland in the Mercer global pension index

   Factors       • Low participation in voluntary pension
  negating         schemes
                 • Low value of pension assets as % of GDP
sustainability   • No mandatory, funded (social security or
   of Irish        private) future benefits
                 • High national debt / GDP ratio;
  pensions:
Adaptation of the pension system in Ireland
• Major changes in state pension age underway
   • State retirement/transition pension at 65 abolished 1 January 2014
   • SPA from 66 to 67 years in 2021
   • SPA to 68 in 2028
• Instead, Jobseekers benefit (JB) or allowance (JA)
• must actively seek work (but not as actively as others!)
• No obligation on Employers to raise default retirement age of 65
How many are potentially affected?
          Over 153,000 in this age group by 2028
                    Growth of the 65-68 age group 2011-2026
                                                                                                           2011     2014 #        *2021        **2028
155,000
                     65 years    66 years   67 years                                     Persons                             projected projected
                                                                                                    2011          2016
                                                                                                                             2021      2026
135,000
                                                                           48,693        65 years
                                                                                                      39,558       43,197
115,000                                                   44,160
                                                                                                                                 46,840         53,431
                                              41,590
                                                                                         66 years
                                                                                                      36,249       42,391
 95,000
                                                                                                                                 46,419         51,165
                                  34,386
                                                                                         67 years
                                                                                                      34,386       41,590
 75,000                28,404
                                                                           51,165                                                44,160         48,693
                                                          46,419
           26,732
                                                                                         Number
                                  36,249
                                              42,391
                                                                                         affected
                                                                                                                   41,590        93,259       153,290
 55,000
                       29,751
           27,471
 35,000
                                                                                                                  # census    * Projected   **projected
                                                                           53,431                                   2016         (2021)       (2026)
                                              43,197      46,840
                                  39,558
 15,000    28,552      29,930

 -5,000    2002         2006       2011       2016     projected 2021   projected 2026
What was the rationale offered for the
changes? Population ageing

       Very strong rhetoric on unsustainable state pension – and private pensions – based on
                   demographics – but no data provided (McCarthy Report 2009)

      In reality, this panicked approach was part of a response to the bank collapse and ensuing
                       collapse of state finances rather than changed demographics

       The sustainability of the State pension was largely down to rising state debt post 2008
                                    rather than population ageing

         Little attempt to distinguish between private pension crisis and state pension issues
Some questions:
1. Is Ireland particularly vulnerable to
demographic ageing?

    Not by                       Age ratio     … now and
                Percent > 65
international                  (65+/15-64)    projected for
                lowest in EU
  standards:                   lowest in EU       2060
Ireland (13.2% over
                    65 years)                                             Pop aged 65-79 and 80+ (recent years) -- Eurostat
25
                    lowest in EU and
                    among lowest in EEA
20

                                                                                                                                                                           5.4
15

                                    3.1

10

                                                                                                                                                                           13.8

5                                   10.1

0
     AZ   XK   TR    AM   AL   MK    IE    IS   ME   GE   LU   SK   CY   PL   NO   LI   RO   UK   CH   NL   BE   CZ   HU   SI   AT   ES   DK   FR   EE   LT   MT   RS   HR EU28 LV   SE EA18 EA19 BG   FI   PT   DE   EL   IT

                               Ireland’s 65+ population is 13.2%, compared to EU average of 19.2% (Eurostat)

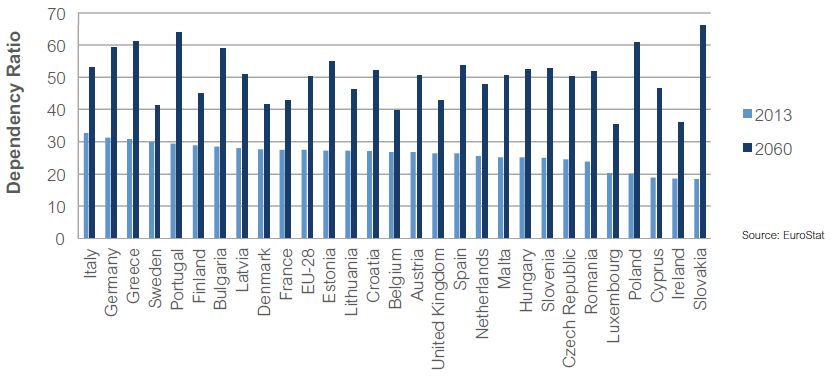
           http://ec.europa.eu/eurostat/statistics-explained/index.php/Population_structure_and_ageing
European dependency ratios in 2013 and 2060 (EU28)

                                            • Ireland has lowest
                                              old age dependency
                                              now and projected
                                              to 2060 in EU28
                                            • Old dependency
                                              ratio (65+/15-64)
                                            Now:
                                            • 20% in IE
                                            • 29% in EU
Is Ireland just doing the same as most countries?
• Raising retirement is happening in many countries but there are
  different ways to approach this
• Ireland is forcing an accelerated increase, from comparatively high
  base (66 in 2014) to 68 over 14 years.
• The method - push up state pension age to 68 years, and deal with
  the fallout afterwards
Disincentives in the current approach

                                  Disincentive to work:
 Ireland makes Jobseekers
                              Jobseekers benefit is subject
Benefit / Allowance (JB/JA)                                   The new policy is all stick
                                 to withdrawal per day
 the default from 65 to SP                                         and no carrot.
                               worked, it is a disincentive
             age
                                     to employment
Poverty increases under the current approach
             SW Benefit                  Single person Couple adult Couple adult
                                              (€)      dep >66 (€) dep
More flexible retirement age is just as important
as later exit from employment

                                  Large variations in
    Making it easier for          life expectancy by
   those who can, and             social class are good
      removing the                predictors of ability
  obligation from those           to work longer
    who cannot, work              • Some evidence on these
   longer, makes sense              variations follows in next
                                    slide
Variations in Life expectancy (m) by social class
       at birth
         Inequality in life expectancy in England and                                England and
           Wales for males at birth, various periods                                 Wales
85.0
                                                                                     Males at birth 1982-86 1987-91 1992-96 1997-01 2002-06 2007-11

80.0
                                                                                     Relative Rank        LE     LE      LE      LE      LE      LE

75.0
                                                                                     Least advantaged   69.9   70.6    71.2    72.5    73.8    76.0

                                                                                     Most advantaged    75.6   76.8    78.3    80.0    81.1    82.7
70.0
                                                                                     Absolute
                                                                                     Inequality
                                                                                                         5.6    6.2     7.1     7.5     7.4     6.7
65.0

                                                                                            6.7 year difference in life expectancy at
60.0
                                                                                            birth (see ONS 2015 longitudinal study)
       1982-86    1987-91            1992-96   1997-01        2002-06      2007-11
                 Least advantaged               Most advantaged
                 Linear (Least advantaged)      Linear (Most advantaged)
Variations in Life expectancy (m) by social class at
       65 years
        Absolute Inequality in Life Expectancy at       England and Wales
           age 65 for males, various periods
                                                        Males at
5.0                                                                     1982-86   1987-91    1992-96    1997-01    2002-06    2007-11
4.5
                                                        age 65
4.0                                                     Relative Rank        LE         LE         LE         LE         LE         LE
3.5
                                                        Least
3.0
                                                        advantaged
                                                                           12.3       12.6       13.2       13.7       14.8       16.1
2.5

2.0                                                     Most
1.5                                                     advantaged
                                                                           15.3       16.1       17.1       18.5       19.2       20.5
1.0
                                                        Absolute
0.5
                                                        Inequality
                                                                            3.0        3.5        3.9        4.7        4.3        4.3
0.0

      1982-86 1987-91 1992-96 1997-01 2002-06 2007-11
                  Absolute Inequality                        (see ONS 2015 longitudinal study)
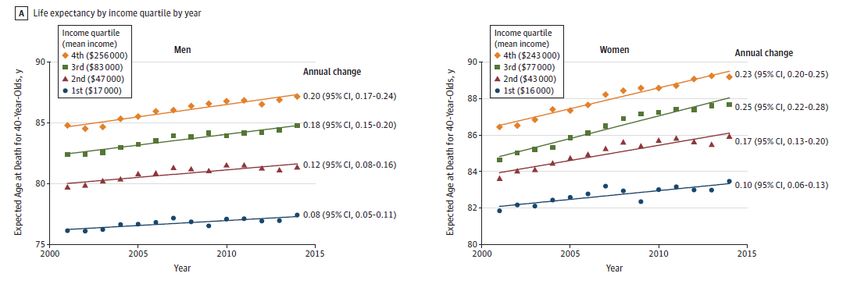
                  Linear (Absolute Inequality)
Life expectancy differences by income quartile in the
USA for 40 year old males and females
(Chetty et al. 2017)
Social class implies major differences in life
 expectancy, and implicitly in the ability to work
                      longer
                                                                          Earlier
 Fixed, higher                           Later
                                                                     retirement may
retirement age                        retirement
                         If life                                     be unavoidable,
  implies that                          may be
                  expectancy is a                                    e.g., on health
  people from                         preferable    These groups
                    predictor for                                       grounds in
  routine and                           among        can be more
                   disability-free                                      physically
     manual                          medium and     confident of a
                  life expectancy                                      demanding
  occupations                           higher      longer period
                    and working                                      occupations, or
    will face a                      managerial     of retirement
                      longer life                                       where the
   shorter life                           and
                        then…                                            financial
 expectancy at                       professional
                                                                       rewards are
        65                              groups.
                                                                          limited
Conclusion:
        why not consider measures to incentivise
            employment beyond 65 years?
                        Set a rate (over          Enhanced               Incentivise
Remove JB/JA as        the poverty line)          pension if             employers
   default             for early take-up       retiring beyond        offering flexible
                        SP until SP age               SPA                retirement

                          Restores incentive
       Because it                                 Creates incentive
                           to take up paid                               Win-win for jobs
   penalises take up                               to work beyond
                           work that JB/JA                                and welfare
    of employment                                       SPA
                               remove
You can also read