Residential Property Indices - Date Published: January 2020
←
→
Page content transcription
If your browser does not render page correctly, please read the page content below

Residential Property
Indices
Date Published: January 2020
National Inflation
Current annual inflation rate is 1.72% and monthly is 0.09%.
Market Review
The residential property market has been in consolidation for a while now through the presently slow economy. In 2019 the market
closed with an annual inflation rate of only 1.7% at national level. This is due to the observed low market activity as buyers find it
expensive to buy property in this economy.
In January 2020 the Monetary Policy Committee (MPC) announced a reduction in the benchmark interest rate by 25 basis points
to 6.25%, and that is positive news for the consumers’ budget. However, this is not enough to offset the rise in fuel costs,
electricity and other basic utility rates, and further stimulate market activity. We therefore expect the market to remain in
consolidation with a good chance of lesser growth and activity.
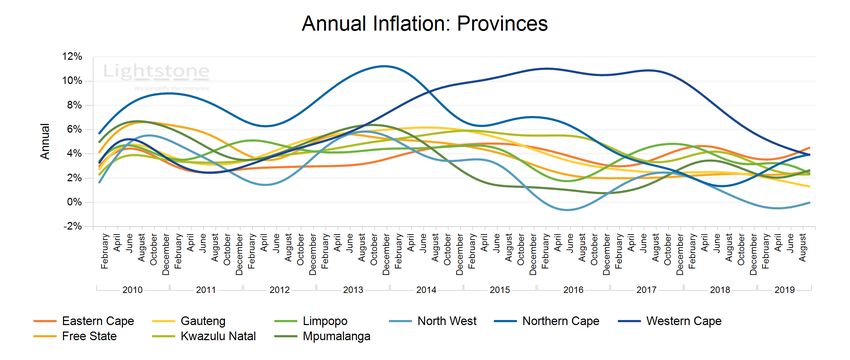
As the market currently stands, we see the slowdown across all segments. The western Cape, whose property market is hugely
dominated by the City of Cape Town municipality, has had a long streak of unrivalled performance but the recent slowdown has
seen it join the rest in consolidation. It has been and still is the best destination for semigrants but the sentiments are slowly
changing due to rising crime stats, the recent water crisis, local government uncertainties and looming competition along the east
coast.
Our inland municipalities Ekurhuleni, City of Tshwane and City of Johannesburg metros are growing stably at rates between 0%
and 3% whereas the coastal municipalities are generally performing above this range. This relationship extends to all coastal and
inland properties as shown by their respective indices. The Low and Mid value wealth segments continue to buck the trend by
growing at more than 4% annually whilst the rest are inflating at rates below that.
All content © Lightstone 2020 2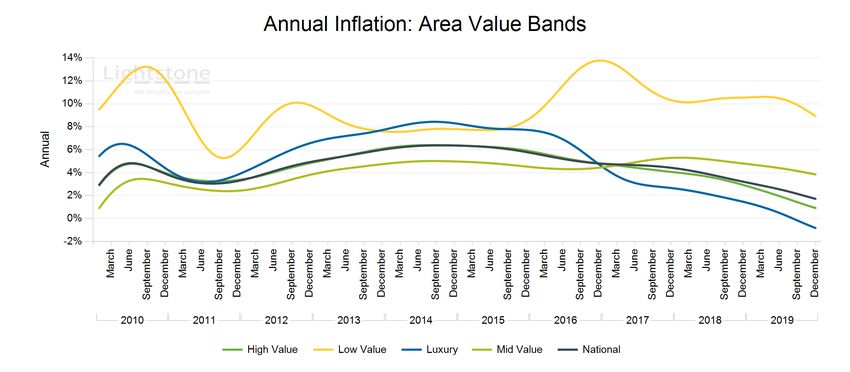
Provincial Inflation
The Lightstone Provincial Index tracks annual inflation of all provinces in South Africa.

              Latest/Current Provincial Inflation Status

                                                    2.4 %

                                     1.3 %

                                                                                             2.6 %
                                 0.0 %

                                                                                             2.3 %
                3.9 %

                                                                                     2.5 %

             3.9 %                                                    4.5 %

 All content © Lightstone 2020                                                                       3
Municipal Inflation The Lightstone Municipal Index tracks annual inflation at a municipal level, with coastal and inland based municipalities reviewed independently. All content © Lightstone 2020 4
Property Inflation: Coast vs Non-Coast
The Lightstone Coast vs Non-Coast Index compares property located within enumerator areas 500m of the coastline to those
located
further inland.

  All content © Lightstone 2020                                                                                        5
Property Inflation: Free Hold vs Sectional

All content © Lightstone 2020                             6
Property Inflation: Value Bands
The Lightstone Area Value Bands Index reviews inflationary rates for property based on the following values.
Luxury: > R1.5mil
High Value: R700k to R1.5mil
Mid Value: R250k to R700k
Low Value:
Property Inflation: Value Bands (continued)

All content © Lightstone 2020                              8
Inflation Table
The Annual Inflation Table (below) provides a long term view of annual rates of inflation for various geographical areas and
property types. Please note that historic inflation rates can change as transactions occur that imply price inflation for those
periods.

                                       2015     2016     2017     2018                                      2019

                                                                            Q1       Q2       Jul     Aug          Sep    Oct      Nov      Dec
                 National              5.8 %    4.8 %    4.4 %    3.2 %    2.9 %    2.5 %    2.4 %    2.3 %    2.1 %     2.0 %    1.9 %    1.7 %
Province         Eastern Cape          4.5 %    3.1 %    4.4 %    3.6 %    3.6 %    3.9 %    4.1 %    4.3 %    4.5 %
                 Free State            3.1 %    2.0 %    2.1 %    2.3 %    2.3 %    2.4 %    2.4 %    2.5 %    2.5 %
                 Gauteng               4.4 %    2.8 %    2.5 %    2.2 %    1.9 %    1.6 %    1.5 %    1.4 %    1.3 %
                 Kwazulu Natal         5.5 %    4.6 %    3.6 %    3.2 %    2.7 %    2.3 %    2.3 %    2.3 %    2.3 %
                 Limpopo               2.7 %    3.0 %    4.8 %    3.2 %    3.2 %    3.0 %    2.9 %    2.6 %    2.4 %
                 Mpumalanga            1.2 %    0.8 %    2.8 %    2.4 %    2.1 %    2.2 %    2.3 %    2.5 %    2.6 %
                 North West            0.6 %    0.7 %    2.3 %   -0.2 %   -0.5 %   -0.4 %   -0.3 %   -0.2 %    0.0 %
                 Northern Cape         7.0 %    4.5 %    2.4 %    2.1 %    2.9 %    3.6 %    3.7 %    3.8 %    3.9 %
                 Western Cape         11.0 %   10.5 %   10.1 %    5.7 %    4.9 %    4.4 %    4.2 %    4.1 %    3.9 %
Municipality     City Of Cape Town    12.5 %   11.3 %    9.8 %    4.7 %    3.9 %    3.5 %    3.4 %    3.4 %    3.3 %
                 City Of               4.4 %    2.5 %    2.0 %    1.7 %    1.2 %    0.7 %    0.6 %    0.4 %    0.3 %
                 Johannesburg
                 City Of Tshwane       5.1 %    3.4 %    2.7 %    2.3 %    2.2 %    2.2 %    2.2 %    2.2 %    2.3 %
                 Ekurhuleni            4.0 %    2.6 %    3.2 %    3.0 %    2.7 %    2.2 %    2.0 %    1.8 %    1.5 %
                 Ethekwini             6.2 %    5.3 %    3.6 %    3.8 %    3.4 %    3.1 %    3.0 %    3.0 %    2.9 %
                 Nelson Mandela Bay    5.0 %    3.9 %    3.7 %    4.6 %    4.1 %    3.6 %    3.5 %    3.5 %    3.4 %
Coastal          Coast                 7.5 %    6.5 %    6.7 %    3.9 %    3.7 %    3.7 %    3.7 %    3.7 %    3.7 %
                 Non-Coast             5.7 %    4.6 %    4.2 %    2.9 %    2.6 %    2.4 %    2.3 %    2.3 %    2.3 %
ST / FH          Free Hold             6.8 %    5.4 %    5.2 %    4.1 %    3.7 %    3.0 %    2.7 %    2.4 %    2.0 %     1.7 %    1.4 %    1.0 %
                 Sectional Title       5.0 %    4.1 %    3.5 %    2.4 %    2.0 %    1.8 %    1.7 %    1.7 %    1.7 %     1.7 %    1.7 %    1.7 %
Area Value       High Value            5.9 %    4.8 %    4.1 %    2.9 %    2.5 %    2.0 %    1.8 %    1.6 %    1.4 %     1.2 %    1.1 %    0.9 %
Bands
                 Low Value             8.5 %   13.8 %   10.3 %   10.5 %   10.6 %   10.5 %   10.3 %   10.1 %    9.9 %     9.6 %    9.3 %    8.9 %
                 Luxury                7.7 %    4.7 %    2.7 %    1.5 %    1.0 %    0.5 %    0.3 %    0.1 %   -0.2 %     -0.4 %   -0.6 %   -0.8 %
                 Mid Value             4.5 %    4.4 %    5.3 %    4.8 %    4.6 %    4.4 %    4.3 %    4.2 %    4.1 %     4.0 %    3.9 %    3.8 %

  All content © Lightstone 2020                                                                                                               9
Shining A Light On Our Approach...
Methodology:
Lightstone applies the repeat sales methodology when reviewing and reporting on property data.
In contrast to 'average house price' indices, repeat sales indices provide a measure of the actual
price inflation of houses that have transacted twice within a particular period of time. The main
benefit of this is that it is less influenced by the mix of transacting properties. The repeat sales
methodology is recognised as the premier methodology for indexing house prices and is used by
many international residential property price indexers including the Office of Federal Housing
Enterprise Oversight (OFHEO) in the United States.
Data:
All property transactions in South Africa are registered in the Deeds Office and each record
contains the legal details of both the property and the transaction. For the purposes of the Repeat
Sales Index for residential properties, the following transactions have been excluded: farms; any
transactions which may be of a development, commercial or community services nature; new
developments; sales made in execution of a judgement; non-arms-length transactions;
transactions where the inflation is extremely different to the norm of the statistical distribution of
inflation rates; and township transactions.
Caution:
Lightstone presents both annual and monthly inflation rates. Monthly inflation emphasises recent
market performance (i.e. month on month) and is more volatile than annual inflation trends.
Conclusions about the future trend of annual inflation, based on monthly inflationary rates, must
be made with caution.
Disclaimer:
The Lightstone Repeat Sales Index system applies advanced statistical methods to a
comprehensive property database - compiled from the Deeds Office, the Surveyor General and
other sources - to generate repeat sales inflation data for individual residential properties. Despite
the statistical and actuarial rigour applied, Lightstone cannot guarantee the accuracy and
reliability of the data. Furthermore, the index is a statistical tool and does not amount to advice
and may not be applicable in some cases. Lightstone does not take responsibility for any losses
incurred as a result of any person acting or omitting to act as a result of the publication of this
index.
Queries:
Should you have any queries, please do not hesitate to email us
info@lightstone.co.za or give us a call on 0860 106 389.
All content © Lightstone 2020 10You can also read