Chr. Hansen ESG presentation - March 2019

Page created by Amanda Morrison
 
CONTINUE READING
Chr. Hansen ESG presentation - March 2019
Chr. Hansen
ESG presentation
March 2019
Chr. Hansen ESG presentation - March 2019
Safe harbor statement
    ‒   This presentation contains forward-looking statements that reflect management’s current views with respect to certain future events and potential financial
        performance.
    ‒   Forward-looking statements are other than statements of historical facts. The words “believe,” “expect,” “anticipate,” “intend,” “estimate,” “outlook,” “will,”
        “may,” “continue,” “should” and similar expressions identify forward-looking statements.
    ‒   Forward-looking statements include statements regarding: objectives, goals, strategies, outlook and growth prospects; future plans, events or performance
        and potential for future growth; liquidity, capital resources and capital expenditures; economic outlook and industry trends; developments of the Company’s
        markets; the impact of regulatory initiatives; and the strength of competitors. The forward-looking statements in this presentation are based upon various
        assumptions, many of which are based, in turn, upon further assumptions, including without limitation, management’s examination of historical operating
        trends, data contained in records and other data available from third parties.
    ‒   Although the Company believes that these assumptions were reasonable when made, these assumptions are inherently subject to significant known and
        unknown risks, uncertainties, contingencies and other important factors which are difficult or impossible to predict and may be beyond our control. Such
        risks, uncertainties, contingencies and other important factors could cause the actual results of the Company or the industry to differ materially from those
        results expressed or implied in this presentation by such forward-looking statements.
    ‒   The information, opinions and forward-looking statements contained in this presentation speak only as at the date of this presentation, and are subject to
        change without notice. The Company and its respective agents, employees or advisors do not intend to, and expressly disclaim any duty, undertaking or
        obligation to, make or disseminate any supplement, amendment, update or revision to any of the information, opinions or forward-looking statements
        contained in this presentation to reflect any change in events, conditions or circumstances beyond what is required by applicable law or applicable stock
        exchange rules and regulations.
    ‒   By viewing this presentation, you acknowledge and agree to be bound by the foregoing limitations and restrictions.

2
Chr. Hansen ESG presentation - March 2019
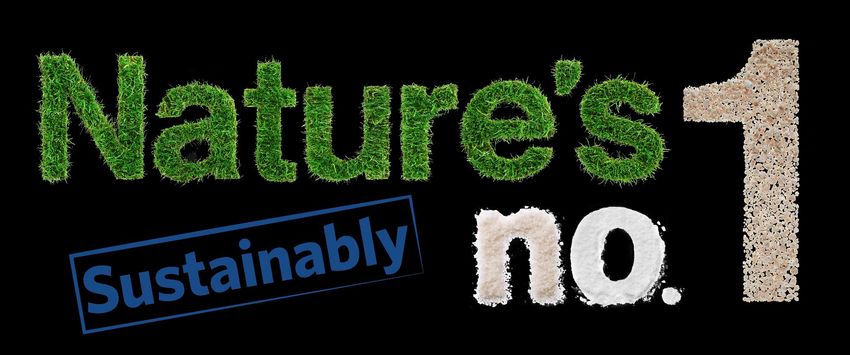
Corporate Knights named Chr. Hansen most
    sustainable company in the world in 2019
    ►   Independent ranking conducted by Canadian media and research firm
        Corporate Knights since 2005
    ►   Review of all publicly listed companies with >USD 1bn revenue worldwide
        (7,500 in total)
    ►   Screening based on 21 quantitative indicators
    ►   Chr. Hansen was named #1 because of the contribution of its product
        portfolio to the UN Global Goals and its reporting (‘100% score on clean
        revenue’)
    ►   Corporate Knights’ Global 100 index has outperformed MSCI All Country
        World Index since inception (2005-2018)

3
Chr. Hansen ESG presentation - March 2019
‒       Chr. Hansen

‒       ESG story 2017/18

                            Content
                             5 Business overview & sustainability strategy
                            19 Commercial highlights
                            32 Operational highlights
                            39 Governance
                            45 UN Global Goals mapping methodology
                            48 Other

    4
Chr. Hansen ESG presentation - March 2019
Business
        overview &
        sustainability
        strategy

    5

7
M
a
r
c
h
Chr. Hansen ESG presentation - March 2019
PURPOSE

    We deliver natural innovative solutions
    that address global challenges by
    advancing food, health, and productivity.

6
Chr. Hansen ESG presentation - March 2019
PURPOSE

    Sustainability is at the core of what we do

      Better farming               Good health                     Less waste

                                                                                          82%
         We help feed the          We improve global             We help customers
      growing population by          health through            reduce food waste and
      promoting sustainable        healthier and more            improve yield and
           agriculture.              safe products.                productivity.

                                                                                               of Chr. Hansen’s revenue
                                                                                          contributes to the UN Global Goals
     Operational foundation
                                                                                                  - reviewed by PWC

            Workplace         Climate and        Business and       Human rights and
           responsibility     environment      product integrity   responsible sourcing

7
Chr. Hansen ESG presentation - March 2019
BUSINESS OVERVIEW

    We are market and technology                                                                                   Dairy cultures
                                                                                                                   incl. probiotics

    leaders in our core business                                                                                                          Dairy
                                                                                                                                          enzymes

                                                                                                                                                 Meat, wine &
                                                                                                                                                 fermented beverages
                                                                                    Food Cultures & Enzymes

                                                                                                     59%
                                                                                                Share of revenue

                                                                                                                                                      Bioprotection

               Shared R&D platform –
               the Microbial Platform
                                                                               Natural Colors Health & Nutrition
    Food Cultures & Enzymes and Health &
    Nutrition share a common research
    platform, and production method.
                                                                                   20%
                                                                                  Share of revenue
                                                                                                                   21%
                                                                                                              Share of revenue
                                                                                                                                               Human Health
    The R&D platform is a process of
                                                                                                                                               & Microbiome
    screening, developing and upscaling of         Confectionery
    microbes. Production is the optimization        & ice cream
    of recipes, flows and infrastructure for the
    fermentation of microbes.
    Together: The Microbial Platform.                         Dairy & fruit                                                           Animal Health
                                                              preparation
                                                                              Prepared                                Plant Health
                                                                                food
8                                                                                               Beverages
Chr. Hansen ESG presentation - March 2019
GLOBAL CHALLENGES

    Finding solutions to society’s most pressing challenges
    drives our daily business
             Growing world population
                                                  Need for innovation to improve productivity & reduce food waste
             and resource scarcity

             “Real foods” and consumerism         Optimization of recipes to meet clean label demands

             Aging population and
                                                  Need for cheaper and preventive solutions
             increasing health care costs

             Urbanization and industrialization   Enhanced value of potential markets

             Technology breakthroughs             Scientific evidence of benefits from good bacteria

9
Chr. Hansen ESG presentation - March 2019
OUR PRODUCTS

     We develop natural solutions that help to reduce sugar, ensure food
     safety, improve health, replace artificial ingredients and much more!

                                                                       SAFEPRO® cultures help to keep
                                                                            meat safe from Listeria

        NOLA® Fit reduces added sugar in yogurt by 2g                                                               Replace artificial ingredients with our e-number free
           per 100g yogurt without losing sweetness                                                                   labeling coloring foodstuffs range FRUITMAX®

      QUARTZO® and PRESENCE® are probiotic plant                                                                    LGG® has been studied in +300 clinical studies that
      health solutions that help sugar cane and other crops                                                         indicate that the strain may have beneficial effects on
                fight off attacks from nematodes                                                                            immune and gastrointestinal functions

                                                              With CHY-MAX® dairies can increase cheese output
                                                              by 0.5% compared to other coagulants (i.e. 100 tons
                                                                 in case of a production volume of 20,000 tons)

10
OUR PRODUCTS

     We help make dairy farming more efficient!

       An average dairy sources
       300,000 tons milk to
       produce
       • 20,000 tons cheese
       • 100,000 tons yogurt.

       Using Chr. Hansen’s
       products can potentially
       reduce CO2 emissions                  MORE MILK using       MORE CHEESE using       MORE YOGURT using
       equivalent to 2,000                    BOVAMINE®               CHY-MAX®                 FRESHQ®
       average UK households.
                                           13,200 tons more milk   1,000 tons saved milk   5,000 tons saved milk
                                             ≈ 20,000 tons CO2        ≈ 1,500 tons CO2        ≈ 7,500 tons CO2

     Source: Grain and IOP Science 2017.

11
STRATEGY

     Our Nature’s no.1 strategy: evolution since 2013 – now Sustainably

                                FOCUS AREAS                         FOCUS AREAS                          FOCUS AREAS
                          FOOD CULTURES & ENZYMES                HEALTH & NUTRITION                     NATURAL COLORS

                                   Leverage the                       Develop the                             Create
                                   full potential                  microbial platform                      further value
     Drive penetration    Continue to prioritize core dairy   Drive new products for Human         Expand FruitMax® range of
                          business                            Health (incl. Microbiome) and        coloring foodstuffs
     of new innovation                                        Animal Health
                          Develop adjuncts and adjacencies
                                                              Invest in Plant Health platform to
                          Drive Bioprotection lighthouse to   unlock potential of EUR 100m by
                          EUR 200m by 2025                    2025

     Reinforce position   Further strengthen global market    Human Health: Expansion into         Drive US conversion and secure
                          presence                            emerging markets and growth          APAC growth
     in growth markets                                        segments
                          Application support in core
                          adjacencies                         Strengthen route-to-market in Ag
                                                              businesses

     Generate fuel        Drive scalability in supply chain   Reinvest in future growth            Continue drive to restore
                                                                                                   profitability
     for growth           Digitalize core processes

12
STRATEGY

     With our lighthouses we commit to deliver tangible results by 2025

                                                   Bioprotection                              Designated as
                                                   Bacterial solutions for food safety and    lighthouse in 2016
                                FOOD CULTURES
                                  & ENZYMES        freshness – target of EUR 200m by 2025

                                                   Plant Health                               Designated as
                                                   Bacterial cultures for crop protection –   lighthouse in 2013
                              HEALTH & NUTRITION
                                                   target of EUR 100m by 2025

                                                   Human Microbiome                           Designated as
             Lighthouse                            Next generation bacteria for               lighthouse in 2013
          Potential revenue                        Human Health
            of minimum
         EUR 100m per year

13
FINANCIAL PERFORMANCE

     Steady delivery since the IPO with investments in long-term growth
     Revenue, EUR m/EBIT margin and ROIC, %                                                     Capex and R&D investments, EUR m and % of revenue

                                                                                                EUR500m                                                                   10,0%       9,8%
                                                                                                Spent on R&D
                                                                                                  since IPO                       9,6%

                                                                                                                       9,1%
                                                                    39,7%     40,1%                  EUR650m
                                                        37,6%                           38,0%         Reinvested in
                                   34,3%     34,9%                                                   capex since IPO                                            8,2%
                           34,1%                                                                                                           8,3%
                                                                                                                                                     8,2%
                30,0%
        26,5%
                                                                    28,2%     28,9%     29,2%               7,1%
                                   26,1%     27,1%      27,1%
        25,3%   25,0%      25,6%                                                                    7,0%
                                                                                                                                                                                       7,3%
                                                                                                                                                                7,1%        7,0%
                                                                                                                       6,7%
                                                                                                               6,3%                                   6,4%
                                                                                                                                  6,1%    6,1%
                                                                                                    5,9%
         552    636         699    738        756           859      949      1.063     1.097      33 39                                                                             80 108

        09/10   10/11      11/12   12/13     13/14          14/15   15/16     16/17     17/18      09/10       10/11   11/12      12/13   13/14      14/15      15/16      16/17      17/18

                        Revenue        EBIT margin b.s.i.           ROIC ex. Goodwill                          R&D        Capex           Capex in % of sales           R&D in % of sales

14
FINANCIAL PERFORMANCE

     Three complementary businesses with strong fundamentals

                  FOOD CULTURES & ENZYMES                     HEALTH & NUTRITION                         NATURAL COLORS

                             46,2%    47,1%   45,6%
                                                      42,7%   42,4%
     ROIC ex.        40,3%
     goodwill
          34,6%
                                                                        30,6%           31,0%
     EBIT                                                                       29,8%                                    30,3%
                             34,3%    34,5%   34,3%           33,3%
     margin                                           33,0%
                     31,5%                                                                      26,2%           25,8%
          30,2%                                                                 29,2%   29,0%                                     24,6%
                                                                      28,3%
                                                                                                        17,4%
         Organic
         revenue
         growth
                                                                                                13,0%                    12,9%    12,0%
                                                                                                                10,9%
                                                                                                        8,3%
           8%         9%      12%       9%    12%     15%     13%      2%       14%      8%      1%      9%      19%      10%      5%

          13/14      14/15   15/16    16/17   17/18   13/14   14/15   15/16     16/17   17/18   13/14   14/15   15/16     16/17   17/18

                       59% of Group sales                       21% of Group sales                        20% of Group sales

15
LONG-TERM FINANCIAL AMBITION

     We will continue to pursue profitable growth through 2021/22
     Long-term financial ambition

           8-10% organic growth                                                                30+% EBIT margin b.s.i.                                              1                      +10% CAGR FCF b.s.i.a.                               1
                   with 7-8% organic growth in FC&E

     Outlook 18/19 (as per Jan 17, 2019)2

                                         9-11%                                                                            Around 29.5%                                                                     Around the same
                        FC&E above long-term ambition;                                                                                                                                                 level as 17/18 (EUR 196m)
                         H&N 10% or above; NCD 6-9%

     1Before special items (and acquisitions).
     2Based on constant currencies and stable raw material prices, and assumes no acquisitions. The outlook is also based on the current political and economic environment, although there is a risk of increased political and economic
     uncertainty – e.g. the economic climate in the Middle East and Latin America, the risk of a ‘hard’ Brexit and trade tensions between large economies. Any deterioration in these situations might impact the outlook. FCF guidance
     assumes lower growth in cash flow from operating activities than growth of EBIT before special items, due to a higher level of taxes to be paid in 2018/19, mainly related to the absence of acquisition-driven tax benefits realized in
16   2017/18. Cash flow used for operational investment activities will be at a relatively high level, and is expected to be between EUR 110-130 million. This includes multiple investments across the group, and also assumes a successful
     sale-and-lease-back of the company’s main site in Hørsholm in Q4 2018/19.
OUR APPROACH TO SUSTAINABILITY

     From farm to fork
     Our approach to sustainability is innovation led.
     Through pioneering science we provide our
     customers with effective, natural solutions
     throughout the entire value chain, from farm to
     fork.

     At the same time, by rethinking how we operate,
     we will reduce the environmental footprint of our
     own operations and work with our suppliers to
     help spread best practice throughout our supply
     chain.

     We also know that creating systemic change
     requires strong partnerships. To maximize our
     sustainability efforts we will work with key
     stakeholders and partners, including on pre-
     commercial innovation, to achieve collaborative
     success.

17
OUR SUSTAINABILTY TARGETS

     Developing sustainable solutions whilst keeping the house in order
                        Target dimensions                          Goal                                                            KPI                                          Progress 17/18           Target 21/221

                                Better farming                     Expand reach of natural plant solutions                         Hectares of farmland treated (cumulative)2    6.7m hectares           25m hectares
          Commercial

                                Good health                        Launch new products with a                                      Number of products (cumulative)                 3 products             6 products
                                                                   documented health effect

                                Less waste                         Reduce global yogurt waste                                      Tons of yogurt saved (cumulative)3               0.4m tons             1.2m tons

                                Workplace                          Improve work safety                                             LTIF4                                                2.46                 ≤1.8
                                responsibility                     Increase diversity of workforce                                 % of diverse corporate teams5                        78%                  80%
                                Climate and                        Reduce environmental footprint in:
                                environment                                      Energy                                            Efficiency in % compared                              9%                  20%
          Operational

                                                                                 Water                                             to base year 13/146                                   6%                  20%
                                                                                 CO2                                                                                                    22%                  25%
                                                                                 Waste recycled                                                                                         42%                  40%
                                Business and                       Ensure fair, transparent and ethical standards of Completion of Code of Conduct training                             99%                 100%
                                product integrity                  business conduct

                                Human rights and                   Respect human rights and ensure responsible                     On site sustainability assessment of high    Supplier requirements
                                                                                                                                                                                 and internal training
                                responsible sourcing               practices in supply chain                                       risk suppliers
      1 For better farming the target is to be reached by 24/25.
      2 Based  on sales numbers and application rates of Plant Health solutions and silage inoculants.
      3 Based on 7 days extended shelf life and sales numbers for FreshQ®.
      4 Frequency of Lost Time Incidents per million working hours.

18    5 Defined as corporate management teams reporting to VP level and above that include at least one woman and one non-local.
      6 Efficiency relative to production units.
Commercial
         highlights

    19

7
M
a
r
c
h
Microbial plant health
                                                                                                                      solutions have the
                                                                                                                    potential to increase
                                                                                                                   crop productivity and
                                                                                                                    reduce fertilizer and
                                                                                                                 pesticide requirements
                              Better farming                                                                    by 20% within 20 years.1
                              Chr. Hansen contributes to more sustainable
                                                                                                                   Global challenges2
                              agricultural practice through plant probiotics
                              and silage inoculants.                                                                   The world will need to increase global agricultural outputs by a minimum of 70% by
                                                                                                                       2050
                                                                                                                       Population is expected to reach more than nine billion by 2050. That’s two billion more
     Million hectares of farmland treated with natural solutions                                                       people than today
     (cumulative)                                                                                                      Arable land is degraded and polluted as a result of improper use of fertilizers and
                                                                                                                       pesticides

                                                                                                                   Our solutions
                                                                                                                       Biological solutions for plant health can increase yield - even in harsh conditions
                                                                                                                       Silage inoculant products can reduce the waste of fodder for a typical EU dairy cow by
                                                                                                                       more than 15%
                                                                                                                       Our probiotic solutions help animals improve gut health and digestibility, which can
                                                                                                                       lead to weight gain, feed efficiency and reduce the need for antibiotics

                                                                                                                   Sustainability activities
               2,2             3,5             6,7                                             25
                                                                                                                       Five year grant from the Danish Development Agency DANIDA to expand Chr. Hansen
              15/16           16/17           17/18                                           24/25                    plant protection solutions to Africa, in partnership with CARE Denmark
                                                                                                                       Trials and testing of natural plant solutions to new crops and markets
     1 Source:   How Microbes can help feed the world, American Academy of Microbiology, 2012.
     2   Source: World Resources Institute, UN World Population Prospects, Food and Agriculture Organization.

20
BETTER FARMING

     Plant Health to unlock a potential of EUR 100m revenue by 2025
     Big and growing market                                                                       Ambitions of Plant Health

                   5% penetration of microbial                                                        ►   Today: On market primarily in South America (Brazil)
                   products in the industry

                   >10 % expected growth of the bio-                                                  ►   2019/20: Expansion in North America
                   pesticide industry towards 2021

                    2.5 % expected growth of the Crop                                                 ►   2024/25: Presence in all major geographies
                    protection industry towards 2021
                                                                                                      ►   Ramping up investments in capacity, discovery, and tech support
     Hectares harvested in existing vs. potential markets, 2015

                                           APAC               Latin                     Latin
     APAC               Latin                                 America                   America
                        America
                                      EU
       Sugarcane                                   Soybean                     Corn
         23m                                        108m                       119m
                                                                                                                                 EUR 100m
     North America                                                                                                           Unlocked potential by 2025
                               North America                            APAC          North America
                                                                                EU
      Source: Phillips McDougall, FaoStat, Markets&Markets.

21
BETTER FARMING

     Our recent alliance launches Quartzo and Presence have a nematocidal
     claim and effect

     Description              Bacillus based product                           Bacillus based product
                              Applied in-furrow or through drip irrigation     Applied as seed treatment before planting

     Applicable crops         Sugarcane, F&V, other                            Soybean, Corn, Cotton, beans, wheat

     Registration             Bionematicide                                    Bionematicide

     Benefits and yields      Root colonization                                Root colonization
                              Protection against nematodes and soil diseases   Protection against nematodes and soil diseases
                              Increase of plant robustness and yield           Increase of plant robustness and yield

                                 Chemical                                        Chemical
                               nematicide                                      nematicide
                                Untreated                                      Untreated

     Competing technologies      Chemicals                                        Chemicals
                                 GMO                                              GMO
                                 Biological                                       Biological

22
BETTER FARMING

     Consumers and regulators are demanding natural alternatives to
     antibiotics in livestock production
     Antibiotic resistance is one of the main                                      Regulators are increasing pressure &                                Probiotics for animals help improve
     threats defined by the WHO                                                    end consumers start to demand non-                                  feed efficiency and reduce need for
                                                                                   antibiotic-ever meat                                                antibiotics
                                                                                   Seasonal % of Birds fed Non-Antibiotic-Ever in the US
                                                                                                                                                                                    Bovamine®
                                                                                   45%                                                        42%
                                                                                                                                                                                    decreases
                                                                                                                                                                                    number of
                                                                                   40%

                                                                                   35%
                                                                                                                                                                                    health events
                                                                                   30%                                                                                              and increases
                                                                                   25%
                                                                                                                                                                                    milk yield for
     Deaths attributable to major causes annually (in        m)1                   20%
                                                                                                                                                                                    dairy cows
        2014        2050
                                                                                   15%

                                                                                   10%

                                                                                   5%

                                                                                   0%   5%
                                                                                     Jan Apr Jul Okt Jan Apr Jul Okt Jan Apr Jul Okt Jan Apr Jul Okt

      Cholera         Measles    Road traffic   Diabetes   Cancer   Antibiotical         2014                                              2017
                                  accidents                         resistance

      1 Source:   AMR Review (2014).

23
More than 100 trillion
                                                                                 bacteria live in and on our
                                                                                   bodies. They outnumber
                                                                                    human cells and play a
                                                                                 crucial role for our health.

                              Good health
                              Chr. Hansen contributes to global health
                              through its probiotics and healthy food                 Global challenges1
                              ingredients.                                                Global health spend is estimated at USD 6.5 trillion, with an expected growth rate of
                                                                                          5% until 2018
                                                                                          Worldwide, 12% of the population suffers from constipation. In some regions, the
     New products launched with documented health benefits (cumulative)                   prevalence of irritable bowel syndrome is as high as 23%
                                                                                          International scientists indicate that it is best for children to avoid artificial colors.
                                                                                          Therefore, many manufacturers are moving to natural colors

                                                                                      Our solutions
                                                                                          Our natural ingredients give food companies the opportunity to remove salt, sugar,
                                                                                          and fat without reducing taste or texture
                                                                                          Probiotic solutions for promoting health by strengthening gut balance and improve
                                                                                          respiratory infections
                                                                                          We are investing heavily in research of human microbiomes and its therapeutic
                                                                                          potential towards metabolic, gastrointestinal and other diseases
                                                                                          We enable customers to replace artificial ingredients with natural colors, vegetable
                                                                                          concentrates and juices
            1                2                  3                         6
                                                                                      Sustainability activities
          15/16            16/17            17/18                        21/22
                                                                                          Impact study on the potential positive effect of probiotics is initiated. Initial results are
     1
                                                                                          expected during 2019
         WHO, IFFGD, Prescrire International.

24
GOOD HEALTH

            Probiotics remains an attractive market with strong fundamentals

            Positive fundamentals in probiotic dietary supplements                           Changing market dynamics

            ►   The market for probiotics keeps outgrowing adjacent categories
            ►   CAGR expectations 2002-2021
                                                                                             Key market dynamics               Our position
                   ►   OTC: 4.4%
                   ►   Vitamins: 4.9%
                                                                                             Growth increasingly driven by     Strong presence and growth in
                   ►   Dietary Supplements: 6.5%
     7000                                                                                    emerging markets                  emerging countries

     6000                                                                        8%
            Global probiotics                                                                KOLs1, medical professionals      Chr. Hansen offers the best
     5000
            market growth                                                                    consumers increasingly aware of   documented strains in the
                                                                                             microbiome and probiotics         highest quality
     4000

                                                   11%
     3000
                                                                                                                               Current customers adapting to
                                                                                             Rapid online channel migration    new channels at varying speed
     2000                                                                                                                      and success

     1000
                                                                                             Proliferation of undocumented
                                                                                                                               Helping our customers
                                                                                             products confusing consumers in
                                                                                                                               differentiate and educate KOLs1
       0
                                                                                             some markets
            2005                                                     2017             2021
                Organic Growth CAGR

            1Key Opinion Leaders (KOL).
            Source: Euromonitor and management estimates.

25
GOOD HEALTH

     We educate customers on the functional benefits of probiotics and the
     value of scientific documentation
     Potential beneficial effects on immune and gastrointestinal function1
     LGG®                                                                                                             May reduce respiratory tract challenges             Hatakka et al. 2001, Hojsak et al. 2010a
          The world’s best documented probiotic strain
          Used in food and dietary supplements since 1990                                                             May enhance the immune response                     de Vrese et al. 2005

          Described in more than 1,000 scientific publications                                                        May alleviate symptoms of irritated skin            Pärtty et al. 2013
          Studied in more than 300 clinical studies
                                                                                                                      May reduce crying and fussiness in infants          Isolauri et al. 2000

     BB-12®                                                                                                           May reduce the risk of an upset stomach             Chouraqui et al. 2004; Saavedra et al. 1994
          The world’s best documented Bifidobacterium
          Used in food and dietary supplements since 1985                                                             May enhance the immune response                     Holscher et al. 2012; Schiffrin et al. 1997

          Described in more than 307 scientific publications                                                          May reduce respiratory tract challenges             Smith et al. 2013; Taipale et al. 2011
          Studied in more than 180 clinical studies
                                                                                                                      May support bowel function                          Matsumoto et al. 2001; Pitkälä et al. 2007

                                                                          Lactobacillus                                                                 Bifidobacterium
                                                                          rhamnosus                                                                     (BB-12®)          Culture bank of
                                                                          (LGG®)                                                                                          +30,000 strains
                                                                                                                                                                          3 out of the 4
                                                                                                                                                                          best documented strains
                                                                                                                                                                          in our library

     1   Selection of scientific studies as per April 2017 (LGG®) and Feb 2016; for more details refer to Chr. Hansen website.

26
GOOD HEALTH

     Human Health to focus on launch of new products

                                                                                 1   Microbiome is creating new opportunities within
                                                                                     conventional strains and existing end markets
                                               2
                                                                Long term            Infants in hospitals   Reduce risk of gastrointestinal complications
                         Pharma

                                          Novel uses for     potential but not
                                         existing bacteria       a current
                                       (partnership model)   investment focus        Infant:                Support infant gut microbiome for healthy
                                                                                                            development
     End market

                                                                                     Adult:                 Promote intestinal integrity

                                                                                     Women:                 Rebalance a healthy vaginal microbiome
                  & Infant Nutrition

                                                1
                    Supplements

                                                                Opens new
                                                              segments such
                                           Existing            as metabolic
                                         Human Health                            2   Recent partnership with Prota Therapeutics to treat
                                                              and skin health
                                           business                                  peanut allergy with LGG®

27
Dairy provides a vital
                                                                               opportunity to reduce food
                                                                              waste as 20% of all EU dairy
                                                                                  products goes to waste.
                                                                            80% of the yogurt waste is due
                                                                                to use-by-date expiration.

                               Less waste                                            Global challenges1
                               Chr. Hansen’s bioprotective
                               cultures can extend shelf life and                        Roughly 1/3 of food produced for human consumption is lost or wasted globally
                               reduce food waste.                                        Just 25% of this food would be enough to feed the more than 800 million people
                                                                                         currently suffering from hunger and malnutrition
     Million tons of global yogurt waste reduced (cumulative)

                                                                                     Our solutions
                                                                                         Extend shelf life and reduce food waste through natural bioprotection in dairy
                                                                                         Enable customers to produce more food using fewer resources, e.g. producing more
                                                                                         cheese using less milk

                                                                                     Sustainability activities
           0,1              0,2              0,4                    1,2
                                                                                         Impact study on the effect of bioprotection (FreshQ®) for reducing food waste
          15/16            16/17            17/18                   21/22
                                                                                         Consumer sensory test conducted to investigate consumer acceptance of extended
                                                                                         shelf life
     1   Source: Food and Agriculture Organization.

28
LESS WASTE

     Using nature’s good bacteria to keep food fresh longer
                                                                                                                                                         Informing consumers about food waste
                                                                                                                                                         reduction increases their purchasing
                                                                                                                                                         intention
         extends                                30%                       ~440,000                       EUR250m                          ~520,000
         shelf life                        less yogurt                    tons yogurt                         net saving
                                                                                                                                         tons less CO2
                                                                                                                                                         Would you buy this yogurt with longer shelf live?1
                                                                                                             to European
         of yogurt                            waste                          saved                             economy                                   Group A
                                                                                                                                                         • Seven days older                                   Yes 75%        No 25%
         by 7 days                                                                                                                                       • Food waste info

                                                                                                                                                         Group B:
     Value proposition                                                                                                                                   • Seven days older                      Yes 52%                     No 48%

                       Manufacturers                                        Retailers                                            Consumers
                                                                                                                                                          Information given to the consumers in Group A:
                                                                                                                                                          Help reduce food waste: Too much food is wasted. One of the most
     • Increase shelf life                    • Sell more yogurt before expiry date                              • Enjoy more fresh yogurt                effective ways for us to help you reduce waste, is to improve the
     • Clean up labels                        • Reduce waste levels > Savings from                               • Waste less and thereby save money      quality and shelf life. This yogurt can stay fresh a little longer, because
     • Protect brand & reputation               waste reductions will offset lost                                                                         we have used a new and better yogurt culture. There are of course no
     • Avoid reallocation costs and discounts profit from reduced demand                                                                                  artificial ingredients. We all need to stand together to reduce food
     • Increase batch volume and frequency                                                                                                                waste.

     1   Study commissioned by Chr. Hansen and carried out May 2018 with German consumers by independent sensory evaluations institute Inspe-ct.

29
LESS WASTE

     Our bioprotection journey
      Bioprotection business split by category and region                                                                             2024/25
                                                                                                                                       EUR200m
                                                                                                                                      sales target
                                                     APAC
                                                                                                      Today: Unlocking the full
                                          NA
                                                                                                      potential of the business
          Meat
                                                                                                        Regional expansion into
                                                            EMEA                                        LATAM and APAC
                           Dairy            LATAM                                                       Building application
                                                                                                        knowledge and client
                                                                                                        relationships in adjacent
                                                                                                        areas
                                                                           2017/18
                                                                                                        Working with authorities on
                                                                           Launch of 2nd                regulatory framework &
                                                                           generation FreshQ®           labelling solutions
                                                    2013                   targeted at regions with
                                                    Chr. Hansen enters     hotter climates and less
                                                    bioprotection market   reliable cold chains
                                                    in dairy with launch
                            Early 2000              of FreshQ® brand
                            Chr. Hansen launches
                            first bioprotection
     Late 1990s             solutions in meat to
     First bioprotection    control Listeria
     solutions emerge

30
LESS WASTE

     We continue to roll out the 2nd generation bioprotection in emerging
     markets and drive penetration across core food applications
     Bioprotection has made strong                                                               Today                                   Tomorrow
     progress since 2013, and will
     continue to create long-term                 7%
     revenue optionality
                                                                                 Fresh          Cheese         Fermented        Animal               Vegetable
                                          6%                                     dairy                            meat         products              products
                                                                                                                           (meat adjacencies/fish)

                                                                                              Traditionally                          Non Traditionally
                                                                                         Fermented Food Products                  Fermented Food Products
                                                          Food waste
                                                          Shelf life extension
                                                          targeting
                                                          yeasts/mould
                  3%

        2%
                                                          Food Safety
                                                          Additional
                                                          protection against
                                                          gram-positive food
                                                          pathogens (Listeria,
       12/13      13/14   14/15   15/16   16/17   17/18   Clostridium)

31
Operational
         highlights

    32

7
M
a
r
c
h
WORKPLACE RESPONSIBILITY

     New culture model launched to articulate the unique corporate culture
     Comments/highlights                                                                                                       13/14    14/15    15/16    16/17    17/18

        Increased employee engagement clearly outperforming Gallup       PEOPLE STATISTICS
        benchmark                                                        Total number of employees                             2,605    2,651    2,852    3,111    3,304
        Global leadership development program CONNECT launched           Average number of employees                           2,510    2,573    2,708    2,940     3,151
        and Core Scientist program strengthened                          Employee turnover, %                                   11       12       10       12       12
        Ongoing efforts in diversity                                     Rate of absence, %                                      2        2        2        2        2
        Continued focus on zero-accident mindset resulting in further
        LTIF improvement                                                 DIVERSITY AND INCLUSION
        New culture model launched in Q1 2018/19 with four cultural      Gender - all employees (male/female), %               58/42    58/42    58/42    58/42    58/42
        drivers that articulate Chr. Hansen’s unique corporate culture   Gender - managers (male/female), %                   65/35     64/36    61/39    61/39    61/39
                                                                         Gender - key positions (male/female), %               81/19    82/18    78/22    78/22    78/22
                                                                         Nationality - key positions (local/non-local), %      73/27    75/25    77/23    76/24    75/25
                                                                         Nationality - key positions (Dane/non-Dane), %        59/41    63/37    59/41    57/43    54/46
                                                                         Diverse teams, %                                       69       77       69       66        78
                                                                         Board of Directors - (male/female/non-local), %      83/17/50 71/29/57 71/29/57 71/29/71 71/29/57

                                                                         OCCUPATIONAL HEALTH AND SAFETY
                                                                         Lost Time Incidents (LTIs)                             17       16        19      13       14
                                                                         Frequency of LTIs per million working hours (LTIF)      4       3.52      4       2.5      2.46
                                                                         Severity (days away per LTI)                           20       28        10       5        9
                                                                         Fatalities                                              0        0        0        0        0

33
ENVIRONMENT

     Efficiency gains across all dimensions; good progress with waste recycling
     Comments/highlights                                                                                                                                                                          13/14          14/15      15/16   16/17   17/18
          Improvement across all environmental efficiency                                                                ENERGY1
          parameters; target for recycled solid waste exceeded                                                           Total energy consumption, GWh                                             166.5         167.6      171.7   186.2   201.3
          Two more sites certified according to ISO 14001                                                                Energy efficiency, relative to base year 13/14, %                                                            7       9
                                                                                                                         WATER1
          Focus on strengthening data quality, integrity and
          collection method                                                                                              Total water consumption, Mm3                                               1.13           1.13     1.18     1.31    1.51
                                                                                                                         Water efficiency, relative to base year 13/14, %                                                             5       6
                                                                                                                         CO2 FOOTPRINT1
      Efficiency and recycled solid waste                                                                                Total scope 1 CO2 emitted, kt                                              24.3           22.8      21.4    24.5    24.8
      Relative to base year 13/14, %
                                                                                                                         Total scope 2 CO2 emitted, kt                                              24.7           24.3      24.8    23.9    25.9
                                                                                                                         Total scope 3 CO2 emitted, kt                                              54.5           62.3      63.3    88.1    87.9
                                                                                                                         Total scope CO2 emitted, kt                                               103.5          109.4     109.5   136.6   138.6
                                                                                                                         CO2 efficiency, relative to base year 13/14 (1+2), %                                                        17      22
                                                                                                                         WASTE1
                                                                                                                         Recycled biomass, kt                                                       67.4           76.5      82.7    90.0    99.3
                                                                                                                         Recycled solid waste, %                                                     23             20       23      33      42
                                                                                                                         Solid waste, kt                                                            3.2             3.1      3.2     4.0     4.4
                                                                                                                         Hazardous waste, % of solid waste                                            1              1        1       1       1
             5      17        7       33               6       22        9      42
                                                                                                                         Waste water,       Mm3                                                    0.88           0.83      0.84    0.88    1.11
                     16/17                                      17/18                                                    ENVIRONMENTAL VIOLATIONS
                 Water efficiency                           CO2 efficiency                                               Environmental violations, no.                                               7               4        3       0       2
                 Energy efficiency                          Recycled waste
      1For NCD, the calculation method has been changed from comparing utility use with kg of sold products to site specific production units. The new method is more accurate and better reflects production efficiency.
      The change effects our overall corporate KPIs progress. The KPI performance has therefore been recalculated from the base year 2013/14.

34
ENVIRONMENT

     Global footprint with centralized production in Denmark, Germany, Brazil
     and US                                                                                                                                  Copenhagen, Denmark
                                                                                                                                             Roskilde, Denmark
                                                                                                                                        Graasten, Denmark

                                                                                                                                         Nienburg, Germany

                                                         Milwaukee, US                                                                   Pohlheim, Germany

                                                                                                            Hustopece, Czech Republic
                                                                                                  Arpajon, France
       Dairy            Copenhagen, Milwaukee, Arpajon

       Enzymes          Graasten, Nienburg, Valinhos

       Meat             Pohlheim, Milwaukee

       Wine             Copenhagen, Pohlheim, Arpajon,                         Valinhos, Brazil
                        Milwaukee
                                                                  Lima, Peru
       Human            Roskilde, Copenhagen

       Animal           Nienburg, Pohlheim, Hustopece,
                        Valinhos, Milwaukee
       Plant            Nienburg, Valinhos

       Natural Colors   Lima, Valinhos, Copenhagen

35
BUSINESS AND PRODUCT INTEGRITY

     Further strengthening the integration of our Code of Conduct
     Comments/highlights                                                                                               13/14    14/15    15/16   16/17   17/18
        Roll-out of a new Code of Conduct e-learning            PRODUCT SAFETY
        module to all employees                                 Product retrievals, no.                                  4          4     3        2      2
        Whistleblower hotline: one case reported that has       Product safety audit findings, no.                       17         10     9       8      11
        been investigated and was concluded
        unsubstantiated
                                                                BUSINESS INTEGRITY
        Third party audits of quality and food safety           Participation rate in Code of Conduct training, %       92          94   100     100      99
            All production sites are certified to food safety
            standard FSSC 22000
            Approximately one audit every other week at
            Chr. Hansen site conducted by Bureau Veritas
            Actions for food safety audit findings were
            defined; most findings related to internal
            documentation issues and were not product-                                                  Code of Conduct available
            related                                                                                     on Chr. Hansen website

36
HUMAN RIGHTS AND SOURCING

     Responsible sourcing in Natural Colors
                                                                  Case studies: How we support rural farming and reduce waste
       Local footprint with eight sourcing offices in Denmark,
       Turkey, Italy, USA, Peru, Brazil, India and China
       Dual sourcing, particularly for volume pigments, to
       mitigate risk against poor harvest, have a stronger                         Annatto has been grown and used for color for hundreds of years. We develop
       price negotiating platform and better support large                         strains with high pigment and share our best practices with farmers in Africa
       conversions                                                                 to help them increase their profitability.

       Own agronomy programs and cooperation with
       leading universities with focus on improving yield
       through higher pigment load per plant, better                               Cochineal is grown in desert areas. We work with farmers by signing long-
       utilization of arable land and reduction of waste                           term contracts. This gives the security needed to invest in better production
       Supporting local farmers through Good Agricultural                          methods. One result is an investment in drip irrigation to get three times the
       Practices                                                                   harvest for the same amount of water.
       Sustainability assessment of farmers and audits of
       high risk suppliers; regular training of QA auditors and
       Category Managers in sustainability                                         Grape pomace (waste) is customarily delivered by wineries to extractors who
                                                                                   extract alcohol from grape skins. When the pigment content in the skin is high
                                                                                   enough, anthocyanin is extracted for color. One of our suppliers even burns
                                                                                   their final waste to generate steam and energy.

37
HUMAN RIGHTS AND SOURCING

     Answering to increased integration of due diligence in local legislations
      Responding to increasing requirements for due diligence processes
        A human rights due diligence process was conducted in 2017 and updated in 2018
        The process identifies and highlights potential human rights risk scenarios and the associated
        severity (impact and likelihood), taking into account existing actions for mitigation
        The process is updated annually to reflect any changes in the value chain or governance system

                                                             Review against
                                   Identify potential                                Assess impact and       Adjust for       Prioritization of
           Map value chain                                    human rights
                                       scenarios                                         likelihood      mitigation actions       severity
                                                                articles

38
Governance

    39

7
M
a
r
c
h
MANAGEMENT STRUCTURE

     Dual system with two independent bodies
       Board of Directors supervises the work of the Executive Board and               Management structure
       is responsible for general strategic management
           The Board of Directors currently has eleven members consisting of                            AGM
           shareholder and employee representatives
                                                                                                            elects
           Shareholder representatives serve for 1 year; at least half shall be
           independent according to the Danish Corporate Governance Codex
                                                                                            Shareholder representatives               Employee representatives
           Employee representatives serve for 4 years (current term until 2021); the
           number of employee representatives is equal to half the number of                7 members – elected every year           4 members – elected for 4 years
           shareholder-elected members
       Executive Board is in charge of day-to-day management (CEO,                                                           form

       CFO, CSO and EVP FC&E)
           Corporate Leadership Team assists Executive Board
                                                                                                                      Board of Directors

       Board of Directors statistics
                                                                                                                                Monitoring
             11               64%             36%             36%                                                               & strategy
          members         independent       Women           Non-Danish
                                                                                                                 Executive Board (4 members)

                                             Diversity
                                                                                                          Corporate Leadership Team (11 members)
                                              target:
                                              3 female
                                            shareholder
                                          representatives
                                             by 21/22
40
MANAGEMENT

     Executive Board and Corporate Leadership Team

                                     Executive Board

                                                       Mauricio Graber    Soeren Westh Lonning     Christoffer Lorenzen               Thomas Schaefer
                                                            CEO                   CFO                      FC&E                            CSO

                                                       Christian Barker      Klaus Bjerrum              Winnie Buegel                   Sten Estrup
                                                             H&N                 NCD                                                   APAC & LATAM
         Corporate Leadership Team

                                                                                                 Compliance, Comm. & Sustainability

                                                         Alice Larsen     Jacob Vishof Paulsen       Torsten Steenholt
                                                       Human Resources        EMEA & NA              Global Operations
41
BOARD OF DIRECTORS

                                   A high quality Board with a diverse mix of competencies and experience

                                                                                                                                               Remuneration
                                                                                                                      Committee
                                                                                                                                  Nomination
                                                                                                                                    Comittee

                                                                                                                                                 Committee

                                                                                                                                                              Committee
                                                                                                          BoD since

                                                                                                                          Audit
                                                                                           Independent?
                                                                       YoB

                                                                             Nationality

                                                                                                                                                                Scientific
                                   Name                                                                                                                                      Board competencies                                                        Other Board
                                                                                                                                                                                                                                                       positions

                                   Dominique Reiniche – Chairman                                                                                                             Experience in food, beverage and beauty industries; 22 years in senior    PayPal Luxemb.,
                                   Professional board member           ’55     F           Yes            ’13                        C             C                         leadership positions at French and European levels, including CEO at      Mondi, Severn Trent
Shareholder representatives only

                                                                                                                                                                             Coca-Cola.
                                   Jesper Brandgaard – Vice Chairman                                                                                                         Experience from group management in a multinational pharmaceutical        SimCorp, Novo
                                   EVP Biopharm and Legal Affairs,     ’63   DK            Yes            ’17            X           X                                       company, including responsibility for strategy development and            Nordisk Haemophilia
                                   Novo Nordisk (until 2019)                                                                                                                 implementation, legal affairs and patents, IT and investor relations      Foundation
                                   Luis Cantarell                            ES/                                                                                             Professional global experience within the food and beverage industry;     Froneri, URIACH,
                                                                       ’52                 Yes            ’16                                                     C
                                   Professional board member                 CH                                                                                              over 10 years of leadership experience with the Nestlé.                   Fundacion Fero
                                   Heidi Kleinbach-Sauter                                                                                                                    More than 25 years of innovation and R&D experience in the CPG
                                   Professional board member                 DE/                                                                                             industry globally; former Senior VP Global R&D of PepsiCo. Founding
                                                                       ’56                 Yes            ’17                                      X              X
                                                                             US                                                                                              Chair of several councils, experience as a member of the Advisory
                                                                                                                                                                             Committee of Northern Seed Montana LCC, US.
                                   Niels Peder Nielsen                                                                                                                       Former partner of consulting firms Bain & Company and McKinsey,
                                   Deputy-CEO Novo Nordisk Fonden      -56   DK            Yes            ‘18                                                     X          broad industry expertise including healthcare and biological solutions;
                                                                                                                                                                             experience in digital strategy and business development.
                                   Kristian Villumsen                                                                                                                        Extensive knowledge of the medical and life science industry; solid       Coloplast
                                                                       ’70   DK            Yes            ’14            X           X
                                   CEO, Coloplast                                                                                                                            international experience in both European and emerging markets.           subsidiaries
                                   Mark Wilson                                                                                                                               International CEO/MD with over 40 years in FMCG companies and
                                   Professional board member           ’52   UK            Yes            ‘10            C                         X                         service/B2B industries in Asian, South American, UK, Irish and
                                                                                                                                                                             international markets. Financial and accounting experience.

42                                 C= Chair, X = Member.
BOARD OF DIRECTORS

     Committees established in line with Danish Corporate Governance Codex
     Audit Committee                                                                               Remuneration Committee
     Assist in fulfilling its responsibilities in the financial reporting process, the system of   Assist in fulfilling its responsibilities in regard to establishing, implementing and
     internal controls, the audit process and monitoring compliance with laws,                     executing its remuneration position for the members of the Board of Directors and
     regulations, internal policies and positions, including considering the independence          the Executive Board; preparation of a general remuneration policy for the
     of the external auditor and reviewing the interim financial reports.                          Company.

     Mark Wilson (Chairman)                                                                        Dominique Reiniche (Chairman)
     Jesper Brandgaard                                                                             Heidi Kleinbach-Sauter
     Kristian Villumsen                                                                            Mark Wilson

     Scientific Committee                                                                          Nomination Committee
     Assist in fulfilling its responsibilities with respect to the Company’s R&D activities        Assist in fulfilling its responsibilities with respect to the nomination and
     and ensuring that the Board of Directors has an informed, independent view of the             appointment of members of the Board of Directors and the Executive Board.
     focus and direction of the R&D function’s work and capabilities.

     Luis Cantarell (Chairman)                                                                     Dominique Reiniche (Chairman)
     Heidi Kleinbach-Sauter                                                                        Jesper Brandgaard
     Niels Peder Nielsen                                                                           Kristian Villumsen

43
EXECUTIVE COMPENSATION

     Closely aligned to key metrics and with strong incentive component
     SHORT TERM                                                                             LONG TERM

     Annual incentive program for CEO and CFO                                               Progressive three-year incentive program
           Based on group financial targets and discretionary, personal goals                     Requires personal investment in Chr. Hansen shares to participate
           Bonus is paid as 1/3 of the payout in Restricted Stock Units, and 2/3 in cash;         Grant value estimated (based on Black-Scholes) at 20-25% of the
           normally accounts for 25-30% of total remuneration package                             remuneration package

                                                                                                                          x0.5            Retention
                                    20%               Organic growth target

     Group                                                                                                                x1.5            Organic growth target (CAGR)
     financial                      20%               EBIT target                           Group
     targets                                                                                financial
                                                                                            targets
                                    20%               Free cash flow target                                               x1.5            Accumulated EBIT target

     Discretionary,
                                    40%               Individual non-financial targets                                     x2             TSR performance relative to peers
     personal goals

                                                                                                                    Matching shares
                                                                                                                   per 1 invested share

44
UN Global
         Goals mapping
         methodology

    45

7
M
a
r
c
h
We focus on the three SDGs where we can make the strongest impact
             End hunger and                Ensure healthy lives            Enable sustainable
             promote sustainable           and promote well-being          consumption and
             agriculture                   for all at all ages             production patterns

             More out of milk              Better health and well-being    Less food waste
             by increasing productivity    for a smarter gut               by using bioprotection
             e.g. CHY-Max®                 e.g. BB-12® or LGG®             e.g. FreshQ®

             More out of land              Better healthier alternatives   Less food contamination
             by increasing crop yields     for a good life                 by using natural solutions
             e.g. Presence®                e.g. NOLA® Fit or SALTLITE®     e.g. SafePro®

                                           Better animal welfare
             More access to nutrition                                      Less artificial ingredients
                                           for reduced antibiotic
             by increasing affordability                                   by using natural colors
                                           resistance
             e.g. Far-m®                                                   e.g. FRUITMAX®
                                           e.g. Bovamine®

46
Our 5-step methodology was reviewed by PwC

                   1                                              2                                              3                                              4             5

         Identify impact areas                 Measure business impact                             Collect documentation                              Get external assurance &
                                                with UN Global Goals                                                                                     report on progress
                                          Impact category             SDG 2 SDG 3 SDG 12   • Levels of documentation:                           • Methodology, process and findings are
                                                                                                                                                  verified by PwC
          Impact                          Improving food and the environment                  • 1 Weakly documented: Sporadically or
                                                                                                weakly documented to a degree where             • The accumulated revenue generated from
                                          Increase productivity        X            X           Chr. Hansen cannot claim the effect               products contributing to the SDGs is tracked
                                                                                                                                                  annually
                                          Reduce waste                 X            X         • 2 Moderately documented: Medium level
                                                                                                of documentation, leaving room for              • Life cycle assessment perspectives will be
                                          Substitute artificial
                                                                              X     X           improvement, but still strong enough that         included in the assessment of products to
                                          ingredients
                                                                                                the effect can be claimed                         ensure a holistic product assessment
                                          Increase food safety                X     X
                                                                                              • 3 Well documented: Strong
                                          Improving animal and human health                     documentation, potentially
                                          Enhance animal                                        verified/developed by third party clearly
                                                                       X                        defining the product effect
                                          welfare
                                          Promote health and
                                                                              X
                                                                                           • If a product scores 2 or 3 and is categorized in
                                                                                                                                                        Products not included may not

                                                                                                                                                  !
                                          well-being                                         one (or more) of the impact categories
                                                                                             criteria, it’s revenues are included                       have sufficient documentation or
                                          Reduce salt, sugar, fat
                            Opportunity                                       X                                                                         there is no direct sustainability
                                          and lactose
                                                                                                                                                        impact, e.g. products that enable
                                          Ensure access to
                                          affordable and               X            X
                                                                                                                                                        cheese maker to make holes in
                                          available nutrition                                                                                           the cheese.

47
Other

    48

7
M
a
r
c
h
SUSTAINABILITY ORGANIZATION

     Sustainability Board was established in 2015/16
     Chr. Hansen’s Sustainability Board is
                                                                                       Chairman
     responsible for ensuring ownership,
                                                                                    Mauricio Graber,
     involvement and commitment from the entire                                     President & CEO
     business in defining, prioritizing and executing
     Chr. Hansen’s sustainability objectives and
     activities.

                                                                                                                  Sustainability
                                                                                                                 Strategy Office
                                                                                                                Annemarie Meisling,
                                                                                                               Director, Sustainability

     Research &                Investor Relations     Customers, Products      Responsible                   Business                     HR, Diversity            Environment,
     Development               & Communications       & Markets                Sourcing                      Integrity                    & Human Rights           Health & Safety
     T. Schaefer, EVP & CSO,   Martin Riise, Senior   C. Lorenzen, EVP, FC&E   K. Tollin, Senior Director,   W. Buegel, General           A. Larsen, CVP, Global   T. Steenholt, EVP, Global
     R&D                       Director, IR           K. Bjerrum, EVP, NCD     Global Sourcing               Conusel & CVP                Human Resources          Operations
                               Sanne Seyer-Hansen,    H. J. Nielsen, VP, H&N
                               Director, Corporate
                               Communications

49
RATINGS & AWARDS

     World’s most sustainable company in 2019 by Corporate Knights
     Rankings & awards      Rank       Description

                           No. 1           Ranked the Most Sustainable Company in the World in 2019

                             AA            Top 14% in industry

                          5th of 132       Ranked in the top 5th / 132 in industry – “Leader”

                              C            32% of companies responding to CDP at C level

                              C            Best ESG scores amongst sector peers

                          Top 5%           Ranked in the top 5% performers on Eco Vadis

                             ✓             Chr. Hansen listed as a constituent

50
SELECTED POSITIONS

     Our stance on GM techniques, palm oil and land usage
      Genetic modification techniques statement
      We recognize that the use of genetic modification (GM) techniques in the food chain is subject to public debate and that the acceptance of such technology by our
      customers depends on its acceptance by the end consumers.
          Chr. Hansen’s use of GM techniques adheres to all rules and regulations governing this area.
          Products requiring GM labeling are labeled as required where the products are sold.
          We do not source materials for the manufacturing of our products, which would result in the products of our customers being GM labeled according to the EU
          Regulations without explicitly informing our customers.
          All vendors and raw materials must be approved in accordance with the Chr. Hansen internal procedures. The approval includes assessment of the validity of the genetic
          modified labeling or the lack thereof.
          Chr. Hansen has elaborated product-specific statements relating to the use or non-use of genetically modified components, which are available upon request.

      Palm oil statements (Natural Colors Division and Food Cultures & Enzymes)
          Chr. Hansen has been an affiliate member of the Roundtable on sustainable Palm Oil (RSPO) since 2011.
          Chr. Hansen uses palm oil in two ways:
                   Primarily in the palm-carotenoids, an important pigment in our product range. The natural carotene is a bi-product (waste product from e.g. the biofuel and
                   cosmetic production).
                   A small amount of palm oil derivatives can be found as ingredients and additives in the raw materials used for production.
          We work closely with our customers to investigate options for supplying RSPO certified or palm-free products.

      Land use statement
          Chr. Hansen works closely with suppliers to ensure good agricultural practices and continue to improve quality and standards.
          We create local development for the farmers, and help ensure a stable income from coloring crops.
          We collaborate with suppliers to continue to improve efficiency both in terms of the specific color intensity of crops and the agricultural practices for cultivating these.

51
‒   Chr. Hansen

‒   ESG story 2017/18

                        Contacts
                        Sustainability                    Investor Relations
                        Annemarie Meisling                Martin Riise
                        Head of Sustainability            Head of Investor Relations
                        +45 52180168                      +45 53 39 22 50
                        DKANME@chr-hansen.com             DKMARI@chr-hansen.com

                        Nassera Ahmend                    Annika Stern
                        Sustainability Specialist         Investor Relations Officer
                        +4552180835                       +45 2399 2382
                        DKNAAH@chr-hansen.com             DKASTE@chr-hansen.com

                        Louise Rosenmeier
                        Sustainability Business Partner
                        +45 53 39 27 82
                        DKLORO@chr-hansen.com
You can also read