Citi Global Property CEO Conference - March 7 - 8, 2022

Page created by Adrian Bryant
 
CONTINUE READING
Citi Global Property CEO Conference - March 7 - 8, 2022
Citi Global Property
                    CEO Conference

March 7 - 8, 2022
Citi Global Property CEO Conference - March 7 - 8, 2022
Non-GAAP Financial Measures & Cautionary Statements
Certain of the information contained herein, including intra-quarter operating information and number of confirmed cases of COVID-19, has been provided by our operators and we have not verified this information through
an independent investigation or otherwise. We have no reason to believe that this information is inaccurate in any material respect, but we cannot assure you of its accuracy.

Non-GAAP Financial Measures
This presentation includes certain financial performance measures not defined by generally accepted accounting principles in the United States (“GAAP”). Reconciliations of these non-GAAP financial measures to the
most directly comparable GAAP measures are included in this presentation. We believe such measures provide investors with additional information concerning our operating performance and a basis to compare our
performance with the performance of other REITs. Our definitions and calculations of these non-GAAP measures may not be the same as similar measures reported by other REITs.

These non-GAAP financial measures should not be considered as alternatives to net income attributable to common stockholders (determined in accordance with GAAP) as indicators of our financial performance or as
alternatives to cash flow from operating activities (determined in accordance with GAAP) as measures of our liquidity, nor are these measures necessarily indicative of sufficient cash flow to fund all of our needs.

Cautionary Statements
This presentation includes forward-looking statements within the meaning of Section 27A of the Securities Act of 1933, as amended, and Section 21E of the Securities Exchange Act of 1934, as amended. These forward-
looking statements include, among others, statements of expectations, beliefs, future plans and strategies, anticipated results from operations and developments and other matters that are not historical facts. Forward-
looking statements include, among other things, statements regarding our and our officers’ intent, belief or expectation as identified by the use of words such as “may,” “will,” “project,” “expect,” “believe,” “intend,”
“anticipate,” “seek,” “target,” “forecast,” “plan,” “potential,” “opportunity,” “estimate,” “could,” “would,” “should” and other comparable and derivative terms or the negatives thereof.

Forward-looking statements are based on management’s beliefs as well as on a number of assumptions concerning future events. You should not put undue reliance on these forward-looking statements, which are not a
guarantee of performance and are subject to a number of uncertainties and other factors that could cause actual events or results to differ materially from those expressed or implied by the forward-looking statements. We
do not undertake a duty to update these forward-looking statements, which speak only as of the date on which they are made. You are urged to carefully review the disclosures we make concerning risks and uncertainties
that may affect our business and future financial performance in our filings with the Securities and Exchange Commission (“SEC”), including those made in the “Summary Risk Factors” section, “Risk Factors” section and
“Management’s Discussion and Analysis of Financial Condition and Results of Operations” section of our most recently filed Annual Report on Form 10-K for year ended December 31, 2021.

Certain factors that could affect our future results and our ability to achieve our stated goals include, but are not limited to: (a) the impact of the ongoing COVID-19 pandemic and its extended consequences, including of
the Delta, Omicron or any other variant, on our revenue, level of profitability, liquidity and overall risk exposure and the implementation and impact of regulations related to the CARES Act and other stimulus legislation
and any future COVID-19 relief measures; (b) our ability to achieve the anticipated benefits and synergies from, and effectively integrate, our acquisitions and investments, including our acquisition of New Senior
Investment Group Inc. (“New Senior”); (c) our exposure and the exposure of our tenants, managers and borrowers to complex healthcare and other regulation and the challenges and expense associated with complying
with such regulation; (d) the potential for significant general and commercial claims, legal actions, regulatory proceedings or enforcement actions that could subject us or our tenants, managers or borrowers to increased
operating costs and uninsured liabilities; (e) the impact of market and general economic conditions, including economic and financial market events, inflation, changes in interest rates, supply chain pressures, events that
affect consumer confidence, our occupancy rates and resident fee revenues, and the actual and perceived state of the real estate markets, labor markets and public capital markets; (f) our ability, and the ability of our
tenants, managers and borrowers, to navigate the trends impacting our or their businesses and the industries in which we or they operate; (g) the risk of bankruptcy, insolvency or financial deterioration of our tenants,
managers, borrowers and other obligors and our ability to foreclose successfully on the collateral securing our loans and other investments in the event of a borrower default; (h) our ability to identify and consummate
future investments in or dispositions of healthcare assets and effectively manage our portfolio opportunities and our investments in co-investment vehicles, joint ventures and minority interests; (i) risks related to
development, redevelopment and construction projects; (j) our ability to attract and retain talented employees; (k) the limitations and significant requirements imposed upon our business as a result of our status as a REIT
and the adverse consequences (including the possible loss of our status as a REIT) that would result if we are not able to comply; (l) the risk of changes in healthcare law or regulation or in tax laws, guidance and
interpretations, particularly as applied to REITs, that could adversely affect us or our tenants, managers or borrowers; (m) increases in our borrowing costs as a result of becoming more leveraged or as a result of
changes in interest rates and phasing out of LIBOR rates; (n) our reliance on third parties to operate a majority of our assets and our limited control and influence over such operations and results; (o) our dependency on a
limited number of tenants and managers for a significant portion of our revenues and operating income; (p) the adequacy of insurance coverage provided by our policies and policies maintained by our tenants, managers
or other counterparties; (q) the occurrence of cyber incidents that could disrupt our operations, result in the loss of confidential information or damage our business relationships and reputation; (r) the impact of merger,
acquisition and investment activity in the healthcare industry or otherwise affecting our tenants, managers or borrowers; and (s) the risk of catastrophic or extreme weather and other natural events and the physical effects
of climate change.

Important Additional Information Regarding Proxy Solicitation

Ventas, Inc. (the “Company”) intends to file a proxy statement and WHITE proxy card (the “Proxy Statement”) with the SEC in connection with the solicitation of proxies for the 2022 annual meeting of stockholders (the
“2022 Annual Meeting”). The Company, its directors and certain of its executive officers will be participants in the solicitation of proxies from stockholders in respect of the 2022 Annual Meeting. Information regarding the
names of the Company’s directors and executive officers and their respective interests in the Company by security holdings or otherwise is set forth in the Company’s proxy statement for the 2021 annual meeting of
stockholders, filed with the SEC on April 13, 2021 (the “2021 Proxy Statement”). To the extent holdings of such participants in the Company’s securities have changed since the amounts described in the 2021 Proxy
Statement, such changes have been reflected on Initial Statements of Beneficial Ownership on Form 3 or Statements of Change in Ownership on Form 4 filed with the SEC. Additional information can also be found in the
Company’s Annual Report on Form 10-K for the year ended December 31, 2021, filed with the SEC on February 18, 2022. Details concerning the nominees of the Board of Directors for election at the 2022 Annual
Meeting will be included in the Proxy Statement. BEFORE MAKING ANY VOTING DECISION, INVESTORS AND STOCKHOLDERS OF THE COMPANY ARE URGED TO READ ALL RELEVANT DOCUMENTS FILED
WITH OR FURNISHED TO THE SEC, INCLUDING THE COMPANY’S DEFINITIVE PROXY STATEMENT AND ANY AMENDMENTS AND SUPPLEMENTS THERETO BECAUSE THEY WILL CONTAIN IMPORTANT
INFORMATION. These documents, including the definitive Proxy Statement (and any amendments or supplements thereto) and other documents filed by the Company with the SEC, are available for no charge at the
SEC’s website at http://www.sec.gov and at the Company’s investor relations website at https://ir.ventasreit.com.

                                                                                                                                                                                                                            2
Citi Global Property CEO Conference - March 7 - 8, 2022
Table of Contents

Portfolio Overview & Capital Allocation   4

Environmental, Social & Governance        11

Recent Senior Housing Highlights          14

Senior Housing Portfolio Actions Update   21

Office Business Update                    30

Loan Portfolio Update                     41

Capital Structure Actions                 43

                                          3
Citi Global Property CEO Conference - March 7 - 8, 2022
Portfolio Overview &
 Capital Allocation
Citi Global Property CEO Conference - March 7 - 8, 2022
Sustainable Value Creation: Growth & Success Over Two Decades
                                                                            Poised to Build on Our Long-Term Record of Strong Shareholder Returns

                1999 – 2001                               2002 – 2007                              2008 – 2009                               2010 – 2013                              2014 – 2019                               2020 – 2021                           2022 – Onwards

                                                                                                                                                                                      Portfolio
             Restructure &                                                                  Progress Through                              Re-Enter Growth
                                                       Grow & Diversify                                                                                                              Reshaping &                                 COVID-19                             Post COVID-19
               Survival                                                                         Downturn                                  & Diversification
                                                                                                                                                                                      Elevation
         •    Successfully                         •    4 strategic M&A deals               •    Fortified Balance                    •    $13B+ New                           •     $12B+ new                           •    Established VIM, the                •     Robust senior
              Navigated                            •    New Products: Senior                     Sheet                                     Investments                               investments                              Company’s third-                          housing demand
              Bankruptcy of Sole                        Housing, Medical                    •    Entered SHOP &                       •    Scaled Medical Office               •     Entered Health                           party capital platform                    expected
              Tenant                                    Office and Loans                         Canadian senior                           Platform                                  System and Life                     •    $3.7B New                           •     External growth
                                                                                                 housing business via                 •    Robust Portfolio                          Science, R&I markets                     Investments focused                       momentum expected
                                                                                                 first of a kind                           Growth                              •     Highly successful exit                   on Senior Housing                   •     $1.1B of Life
                                                                                                 acquisition of Sunrise                                                              from skilled nursing                     and Life Science, R&I                     Science, R&I & Le
                                                                                                 REIT                                                                                business: $8B+                           in 2021                                   Groupe Maurice
                                                                                                                                                                                     attractive dispositions             •    $1B+ / year in                            developments
                                                                                                                                                                                                                              dispositions & loan                       underway
                                                                                                                                                                                                                              repayments to
                                                                                                                                                                                                                              enhance portfolio
                                                                                                                                                                                                                              quality

                                                                                                              2015 – Present: Portfolio Transformation

        Q1 20151                                                                                                                      Q4 20211                              Life Science, Research &
                                                                                                      Senior                                                                          Innovation (R&I)
                         Medical Office                                                               Housing
                                                                                                                                                                                                                                    10%                                        Senior
                                                         18%                       29%                Operating                                                                                                                                                                Housing -
                                                                                                                                                                                     Medical Office                                                          31%
                                                                                                                                                                                                                     22%                                                       Operating
             IRFs and LTACs
                                                 7%
                        Other           1% 4%
                           Loans                                                          24%           Senior                                                                                                            9%               1%              16%
                                                                                                       Housing                                                                      IRFs and LTACs
                                                         18%                                                                                                                                                                        8%                                      Senior
                                                                                                         - NNN                                                                                                                                    2%
                             Skilled Nursing                                                                                                                                                      Health Systems                                                           Housing
                                                                                                                                                                                                                                       1%                                    - NNN
                                                                                                                                                                                                                                                  Loans
                                                                                                                                                                                                            International
                                                                                                                                                                                                               Hospitals                 Skilled Nursing

1. Reflects portfolio concentration based on Annualized Adjusted NOI, which represents an annualized result of a period’s Reported Segment NOI excluding (i) Reported Segment NOI not attributable to owned real estate or loan investments, (ii) Reported Segment NOI
related to the non-controlling interest of consolidated real estate entities and (iii) the annualizing impact of certain non-recurring or out-of-period items, and including (x) the effects of transactions and events that were completed during the period, as if the transaction or    5
event had been consummated at the beginning of the relevant period, (y) the expected leased-up impact of recently completed developments and (z) Ventas’s share of Annualized Adjusted NOI related to nonconsolidated real estate entities.
Citi Global Property CEO Conference - March 7 - 8, 2022
Case Study: Ventas Success in Life Sciences

                                                      Enter Life Science Sector with Well-                 Build Life Science Business +               Enter            Attract Private Capital to                 Expand to 10M SF,
                                                        Positioned Partner + Portfolio                     Executed on University Based           Top Life Science       Expand Acquisitions +                   Recognized as a Leading
                                                                 Repositioning                                        Pipeline                       Clusters            Development Capacity                     Life Science Investor
                                                      • Disposed of SNFs at high valuation                • Announced $1.5B pipeline             • Entered Cambridge   • Started Fund1 to enable “core”    • Acquired Johns Hopkins assets;
                                                      • Began life science, R&I business by                 developments with leading research     cluster market        investments with private            entered 5th Top 10 life science cluster
                                                        acquiring initial university-based life science     universities                                                 capital                           • Announced multi-use development
                                                        portfolio from Blackstone                                                                                      • Entered South San Francisco         with major West Coast research
                                                                                                                                                                         cluster market                      institution - UC Davis
                                                      • Established exclusive relationship with
                                                        Wexford; premier university partner in lab                                                                     • Strategic JV with GIC to
                                                        space                                                                                                            accelerate development
                                                                                                                                                                         pipeline
                                                                                                                                                                       • Commenced One City &
                                                                                                                                                                         Drexel developments in                                              10M
                                                                                                                                                                         growing Philadelphia market                                          SF
                                         10,000

                                                                                                                                                                             Establish
                                              9,000                                                                                                                           Ventas
                                                                                                                                                       1030 Mass
                                                                                                                                                                               Fund
                                                                                                                                         ASU
                                              8,000
                                                                                                             4220 Duncan

                                              7,000
  Total Life Science Sq. Ft. (in thousands)

                                                                                                                                                                                          SSF Portfolio

                                              6,000

                                              5,000

                                                                                                                                Pitt Phase I
                                              4,000

                                              3,000
                                                                                              7.0% cap
                                                                                              rate

                                              2,000

                                              1,000      6.75%
                                                         cap rate

                                                 0
                                                               2015                      2016                   2017                     2018             2019                 2020                       2021

                                                                                                                                                                                                                                              6
1. Ventas Life Science & Healthcare Real Estate Fund
Citi Global Property CEO Conference - March 7 - 8, 2022
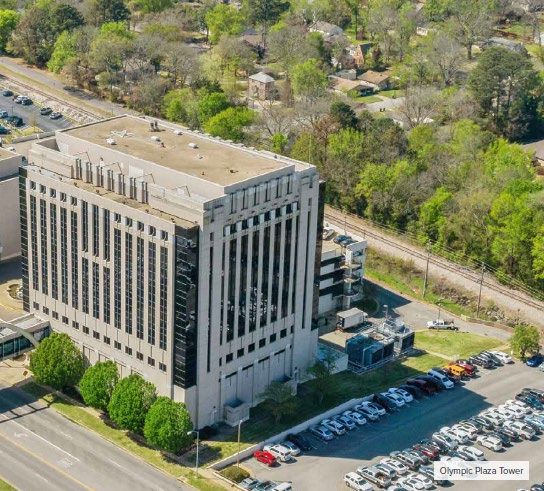
Case Study: Expanding Differentiated Canadian Senior Housing
      Footprint with Le Groupe Maurice (LGM)

                          Differentiated LGM Business Model                                                      Strong Development Track Record

       LGM is a best-in-class operator & developer and benefits from a                             Successful track record of development, with average preleasing
        well-coordinated public health response in Canada                                            exceeding 60% due to unique brand and business model
       Ventas invested in Le Groupe Maurice in June 2019 and acquired                              Leased up three recently opened communities in our Class A Le
        exclusive rights to its future development pipeline                                          Groupe Maurice portfolio to 92% occupancy
       Unique product type offers top-tier amenities and an outstanding
        lifestyle for seniors, with a la carte services, active adult options                       Two development projects underway totaling ~$200M in project
        and apartment-like units resulting in longer length of stay                                  costs (627 units) with additional sites in the predevelopment stage

       Quebec offers a large, thriving senior housing market with a high
        penetration rate of 18%1 and attractive senior population growth
       LGM portfolio occupancy has shown remarkable resiliency through
        the pandemic

                                                                             VAST – 378 units                                                               Elogia II – 287 units
                                                                            Sainte-Julie, Quebec                                                             Montreal, Quebec
                                                                             Opened Dec. 2020                                                                Opened Jun. 2021

                                                                                                                                                                           7
1. Defined as the percent of seniors aged 75+ residing in senior housing.
Citi Global Property CEO Conference - March 7 - 8, 2022
Case Study: New Senior Independent Living Portfolio

                                                                                          Portfolio Overview

                                                                                               103
                                                                                            Communities

                                                                                          12,400+
                                                                                                Units

                                                                                                36
                                                                                               States

                                                                                             100%
                                                                                             Private Pay

   Higher margin, independent living communities with favorable market characteristics,      $2.3B
        relatively low labor requirements and a three-year average length of stay            Transaction

           Benefit from large and growing middle market senior demographics

                                                                                                               8
Citi Global Property CEO Conference - March 7 - 8, 2022
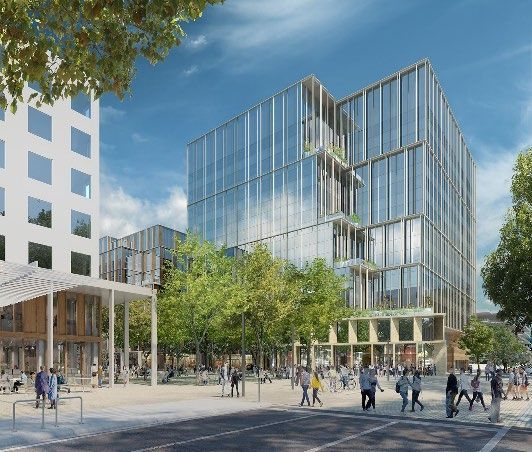
Case Study: Expanded Opportunities Via Ventas Investment
         Management (VIM)
                                             Strategic Rationale                                                                Strong VIM Platform Growth (AUM)1

         Ventas Investment Management (VIM) provides Ventas and its
         shareholders numerous strategic benefits including:                                                                                                      ~$4.5B
              Further diversifying Ventas’s capital sources
              Augmenting Ventas’s significant investment capacity
                                                                                                                                         AUM has grown ~3x
              Expanding Ventas’s strategic reach                                                                                           since 1Q20
              Maximizing the impact of Ventas’s excellent team, relationships,
               industry knowledge and brand                                                                                     ~$1.6B
              Enabling global institutional investors to invest with Ventas in a
               public or private investment structure
              Enhancing Ventas’s liquidity and financial flexibility
              Ventas earns asset management fees and would earn a promote                                                       1Q20                              4Q21
               if investors receive targeted returns

                                                                     Ventas Life Science & Healthcare Real Estate Fund Assets

                                                                                  South San Francisco (SSF) Portfolio                                  Johns Hopkins
                                                                                      Acquired ~$1B class A trophy portfolio                Class A, 94% leased portfolio anchored by
                                                                                 strategically positioned in premier SSF life science                Johns Hopkins Medicine
                                                                                                        cluster

             Ventas Fund enhances and expands
             Ventas’s investment opportunities in
              high quality, low cap rate assets in
               highly desirable cluster markets

                                                                                                                                                                                        9
1. Includes unfunded commitments, developments underway and gross asset value.
Citi Global Property CEO Conference - March 7 - 8, 2022
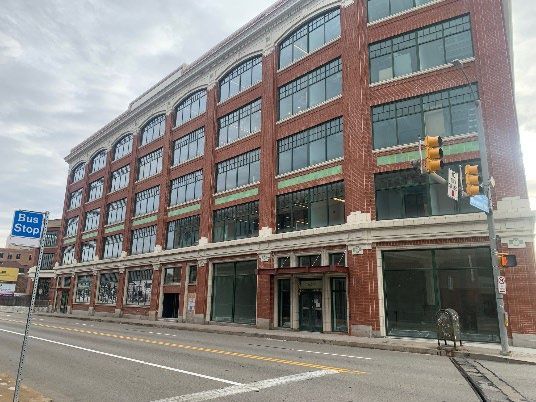
Current Capital Allocation Priorities
                                       Our Leading Portfolio Provides Significant Opportunity for Growth

                                                         Life Science, Research &
           Senior Housing                                     Innovation (R&I)                                         Medical Office
                  70% of $3.7B                                         20% of $3.7B                                         10% of $3.7B
             819 Communities                                       43 Centers                                            311 Buildings
        47% Annualized Adjusted NOI                         10% Annualized Adjusted NOI                            22% Annualized Adjusted NOI

                                                                       Ongoing development

$3.7B
               2021 Announced
               Investment Activity                   $1.4B             principally in Life Science,
                                                                       R&I and Canadian senior               ~$1B           Forward pipeline of Life
                                                                                                                            Science, R&I projects
                                                                       housing markets

                                                   Strong Track Record of External Investment

Historical Acquisition Volume               Experienced investments team, broad relationships and processes with
                                                       long track record of significant external growth
$12.0

$10.0
                                                                                                                                           >$3B Annual
 $8.0                                                                                                                                        Average
                                                                                                                                            2011-2021
 $6.0

 $4.0

 $2.0

  $-
           2011         2012         2013         2014          2015         2016          2017         2018         2019        2020         2021

                                                                                                                                                         10
Environmental, Social &
      Governance
Sustainability Leadership Raises Our Returns

                                                      Ventas’s Current ESG Priorities

  Taking Action on Climate Change                          Resource Efficiency                             Commitment to Diversity, Equity &
                                                                                                                  Inclusion (DE&I)
                                                   Continue investment in energy, water
                                                                                                         Implement actions across the business
Evaluate Net Zero Operational Carbon                and waste efficiency measures and
                                                                                                           towards our DE&I framework and
     Commitment, Timing & Plan                       evaluate opportunities to increase
                                                                                                                        strategy
                                                             renewable energy

Recent Accomplishments                           Recent Accomplishments                                  Recent Accomplishments
  13.5% decrease in absolute carbon emissions     Investment in energy efficiency driving 12%            DE&I Committee strengthening our
   since 2018                                       blended yield for our sustainability capex              advancement of diverse talent
   o Science based target to reduce 30% Scope       projects                                               Exceeded our gender diversity goals
        1 & 2 carbon by 2030                       13% decrease in energy use / sq ft since 2018                o > 25% women in leadership
  Earned CDP Climate Change “A List”              Target 20% reduction by 2028                                 o > 30% women on our Board
   designation, underscoring Ventas’s climate      Energy Star Partner of the Year 2021, second           Board is 45% diverse by gender or ethnicity
   change leadership                                consecutive year
                                                   #1 listed healthcare REIT by GRESB for 5th
                                                    consecutive year

                             Recent Accolades: Ventas Continues to be Recognized as an ESG Industry Leader

                                                                                          Nareit’s 2021 Diversity, Equity and Inclusion Awards: Silver
                                                                                          Award Winner
                              Six-Time Winner of Nareit’s
                              Leader in the Light Award,                                  Selected to 2020 Dow Jones Sustainability World Index for
                              which recognizes companies                                  3rd consecutive year
                              that have demonstrated superior
                                                                                          Earned the most ENERGY STAR certifications of any senior
                              and sustained sustainability
                                                                                          housing owner in 2020, with 117 certified senior housing
                              practices                                                   communities representing nearly 11M square feet and 70% of
                                                                                          total U.S. 2020 senior housing certifications

                                                                                          Achieved CDP’s “A List”, underscoring Ventas’s climate
                                                                                          change leadership (recognizing top 2% of global companies
                                                                                          scored)

                                                                                                                                                          12
Case Study: MOB Sustainability Cost Savings Initiatives

Ongoing initiatives across our MOB portfolio to reduce     Projects support Ventas’s commitment to sustainability
energy consumption and carbon emissions at an
attractive return

Cumulative since 2019:

                                                                                                            Greenhouse gas
                                                                                              Energy           emissions
$24M         INVESTMENT
             Includes amounts approved, not yet deployed                                  Reduce energy      Reduce absolute
                                                             Ventas Goal                 intensity by 20%   emissions by 30%
             ASSETS IDENTIFIED FOR UPGRADES                                                  by 2028            by 2030
130+         Building Automation Systems (BAS), HVAC
             Optimization, and/or LED Retrofits
                                                             BAS upgrades

 $3M         PROJECTED ANNUAL SAVINGS
                                                             HVAC Optimization

 13%         ESTIMATED PROJECT IRR
                                                             LED retrofits

                                                               = Targeted towards stated initiative

                                                                                                                               13
Recent Senior
Housing Highlights
Senior Housing Trends

                          Clinical Trends                                            Rapidly improving clinical conditions

                                                                     ~15,300               Continuation of elevated lead
                         February Leads1                             (February)            volumes and 113% vs. 2019

                                                                                           February 2022 quarter-    US: Record-level demand
                           1Q22                                                                                      Canada: 1Q22 occupancy tempered by
                                                                    +420 bps               to-date SHOP same-store
                       Quarter-to-Date                             (February QTD)          average occupancy
                                                                                                                     move-in regulations; leads pipeline
                                                                                                                     should provide lift in 2Q22 as restrictions
                      SHOP Occupancy1                                                      growth vs. 1Q21           ease or are removed

                                                                                           For U.S. SHOP                    Improving market
                           1Q22                                        ~8%                                                  pricing demonstrating
                                                                                           communities, in-house rate
                 In-Place Rate Increases1                              (U.S.)
                                                                                           increased ~8% in 1Q22            pricing power

                            1Q22
                                                                                February expenses elevated over January levels
                     Operating Expenses

                               1Q22                             Received $33 million (or $0.08 per share) of net HHS Grants to date in the
                             HHS Grants                                       first quarter 2022 as previously announced

1. 1Q22 Same-Store Quarterly Year-Over-Year Pool: 321 Assets.
                                                                                                                                                             15
Rapid Improvement in Clinical Conditions – SHOP Clinical Update1
          (As of 02/25)

                                                    VTR U.S. & Canada SHOP Confirmed New Resident & Employee COVID-19 Cases1

        Resident Confirmed New Weekly COVID-19 Cases                                                                                Employee Confirmed New Weekly COVID-19 Cases

               Restrictive protocols challenged sales processes, but operators built large                                            Operators backfilled labor shortages due to COVID-related employee absences
                                       number of leads in January                                                                                     with contract labor and overtime at higher cost

         Reductions in Confirmed New COVID-19 Cases since January                                                                                                         Key Commentary

        Resident Confirmed New Weekly                                 Employee Confirmed New Weekly
        COVID-19 Cases                                                COVID-19 Cases
                                                                                                                                     Clinical conditions resulted in activity and move-in restrictions in
                                                                                                                                      January, some of which have continued, particularly in Canada

                                  (82%)                                                  (81%)                                       Surge in employee absences due to COVID case count increased
                                                                                                                                      pressure on community staffing; operators have reported largely
                                                                                                                                      asymptomatic or mild cases in both residents and staff due to high
                                                                                                                                      vaccination rates in Ventas’s communities

             Resident & employee confirmed new COVID-19 cases improved materially in
                                          recent weeks

                                                                                                                                                                                                                    16
1. Reflects case data for all SHOP total owned assets, including assets Held For Sale; VTR COVID case data as of 02/25/2022. Clinical conditions are highly dynamic and subject to change.
SHOP Leading Indicator Trends (as of 2/28)1

                                                  Strong February leading indicators above pre-COVID and seasonal trends

               Sequential                                 Jan21   Feb21   Mar21                       Apr21       May21        Jun21       Jul21       Aug21        Sep21     Oct21    Nov21    Dec21     Jan22   Feb22
          improvement in Feb-             Leads           11,251 11,893 14,187                        13,727      13,975       14,729      15,719      15,571       14,748    14,563   13,838   12,906    16,417 15,284
            22 move-ins as                Move-Ins           955   1,032   1,414                       1,475       1,539        1,597       1,578       1,496        1,420     1,367    1,306    1,342     1,095   1,292
           COVID-19 began to
                                          Move-Outs        1,456   1,210   1,229                       1,182       1,303        1,213       1,203       1,257        1,193     1,299    1,290    1,313     1,336   1,279
           abate; Jan-22 was
             affected by the              Net Move-Ins      (502)   (178)    185                         293         236          384         375         238          227        68       16       29      (241)     12
            COVID-19 surge                Conversion Rate   8.5%    8.7%  10.0%                        10.7%       11.0%        10.8%       10.0%        9.6%         9.6%      9.4%     9.4%    10.4%      6.7%    8.5%

                          Leads as % of 2019                                                          Move-Ins as % of 2019                                                     Move-Outs as % of 2019

                                                                                                                                  +30%                                                                       (7%)
                                                                                                                              since Jan-21                                                               since Jan-21
                                                  +41%
                                              since Jan-21

                                                                                                                                                                                                                        17
1. Reflects data for 318 of 321 of the 1Q22 year-over-year same-store SHOP assets as of February 28, 2022. Operational conditions are highly dynamic and subject to change.
SHOP Average Occupancy Trends1

                      SHOP (U.S. + Canada) – Average Occupancy                                                                                          U.S. SHOP – Average Occupancy

          1Q22 Same Store YoY Assets                                                                                             1Q22 Same Store YoY Assets
          321 Assets                                                                                                             248 Assets

                                                                                                   Feb-22                                                                                                Feb-22
                                                                                                   QTD                                                                                                   QTD
                                                                                                   average                                                                                               average
                                                                                                   monthly                                                                                               monthly
                                                                                                   occupancy                                                                                             occupancy
                                                                                                   +420bps                                                                                               +570bps
                                                                                                   vs. 1Q21                                                                                              vs. 1Q21
                                                                                                   quarterly                                                                                             quarterly
                                                                                                   average                                                                                               average

                                                           Preliminary           Preliminary                                                                               Preliminary     Preliminary

                             Canada SHOP – Average Occupancy                                                                                                         Key Commentary

          1Q22 Same Store YoY Assets                                                                                               Feb-22 QTD average monthly occupancy +420bps vs. 1Q21
          73 Assets
                                                                                                                                    quarterly average, significantly outperforming historical trends driven
                                                                                                                                    by the ongoing senior housing sector recovery

                                                                                                   Feb-22                             o    U.S. – Record Level Demand: Feb-22 QTD average monthly
                                                                                                   QTD                                     occupancy +570bps vs. 1Q21 quarterly average
                                                                                                   average
                                                                                                   monthly
                                                                                                   occupancy                          o    Canada – Strong Demand Tempered by Move-In Regulations:
                                                                                                   +150bps                                 Feb-22 QTD average monthly occupancy +150bps vs. 1Q21
                                                                                                   vs. 1Q21                                quarterly average
                                                                                                   quarterly
                                                                                                   average
                                                                                                                                           o      Move-in regulations are expected to ease at the end of
                                                                                                                                                  February in Ontario and the end of March for Quebec
                                                           Preliminary           Preliminary
                                                                                                                                           o      Lead pipeline should provide lift as restrictions ease or are
                                                                                                                                                  removed

                                                                                                                                                                                                                     18
1. 1Q22 SS YoY 321 Assets; totals and segments may not add due to rounding. Data as of February 28, 2022. Operational trends are highly dynamic and subject to change.
Senior Housing Operating Expense Trends & Initiatives4

                        4Q21 SS SHOP Operating Results Composition                                                                                                     Key Commentary
         Revenue Composition1
                                                                                                                                1Q22: Dynamic macroeconomic environment causing elevated expenses in
                                                                                                                                 February over January levels across labor, utilities and other operating
    Labor totals                                              NOI2                                                               expenses; COVID-19 surge and weather conditions January to February
    ~45% of                                                                                                                      continued to create employee absences
    revenue
                                                                      HHS Grants                                                4Q21: A tight labor market throughout the quarter, and the COVID-19 surge
    In-House                                                                                                                     drove elevated labor and agency costs in 4Q21 and into 1Q22
    Labor                                                                                             $451M
                                                                                                       4Q21                     SHOP operators engaged in multiple initiatives to enhance recruitment,
                                                                      Management                     revenue                     staffing and development and workforce retention – signs of initial
                                                                      Fees                                                       progress with modestly positive net hiring in each month since Sep-21

                                                            Other
         Contract                                           Operating Expenses
         Labor

                                       4Q21 SS SHOP Labor Trends                                                                                                        Labor Initiatives
         SHOP Labor1,3
                                                                                                                                                                                                   Increased frequency of
                                                                                                                                                                                                    labor reviews with more
                                                                                                                                                                                                    detailed tracking at
     Total                                                                                                                                                                                          property-level
     Labor ($M)
                                                                                                                                                                                                   Expanded hiring
                                                                                                                                   Centralizing                    Improving
                                                                                                                                                                                                    resources and
     Contract ($M)                                                                                                              recruitment efforts             applicant tracking
                                                                                                                                                                                                    reorganized team
     Full Time                                                                                                                                                                                      structures to align to talent
     Labor ($M)                                                                                                                                                                                     and process needs
                                                                                                                                                                                                   Revamped rewards for
                                                                                                                                                                                                    more competitive offerings
     Contract
     Labor as %
                                                                                                                                                                                                   Piloted efforts to enhance
     of Total                3.6%                                6.2%                               7.7%                           Strengthening                Enhance oversight                   work shift flexibility
     Labor                                                                                                                           recruiting                     at focus                       Added marketing support
                                                                                                                                     resources                    communities                       for digital channels

1. 4Q21 SS YOY Pool of 311 Assets, excluding any HHS proceeds; 2. This is a non-GAAP financial measure. Refer to the Non-GAAP Financial Measures Reconciliation tables in our 4Q21 supplemental for additional information and   19
a reconciliation to the most directly comparable GAAP measure; 3. Shown at constant currency. 4. Operating conditions are highly dynamic and subject to change.
Senior Housing Triple-Net Update and Key Actions

                                              Senior Housing Triple Net Commentary

 Since the onset of the pandemic, Ventas has proactively addressed ~90% of its pre-COVID-19 Senior Housing Triple-Net
  Annualized Adjusted NOI through transitions, asset sales and lease resolutions

 Lease resolutions with the remaining ~10% of Senior Housing Triple-Net Annualized Adjusted NOI are coming into focus

        o ~$45M rent across a handful of tenants

 These tenants remain severely pressured by the impact of the COVID-19 pandemic

        o Pandemic impacts are deeper and longer than the significant benefit of Ventas’s lease collateral and credit

        o Ventas has been benefitting from collateral and credit through the pandemic to date

        o Rent expected to be temporarily reduced or deferred in an amount approximating ~$0.01/sh./quarter beginning in 2Q22

 Ventas expects to receive the benefit of upward future performance in its assets through revenue or NOI-based payments, or a
  SHOP structure

                                                                                                                                20
Senior Housing
Portfolio Actions Update
Portfolio Transformation in Senior Housing at a Cyclical Inflection Point4

                                                                                               Compelling Industry Supply and Demand Trends

      U.S. 80+ Population1                                                                                                                        Senior Housing New Starts2
          21M
                           5-Years Post                                     5-Years Post                                                                       14,000
          19M                Financial                                         COVID                                                                           12,000
                                                                                                                                                                                                                                                                                                          (52%) from
                               Crisis                                                                                                                                                                                                                                                                     4Q17 peak
                                                                            +17.4% growth
          17M                                                                                                                                                  10,000
          15M
                             +7.5% growth
                                                                                                                                                                 8,000
          13M                                                                                                                                                    6,000

          11M                                                                                                                                                    4,000

            9M                                                                                                                                                   2,000

            7M                                                                                                                                                         0

                                                                                                                                                                           1Q11
                                                                                                                                                                                  3Q11
                                                                                                                                                                                         1Q12
                                                                                                                                                                                                3Q12
                                                                                                                                                                                                       1Q13
                                                                                                                                                                                                              3Q13
                                                                                                                                                                                                                     1Q14
                                                                                                                                                                                                                            3Q14
                                                                                                                                                                                                                                   1Q15
                                                                                                                                                                                                                                          3Q15
                                                                                                                                                                                                                                                 1Q16
                                                                                                                                                                                                                                                        3Q16
                                                                                                                                                                                                                                                               1Q17
                                                                                                                                                                                                                                                                      3Q17
                                                                                                                                                                                                                                                                             1Q18
                                                                                                                                                                                                                                                                                    3Q18
                                                                                                                                                                                                                                                                                           1Q19
                                                                                                                                                                                                                                                                                                  3Q19
                                                                                                                                                                                                                                                                                                         1Q20
                                                                                                                                                                                                                                                                                                                3Q20
                                                                                                                                                                                                                                                                                                                       1Q21
                                                                                                                                                                                                                                                                                                                              3Q21
            5M
                                                                                                                                                                             2011 2012 2013 2014 2015 2016 2017 2018 2019 2020 2021

                          U.S. 80+ population anticipated to grow by 17%+ through 2025                                                                      Supply levels remain depressed and significantly lower than prior 2017 peaks

                                                   Increased Exposure to Lower Labor, Higher-Margin IL Business and Strong Canadian Market3

      SHOP Unit Mix by Acuity                                                                                                                     SHOP Unit Mix by Country

                         ~32K Units                                      ~62K Units                                                                                    ~32K Units                                                         ~62K Units                                              +11% mix shift
                                                                                9%                                                                                                                                                                                                                     toward
           MC                   17%                                                                                                                                                                                                                                                                   Canada,
                                                                               32%                                                                                                                                                                                                                   providing
                                                                                                                                                                                                                                                   75%                                              exposure to
           AL                   51%
                                                                                                                                                        US                   86%                                                                                                                      outsized
                                                                                                        +27% mix shift
                                                                                                                                                                                                                                                                                                     population
                                                                                                        toward higher-
                                                                               59%                                                                                                                                                                                                                  growth and
                                                                                                          margin IL
                                                                                                                                                                                                                                                                                                  high occupancy
           IL                   32%                                                                        portfolio
                                                                                                                                                        CAN                                                                                        25%                                                 sector
                                                                                                                                                                             14%
                              2Q19                                             4Q21                                                                                         2Q19                                                                  4Q21
                           (Pro Forma)                                                                                                                                   (Pro Forma)

1. Population estimates from the Organization for Economic Co-Operation and Development (OECD); 2. 4Q21 NIC Data for Top 99 (Primary and Secondary) Markets and for the Senior Housing sector; 3. Scope excludes sold assets, Assets Held for sale. 4. Includes
forward-looking statements within the meaning of the federal securities laws and is based on a number of assumptions that are subject to change and many of which are outside the control of the Company. Actual results may differ materially from the Company's                                                             22
expectations depending on factors discussed herein and in the Company’s filings with the Securities and Exchange Commission.
Expected Senior Housing Recovery5

                            Opportunity to Return to Previous NOI Level1                                                                                                                Sizable NOI Margin Opportunity1

           Reflects 4Q21 stable pool of 353 asset comparable to 4Q19                                                                                       Reflects 4Q21 stable pool of 353 asset comparable to 4Q19

                        $156M
                                                                                                                        $296M                                            30.2%
                                                                                                                     annualized
                                                                                                                                                                                                                                                                      ~75% of
                                                                                                                     opportunity
                                                                                                                                                                                                                                                                   SHOP same-
                                                          $90M                                                       as of 4Q21                                                                           19.7%
                                                                                           $82M                                                                                                                                            17.8%                     store NOI
                                                                                                                       to return
                                                                                                                                                                                                                                                                    loss driven
                                                                                                                    SHOP same-
                                                                                                                                                                                                                                                                    by revenue
                                                                                                                    store NOI3 to
                                                                                                                                                                                                                                                                   deterioration;
                                                                                                                          pre-
                                                                                                                                                                                                                                                                       sizable
                                                                                                                      pandemic
                                                                                                                                                                                                                                                                       margin
                                                                                                                         level
                                                                                                                                                                                                                                                                   improvement
                                                                                                                                                                                                                                                                    opportunity
                          4Q19                             4Q20                             4Q21                                                                          4Q19                            4Q20                             4Q21

   Occupancy 87.9%                                         79.1%                           80.4%

                                                                                                              SHOP NOI Recapture Opportunity2

                     Occupancy                                                                                              Occupancy
                        80%                                                                                                   ~88%                                                                            Incremental Occupancy Growth
                                                                                                                                                                                                               Opportunity Above Pre-COVID
                                                                                            ~$100M                             ~$900M
                                                         ~$300M                                                                                                Incremental growth
                                                                                                                                                                  potential from
                                                                                                                                                                favorable supply /                                                        Additional potential
                        $520M
                                                                                                                                                                  demand levels                             +400bps                       occupancy growth to pre-
                                                                                                                                                                                                                                          COVID peak of ~92%
                                                                                                                                                              expected to be better
                                                                                                                                                                 than pre-COVID

                                                                                                                                                                 Opportunity for                                                          Expected U.S. 80+
               4Q21 Annualized NOI               SHOP Same-Store NOI
                                                 Recovery Opportunity
                                                                                   Incremental SHOP NOI
                                                                                      Opportunity from
                                                                                                                         Post-COVID SHOP
                                                                                                                       Portfolio NOI Recovery
                                                                                                                                                                pricing to improve
                                                                                                                                                              versus current strong
                                                                                                                                                                                                              +17.4%                      population growth from
                                                                                                                                                                                                                                          2020-2025
                                                                                    Previously Completed                     Opportunity
                                                                                         Transitions,                                                         levels as occupancy
                                                                                       Acquisitions &                                                                increases
                                                                                       Developments                                                                                                                                       Lower construction starts4

                Reported 4Q21 NOI                   Annualized SHOP                  Incremental SHOP
                                                                                                                                                                                                                (52%)                     in 4Q21 vs. previous peak
                                                                                                                                                                                                                                          in 4Q17
                  excluding HHS                      same-store NOI                  NOI assuming these
                    grants x 4                      assuming return to                 properties reach
                                                       4Q19 levels                    stabilized levels3

1. Excludes HHS Grants; 2. Excludes sold assets, assets held for sale and HHS Grants; 3. Stabilized Transition, Acquisition and Development NOI levels reflect pre-COVID NOI for acquisition & transition properties and underwritten stabilized NOI for development properties;
4. 4Q21 NIC Data for Top 99 (Primary and Secondary) Markets and for the Senior Housing sector. 5. The Company's expectations regarding future performance constitutes forward-looking statements within the meaning of the federal securities laws and is based on a
number of assumptions that are subject to change and many of which are outside the control of the Company. Actual results may differ materially from the Company's expectations depending on factors discussed herein and in the Company’s filings with the Securities and          23
Exchange Commission.
Strongly Positioned Portfolio Supported by Advantaged SHOP Assets1

                                                                                                       Competitively Advantaged SHOP Assets

               Advantaged Assets in
               High Barrier Markets2
                                            near premium
                    ~90%                    retail or high
                                            traffic locations3

                                            higher home                                                                    Atria West 86                                                                                            LGM La Cité des Tours
                      2.4x                  value vs. U.S.
                                            average4
                                                                                                                           New York, NY                                                                                             Saint-Jean-sur-Richelieu, Quebec

                                            higher household
                      1.5x                  income vs. U.S.
                                            average4

                                            of SHOP
                    ~60%                    Ann. Adj.
                                            NOI5

                                            of SHOP by
                    ~40%                    assets
                                                                                                                           Holiday Birch Heights                                                                                    Sunrise at La Costa
                                                                                                                           Derry, NH                                                                                                Carlsbad, CA

                                                                                           Capital Investment Strategy Underpinning Portfolio Quality

                              Data-Driven Allocation Framework                                                           High-Impact Prioritization                                                                Coordinated Project Execution
                              Granular submarket analytics inform
                              investment decision making
                                                                                                                        Customer-facing upgrades enhance overall
                                                                                                                         community appeal, among resident & staff
                                                                                                                                                                                                                   Delivery supported by on-site visits, bespoke
                                                                                                                                                                                                                   diligence and closer operator alignment

1. Reflects 4Q21 supplemental reporting owned asset scope; 2. High barrier markets primarily reflect top coastal markets and Canada; 3. Reflects U.S. scope only; 4. Reflects median value for U.S. scope only; 5. Based on 4Q21 annualized adjusted NOI per
supplemental reporting.
                                                                                                                                                                                                                                                                       24
– Ventas OI™

                                                                     What is Ventas OI?
       Ventas Operational Insights (“Ventas OI”) is the data and operational analytics active asset management platform formally launched in 2022.
This dedicated, focused platform supports our collaboration with managers in pursuit of our strategy of the right assets, with the right operators, in the right
                                       markets, which ultimately drives value creation and portfolio optimization.

                                                               Deep Capabilities and Expertise
                                                                   Key Strategic Priorities
                                                                      Core Objectives

                                                           Active Asset Assessment

     In-House                                                  Right               Right                                                           Data
     Operating                                                 Markets            Assets                                                         Driven
     Expertise                                                                                                                               Insights &
                                                                                                                                             Execution
                                                                        Right
                               Advanced                               Operators                              Comprehensive
                                 Market                                                                      Operating
                               Selection                                                                     Alignment

      Highly effective strategy to drive portfolio actions and optimize the right combination of markets, operators and assets

                                                                                                                                                                   25
Recent Portfolio Actions Position Senior Housing for Value Creation1

                                                                        •    Executed lease resolutions supporting
                                                                             mutually beneficial financial and
                                                                                                                                                       300+ Assets
                              Resolutions &                                  operating terms
                               Transitions
                                                                        •    Transitioned various portfolios to new
                                                                             operators / management structures                                         10+               Operators

                                                                       •    Acquired over 100 assets with
                                                                            favorable market exposure and                                             ~120                Assets
                                                                            attractive physical characteristics
                                                                       •    Partnered on several completed & in-                                      8                  Operators
                             Acquisitions &                                 progress development projects with
                             Developments                                   high-quality managers                                                     ~$3B Acq. volume
                                                                       •    Emphasis on high margin, lower labor
                                                                            cost IL model with high occupancy                                         ~5%                Initial yield
                                                                            ceiling and longer length of stay

                                                                                                                                                       50+               Assets
                                                                        •    Enhanced portfolio via completed
                                                                             sales of smaller scale, non-strategic
                               Dispositions                                  assets                                                                   10                 Operators
                                                                        •    Selectively pursuing sale of specific
                                                                             non-core communities
                                                                                                                                                      $620M Sold

                                          Completed an array of portfolio-enhancing actions covering nearly two-thirds of the portfolio since 2020

1. The Company's statements regarding future performance constitute forward-looking statements within the meaning of the federal securities laws and is based on a number of assumptions that are subject to change and many of which are outside the control of the
Company. Actual results may differ materially from the Company's expectations depending on factors discussed herein and in the Company’s filings with the Securities and Exchange Commission.
                                                                                                                                                                                                                                                                       26
Notable SHOP Capital Recycling Activity and Portfolio Actions1

                         Resolutions & Transitions                                                                Acquisitions & Developments                                                                                   Dispositions

          Brookdale Lease Resolution                                                                    New Senior Acquisition                                                                       Non-Strategic SHOP Sales

           Lake Shore Drive                                                                              Pioneer Valley Lodge                                                                         Bonita
                                                                   ~$235M up-front
                                                                   consideration                                                                                 $2.3B                                                                                        20+
                                                                   for VTR                                                                                       accretive                                                                                    assets
                                                                   replacing over                                                                                acquisition
                                                                   2.5 years of cash
                                                                   rent reduction                                                                                103
                                                                                                                                                                                                                                                              Over $270M
                                                                                                                                                                 independent
                                                                                                                                                                                                                                                              gross
                                                                   Covers ~120                                                                                   living
                                                                                                                                                                                                                                                              proceeds
                                                                   communities                                                                                   communities

                 Mutually beneficial arrangement provides near-term                                        Accretive acquisition positions Ventas to capture powerful                                  Divestiture from non-strategic assets improves supply and
                          flexibility and longer-term upside                                                                 senior housing upside                                                                       demographic exposure

          Transition 90 Execution                                                                       Hawthorn Canada Acquisition                                                                  Non-Core NNN Dispositions

           Stoney Ridge                                                                                  Rosewood Estates                                                                             Wood Ridge
                                                                   7 new                                                                                         $180M
                                                                                                                                                                 acquisition                                                                                  5+
                                                                   portfolio
                                                                                                                                                                 across 6                                                                                     assets
                                                                   operators
                                                                                                                                                                 communities

                                                                   5 of 7 operators                                                                              IL and AL
                                                                                                                                                                                                                                                              ~$120M
                                                                   represent                                                                                     exposure
                                                                                                                                                                                                                                                              gross
                                                                   new SHOP                                                                                      totaling 717
                                                                                                                                                                                                                                                              proceeds
                                                                   relationships                                                                                 unites

              Successfully transitioned communities to new managers                                        Expanded Ventas presence in attractive Canadian sector                                         Sale of several non-core Senior Housing NNN assets
                           with strong local market focus                                                         and strengthened Hawthorn relationship                                                                enhances portfolio quality

1. The Company's statements regarding future performance constitute forward-looking statements within the meaning of the federal securities laws and is based on a number of assumptions that are subject to change and many of which are outside the control of the
Company. Actual results may differ materially from the Company's expectations depending on factors discussed herein and in the Company’s filings with the Securities and Exchange Commission.
                                                                                                                                                                                                                                                                         27
Expanding Independent Living Footprint1
                 “The structural benefits of the independent living model present attractive opportunities to                                                                                                             J. Justin Hutchens
                 further strengthen our senior housing platform”

                                                                                                                SHOP Unit Mix by Acuity Type2

                                                      2Q19 (Pro Forma)                                                                                                                                              4Q21

                                                            ~32K Units                                                                                                                                         ~62K Units
                                                                                                                                                                                                                      9%
             MC                                                   17%

                                                                                                                                                                                                                     32%

                                                                  51%
                                                                                                                                +27% IL unit
             AL
                                                                                                                                 mix shift
                                                                                                                             by adding over 25K IL                                                                                                   ~65% in U.S
                                                                                                                              units in high quality                                                                                                  and 35% in
                                                                                                                                                                                                                     59%
                                                                                                                              portfolios across the                                                                                                  Canada
             IL                                                   32%                                                          U.S. and Canada

                                                                 2Q19                                                                                                                                                4Q21

                                           Key IL Portfolio Additions since 2019                                                                                                     Expected Structural Benefits of IL Model

                   LGM                           Holiday                        New Senior                      Hawthorn                                                           Less labor-intensive
                  (Sep19)                        (Apr20)                         (Sep21)                         (Oct21)                                                           staffing model with in-
                                                                                                                                                               Lower                                                           High                 ~40% pre-
                                                                                                                                                                                   home services and
                                                                                                                                                               Labor                                                          Margins               COVID
             •    High quality               •    New                       •    Closed on New              •    Closed 6-asset                                                    home health
                  portfolio                       management                     Senior                          acquisition of                                                                                                                     margins
                                                                                                                                                                                   complementing IL
                                                  agreement                      acquisition                     predominately IL
             •    Diversifies                                                                                    communities                                                       offering
                  business                   •    Enables                   •    Positions Ventas
                  model,                          operational                    to capture                 •    Canadian
                  geographic                      flexibility                    powerful                        portfolio with                             Longer                                                                                  20% less IL
                  and operator                                                   industry upside                 favorable market                                                  ~3 years average LOS                        Less
                                                                                                                                                           Length of                                                                                construction vs AL
                  mix                                                                                            dynamics                                                          and younger residents                      Supply3
                                                                                                                                                             Stay                                                                                   since 2017

1. The Company's statements regarding future performance constitute forward-looking statements within the meaning of the federal securities laws and is based on a number of assumptions that are subject to change and many of which are outside the control of the
Company. Actual results may differ materially from the Company's expectations depending on factors discussed herein and in the Company’s filings with the Securities and Exchange Commission. 2. Scope excludes sold assets, Assets Held for sale; 3. Average          28
construction as a percent of inventory 1Q17 to 3Q21 for Majority IL vs Majority AL as reported by the National Investment Center (NICMAP).
Growing Ventas’s Independent Living Footprint in Canada with LGM

                                                             LGM - IVVI                                       LGM - VAST

   High quality portfolio of                                               Montreal, QC                                    Montreal, QC
apartment-like senior housing                                              399 Units                                       378 Units
  communities in attractive                                                >95% occupied                                   >95% occupied
      Quebec market                                                        >6% projected                                   >6% projected
                                                                            stable cash                                      stable cash
                                                                            yield                                            yield
  Ventas has an exclusive
   development pipeline
 agreement with Le Groupe                    Opened: October 2020                            Opened: December 2020
         Maurice                                 Cost: $73M                                       Cost: $72M

           LGM – Elogia II                               LGM - Cornelius                                       LGM - LIZ

                        Montreal, QC
                        Occupancy:
                                                                                                                            Montreal, QC
                         ~75%, driven                                      Montreal, QC
                         by pre-leasing                                                                                     336 Units
                                                                           291 Units
                        287                                                                                                >6% projected
                                                                           >6% projected
                         apartments,                                                                                         stable cash
                                                                            stable cash
                         retail                                                                                              yield
                                                                            yield
                        >6% projected
                         stable cash
                         yield            Construction Start: May 2019                      Construction Start: Dec 2020
 Opened: Jun 2021
                                            Expected Opening: 2022                           Expected Opening: 2023
   Cost: $84M
                                                  Cost: $95M                                       Cost: $112M

                                                                                                                                         29
Office Business Update
Operational Excellence Driving Outperformance in Medical Office

  Successful Leasing Advanced Medical Office (MOB) Occupancy                                Customer Satisfaction is a Pillar for Healthy Buildings

               3.5M SF leases executed FY for MOB
      MOB signed +55% more new leasing sq. ft. FY year-over-year                                                              
                                                                                                                            90% For the 2nd consecutive year, we
                                                                                                                  79th
                                                                               100%                 75th
                                                                                                                            80% ranked in the top quartile of our
                                                                               90%                                              peers for tenant satisfaction
                                   95                                          80%                                77%
                                                                                                                            70%
                                                                                                                               Tenant renewal intentions jumped
                                                                                          71%       72%                     60%
                                   %                  MOB Occupancy            70%
                                                                                                                                to the 94th percentile driven by value
                                                                                                                            50% for amount paid in the 95th percentile
                         92%
                                                          91.7%                60%       51st                               40%
                                                                                                                               Customer Satisfaction Drives
   MOB SS       86%                                 Highest Since 2017         50%                                          30% Retention and Occupancy: MOB
  retention                                                                    40%                                          20% same-store occupancy increased
holding firm                                                                                                                    sequentially in 4Q21 for the 5th
                                                                               30%                                          10%
                 YTD      QTD     Dec-21                                                                                        consecutive quarter, with new
                                                                               20%                                          0% leasing up ~55% and customer
                                                                                         FY19       FY20         FY21           retention of 92% for 4Q21
  Since 2020, Ventas has created a centralized leasing center of excellence,
     built a technical engineering team, expanded our tenant satisfaction                Response Rate          KI Percentile
    program and established a digital marketing program focused on local
                               market awareness

                  Operational Cost Savings Initiatives                                                     Medical Office Performance

                                                                                 Focused on driving outperformance through robust evaluation and
                                                                                  operational excellence:
        Electric Utility Savings
         Realized 55% cost reduction in energy management contracts                  o Leasing and retention
         Achieved 14% reduction in weighted average cost of energy at
          impacted buildings                                                          o Customer Relationship Management (CRM) & tenant service

                                                                                      o Expense control
        Repairs and Maintenance
         Generated 14% savings in supplies procurement by pooling                    o Strategic reinvestment
          spend across multiple operators in select regions
         Created 13% savings in maintenance services by aggregating
          contracts in our largest markets, streamlining vendor
          management from 55 to 4

                                                                                                                                                                31
Disciplined Expansion of Our MOB Footprint

                        Buyout of PMB’s Interest in Sutter Van Ness MOB                                                                                                    Expanding Relationship with Ardent Health Services

           In September 2021, Ventas, in connection with its long-standing                                                              In February 2022, acquired 18
            partner Pacific Medical Buildings (“PMB”), completed a buyout of                                                              MOBs spanning 732K sq. ft. from
            PMB’s interest in the state-of-the-art, newly developed Sutter                                                                Ardent, expanding Ventas’s
            Van Ness Medical Office Building                                                                                              relationship with Ardent Health
                                                                                                                                          Services for $200M
           92% leased and is connected to Sutter Health’s flagship hospital in
            an unparalleled location in downtown San Francisco                                                                           Portfolio is located in Ardent’s
                                                                                                                                          existing markets, over 90% on
           Ventas now owns 100% of this trophy asset at an all-in basis of
                                                                                                                                          campus and 100% leased to
            $173M or a 5.9% yield on expected 2022 NOI, representing
                                                                                                                                          Ardent with an expected GAAP
            significant expected value creation
                                                                                                                                          yield of 5.8%
           Continued leasing opportunity

                                                                                                                                                             Early Entry
                                                                                                                                            Strategically Invested       into MOB
                                                                                                                                                                    in Asset  ClassSpace
                                                                                                                                                                                    at the Right Time

                                                                                                                                                                         220
                                                                                                                                                                         200
                                                                                                                                                                         180

                                                                                                                                        Historical Commercial Property
                                                                                                                                                                         160
                                                                                                                                                                         140

                                                                                                                                                  Price Index1
                                                                                                                                                                         120
                                                                                                                                                                         100
                                                                                                                                                                          80
                                                                                                                                                                          60
                                                                                                                                                                          40
                                                                                                                                                                          20
                                                                                                                                                                           0
                                                                                                                                                                            2005   2007   2009    2011   2013    2015   2017   2019   2021

                                                                                                                                                                                    VTR completed >$2.5B of MOB
                                                                                                                                                                                   acquisitions between 2010 - 2012

                                                                                                                                                                                                                                        32
1. Historical Medical Office Commercial Property Price Index from Green Street Advisors; average of twelve months in respective year.
Ventas Has a Leading National Medical Office (MOB) Platform

     MOB Platform is Focused in Advantaged Locations with Strong
                                                                                                 Ventas Has Favorable Tenant Specialty Mix
                           Credit Tenants

                                                                                  % of Physician Occupied MOB sq. ft.

                                                      96%
                                                      Affiliated with                                                           14%
                                                      Health System or

                     72%                              Hospital

                   On-Campus
                                                      88%
                                                      Strong Credit                                                           86%
                                                      (Investment Grade +
                                                      HCA)
                                                                                                              Primary Care      Specialty

    ~90% occupied portfolio                                                          Several benefits of high specialty care mix (86% of the portfolio):
    Weighted average lease term of ~5 years with embedded growth through              o   Generates higher revenue for hospitals through use of operating
     escalators                                                                            rooms, diagnostics and other high value services
    Principally affiliated with strong health systems with high market share,         o   Typically requires high tenant improvement and tech investment,
     favorable payor mix and operating margins                                             resulting in greater relocation cost and tenant “stickiness”
    On-campus assets provide health system multiple key benefits
    o Central, convenient practice locations to improve physician recruiting
    o Higher reimbursement for hospital practices                                     ~18M sq. ft. of MOB space across 31 states, serving 14,000
    o Cost efficiencies and integrated services to drive higher acuity business        care providers and attracting 27M patient visits each year
 In 2021, enhanced portfolio quality via disposition of over 30 non-core MOBs
  resulting in approximately $440M gross proceeds to Ventas at a ~5%
  cash yield which increased occupancy by ~250 bps and increased our on-
  campus concentration

                                                                                                                                                             33
Ventas’s Leading National Medical Office (MOB) Platform

    $374M                 311                                     18M                                                      ~160                         31
  Ann. Adj. NOI                                                                                         Hospital + Health
                         MOBs                               Outpatient Sq. Ft.                                                                         States
   (22% VTR)                                                                                            System Affiliations

                                                                                                                                VT NH
                                  WA

                                                      MT                                                                            ME
                                                                 ND
                                                                                                                                        M
                                 OR                                         MN
                                                                                                                                        E
                                           ID                                          WI
                                                                 SD                                                        NY
                                                                                                                                                 MA
                                                       WY                                         MI                                              RI
                                                                             IA                                       PA                         CT
                                           ID                    NE
                                      NV                                                                                                    NJ
                                                 UT                                         IL   IN    OH
                                                                                                                                            DE
                                                           CO                                               WV
                                                                                                                                            MD
                            CA                                                   MO                                   VA
                                                                      KS                                                           DC
                                                                                                 KY
                                                                                                                  NC
                                                                                                 TN
                                            AZ                         OK                                   NC
                                                       NM                         AR                             SC

                                                                                                 AL     GA
                                                                                            MS

                                                                  TX              LA

                                                                                                                 FL        F
                                                                                                                           L

              Reliable Growing Cash Flows from High-Quality Outpatient Portfolio

                                                                                                                                                                34
Ventas’s Life Science, R&I Portfolio

Ventas now owns or has
investments in a 10M sq. ft.
Life Science, R&I portfolio,
including developments
underway:

 Residing on the campuses of >17
  top-tier research universities
  collectively ranking in the top 5% of
  all NIH funding and conducting over
  10% of all university life science
  research and development in the
  United States

 Including a presence in five of the
  top six life science clusters: San
  Francisco, CA, Cambridge, MA and
  Maryland-DC, Raleigh-Durham &
  Philadelphia

 Containing 43 operating
  properties spanning 8M sq. ft.

 Including three in-progress
  developments, consisting of over
  2M additional sq. ft., including the
  recently announced project with UC
  Davis
                                          Top 5 Life Science Clusters

                                                                        35
Ventas Life Science, R&I Operational Update

         Growing Life Science Funding Expected to Further Drive Demand                                                                                         Excellent Tenant Credit

            Industry Insights                               San Francisco Market Spotlight                                                    75% Publicly Traded or Excellent Credit Tenants
     •    In 2021, VC funding for US
          life science companies                           2.5                                Demand for life                                                                         % of Total
          jumped to ~$38B, an                              M                 2.0              science space                                                                           Annualized                 Tenant Credit
          increase of +41% YoY and                         SF                M                outstrips 2022                                                                          Base Rent
          +120% from 20191                                                   SF               projected
                                                                                                                           Yale University                                                  8%                          AAA
     •    NIH Funding expected to                                                             supply by 25%4
          increase over +12% for                                                                                           University of Pennsylvania                                       7%                          AA+
          2022 ~$48B to ~$49B2                                                                                             Wake Forest University                                           7%                           AA
     •    Both House and Senate                                                               Rents have
                                                                                                                           Brown University                                                 4%                          AA+
          budget proposals fund                                                               increased
          ARPA-H a new agency to                                                              +17% over the                Remaining Tenants                                               74%
          drive biomedical                                                                    past twelve
                                                        Demand             Supply                                                                                                         100%
          breakthroughs3                                                                      months5

          Continued Strong Demand for Lab Space Expected to Bolster
                                                                                                                                             Life Science, R&I Performance Commentary
                        Occupancy and Fuel Lease Up
                                                                                                                            Life Science, R&I portfolio benefits from strong industry tailwinds
         Full-Year Same-Store                                       Development Lease Up
              Occupancy                                                                                                     Lab space demand driving strong portfolio occupancy of 94% and substantial
                                94.0                                                                                         pre-leasing at properties under development
           93.8                                          Committed
                                 %                                                                                          75% publicly traded or excellent credit tenants
            %                                                 85%
                                                                                                                            Two exciting redevelopment opportunities in attractive Winston-Salem and
                                                                                                                             Raleigh markets
                                                                                                                                          o Two tenants to vacate in 2Q22, enabling conversion to high
                                                                                                                                            demand lab space
                                                                                                    Availab
                                                                                                      le                                  o Sequential impact of ~$4M (2Q22 vs. 1Q22)
          Dec-20              Dec-21                                                                 15%
            Our buildings have                                Recently completed and properties
         attracted ~3x more new                                 currently being developed are
               tenants YoY                                    substantially leased / pre-leased

1. Venture Monitor Q4 2021, Pitchbook-NVCA. Data as of 12/31/2021. 2. NIH Office of Budget; NIH Funding FY2006-FY2022. 3. Congressional Research Service, June 2021; FY Budget Outlook: NIH, AIP. 4. Life Science Quarterly,   36
Q4 2021. 5. CBRE U.S. Life Sciences Trends, November 2021.
Life Science, R&I Projects Recently Delivered
    & Under Construction
                                                                        $1B Project Cost                             $1B Project Cost

                                                                   Recently Delivered &                   UC Davis
Ventas’s Exciting Life Science, R&I Development Pipeline                                                                         Near-Term Pipeline
                                                                   Under Construction

         Arizona State University (Recently Delivered)                                     University of Pittsburgh (Recently Delivered)

                                     >70% leased or under LOI                                                          70% preleased to University of
                                      including to ASU                                                                   Pittsburgh and UPMC
                                     ~7.7% projected stable cash yield                                                 ~7% projected stable cash yield
                                     Developed in a JV with GIC                                                        Developed in a JV with GIC

             227K SF                                                                          353K SF
   Construction Start: Dec 2018                                                     Construction Start: May 2019
          Open: 4Q20                                                                      Opened: 1Q22
     Cost: $87M ($385 PSF)                                                           Cost: $278M ($785 PSF)

              Drexel University College of Nursing                                                         One uCity Square

                                     100% leased to Drexel University                                                   >70% leased or under LOI
                                      College of Nursing and Health
                                                                                                                         Showing strong preleasing activity
                                      Professions and Drexel College of
                                      Medicine                                                                           ~7% projected stable cash yield
                                     ~7% projected stable cash yield                                                    Being developed in a JV with GIC
                                     Being developed in a JV with GIC

             450K SF                                                                         400K SF
   Construction Start: Sep 2019                                                     Construction Start: Jun 2019
    Expected Opening: 2023                                                           Expected Opening: 2023
    Cost: $295M ($656 PSF)                                                           Cost: $284M ($711 PSF)

                                                                                                                                                      37
University of Pittsburgh: The Assembly

                                                              $1B Project Cost                             $1B Project Cost

                                                          Recently Delivered &                 UC Davis                Near-Term Pipeline
                                                          Under Construction

                              Expanding the Life Science, R&I Portfolio with the Assembly in Pittsburgh, PA

 Ventas delivered the Assembly in February 2022                         The Assembly, Phase I | Pittsburgh, PA

 Anchored by the world-renowned University of
  Pittsburgh in collaboration with University of
  Pittsburgh Medical Center researchers under a
  long-term lease

 The Assembly, which is over 90% leased or
  committed, is a meticulously rendered life science
  and innovation center focused on cutting-edge
  immunotherapy and transplantation research

 The iconic campus, containing 350,000 sq. ft., is
  expected to achieve an 8% GAAP yield upon
  stabilization with total project costs of $278M

                                                                                                                                       38
Life Science, R&I Development Project with UC Davis: First of $1B
Near-Term Pipeline
                                                  Ventas’s Exciting Life Science, R&I Development Pipeline
 Ventas committed to a Life Science, R&I              $1B Project Cost                       $1B Project Cost
  development project anchored by the
  University of California, Davis, a premier      Recently Delivered &             UC Davis               Near-Term Pipeline
  research institution ranked in the top 5% of    Under Construction
  universities for both NIH funding and            Arizona State University
  R&D spend                                        University of Pittsburgh
                                                   Drexel University
 Project to be the first phase of Aggie            College of Nursing
  Square, a planned innovation district located    One uCity Square
  on the University’s Sacramento campus and
  adjacent to UC Davis Medical Center
 Spans ~1M sq. ft.
 Developed with Ventas’s exclusive partner
  Wexford, the project is principally
  laboratory space and related uses that will
  complement existing activities at UC Davis
  Health Science Campus, including health
  sciences research, product development and
  manufacturing, academic and commercial
  research, incubator and accelerator space
  and shared labs
 60% pre-leased to UC Davis (Moody’s Aa2)
 Construction expected to commence in
  1H22
 Project costs of ~$0.5B with an expected
  stabilized cash yield exceeding 6%
 One of the pre-identified Life Science, R&I
  development projects in Ventas’s R&I
  development partnership with GIC

                                                                                                                         39
Approximately $1B Attractive Life Science, R&I Development Opportunities
   with Leading Research Universities
                                            Ventas’s Exciting Life Science, R&I Development Pipeline
                                                 $1B Project Cost                         $1B Project Cost

                                            Recently Delivered &             UC Davis                 Near-Term Pipeline
                                            Under Construction
                                             Arizona State University
                                             University of Pittsburgh
                                             Drexel University
                                              College of Nursing
                                             One uCity Square

                               ACTIVE POTENTIAL OPPORTUNITY #1                 ACTIVE POTENTIAL OPPORTUNITY #2

Relationship                                   New                                              Existing

Market + Relationship                Major research university               Major health system & university collaboration

Principal Space Use                            Lab                                   Academic / Office / Research

Size (sq. ft.)                             ~350K sq. ft.                                     ~500K sq. ft.

Est. Development Budget                       $0.3B                                              $0.3B

Est. Stable Cash Yield                     6.0% - 6.5%                                       6.5% - 7.0%

Pre-Leasing                                 Significant                                       Significant

Est. Construction Start                        2023                                           2022 / 2023

Est. Construction Completion                   2025                                              2024

Percentile of NIH Funding           At or above 95th percentile                       At or above 95th percentile

                                                                                                                         40
Loan Portfolio Update
Improving Predictability, Increasing Real Estate-Generated NOI:
 Well-Structured High-Rate Cash-Pay Notes Fully Repaid

                                      Ventas’s Loan Book Represents 11%                              to Santerre Health Investors (formerly subsidiaries of Colony Capital,
 Notable Repayments of Cash Pay Loans:                                         Inc.) at LIBOR + 6.42%

  o Ardent Loan: Originated a $700M loan at an 8% yield in 2017, fully         Collateral is a diverse pool of 158 medical office, senior housing and
    repaid in 2018 at a 13% unlevered IRR                                       other healthcare assets
  o Ardent Notes: Purchased $200M senior notes at a 9.75% yield in             5-year term, inclusive of three one-year extension options; next
    2018, fully repaid in 2021 at a 12% unlevered IRR                           extension option in June 2022
  o Brookdale: In connection with mutually beneficial arrangements with        Freely prepayable
    Brookdale Senior Living agreed in 2020, received a $45M Note at a
    9% yield, fully repaid in 2021 at a 9% unlevered IRR
  o Holiday Loans: In connection with the transition of 26 Holiday triple
    net leased communities to a SHOP structure, received $66M
    aggregate principal amount of secured Notes from the prior
    guarantor of the Holiday lease, fully repaid in 2021 at a 10%
    unlevered IRR

                                                                                                                                                              42
Capital Structure Actions
Capital Structure Actions; Expanded Disclosure

               Ensured Financial Strength & Flexibility                                        Financial Statistics YE 2021

 In 2021, Ventas enhanced its portfolio and strengthened its balance      Financial Statistics at Year-End 2021:
  sheet through $1.2B in asset dispositions and loan repayments
                                                                            o $2.5B year-end liquidity
  o Non-core senior housing and MOB asset sales generated $850M of
    proceeds at a 11%
                                                                              increase of four percentage points vs. prior year
  o Reduced near-term maturities by $1.1B in FY21 via proceeds              o Average cost of debt is 3.4% with a total weighted average maturity
    from dispositions and loan repayments                                     of >6 years
 To manage interest rate risk, Ventas raised over $1.1B in new bonds
                                                                            o BBB+ or equivalent ratings across all 3 rating agencies
  in the US and Canada, including a 10-year offering with a coupon of
  2.5%, the best 10-year healthcare REIT issuance in 2021
 Ventas expects $0.2B of asset dispositions in the first half 2022

                         Expanded Disclosure

 Provided additional insights and disclosure as part of 4Q21 earnings,
  including sequential (4Q21 vs. 1Q22) SHOP guidance assumptions,
  and a reported segment NOI to FFO trending schedule

                                                                                                                                                  44
You can also read