Transmission Channels of Central Bank Asset Purchases in the Irish Economy - economies

Page created by Franklin Kelly
 
CONTINUE READING
Transmission Channels of Central Bank Asset Purchases in the Irish Economy - economies
economies
Article
Transmission Channels of Central Bank Asset
Purchases in the Irish Economy
Cormac Cawley and Marie Finnegan *
    School of Business, GMIT, H91 TRNW Galway, Ireland; c_cawley@hotmail.com
    * Correspondence: marie.finnegan@gmit.ie
                                                                                                              
    Received: 17 June 2019; Accepted: 13 September 2019; Published: 23 September 2019                         

    Abstract: The European Central Bank (ECB) engaged in an expanded asset purchase programme
    (APP) from 2014 to 2018 to help achieve their primary objective of price stability. Total assets purchased
    over this period was over €2.5 trillion and new net purchases ended in December 2018. This paper
    identifies whether the ECB’s APP in Ireland operated through the portfolio rebalancing channel,
    the signalling channel or the lending channel. It presents a quantitative descriptive analysis of some
    key Irish data sets in the 2014–2018 period and uses time-series visualisation and trend analysis to
    identify trends and correlations. There are a number of preliminary findings. First, much downward
    pressure on sovereign debt yields and spreads had occurred before the APP began due to previous
    accommodative monetary policy and the signalling channel. Second, the corporate-sector purchase
    programme (CSPP) did impact on targeted bonds and may have had spill overs to non-targeted bonds.
    Third, the APP did not lead to much increased lending to the SME sector. Fourth, while households
    did engage in traditional portfolio rebalancing, Irish banks did not and were perhaps more motivated
    to meet their capital requirements and manage their level of reserves. This is a first step towards
    understanding the transmission channels of ECB policy in Ireland and more work needs to be done
    to detangle the transmission of the most recent APP from other factors and consider these findings in
    the context of theoretical models. Such work is important to help inform policy makers on enhancing
    the transmission mechanism to the Irish economy of the recently launched new ECB asset purchase
    programme from November 2019.

    Keywords: quantitative easing; asset purchase programme; Ireland; transmission channels of QE

    JEL Classification: E52; E58

1. Introduction
     In 2013 and 2014, Euro-area inflation was falling well below the European Central Bank’s (ECB)
price stability target of below, but close to, 2 percent over the medium term. In 2014, the ECB decided
to engage in an expanded asset purchase programme (APP), a quantitative easing (QE) effort, aimed
at returning inflation to levels consistent with this price stability target (ECB 2014a, 2015, 2016)1 .
The initial asset purchase programme comprised two separate programmes, which included the
third covered bond purchase programme2 (CBPP3) launched in October 2014 and an asset-backed
securities purchase programme (ABSPP) in November 2014. This programme was expanded to include
a secondary markets public-sector asset purchase programme (PSPP) initiated in March 2015 and a

1     QE and APP will be used interchangeably in this paper as they are taken to mean the same monetary policy.
2     The ECB had engaged in covered bond purchases before 2014 with a covered bond purchase programme (CBPP) announced
      in May 2009.

Economies 2019, 7, 98; doi:10.3390/economies7040098                                   www.mdpi.com/journal/economies
Transmission Channels of Central Bank Asset Purchases in the Irish Economy - economies
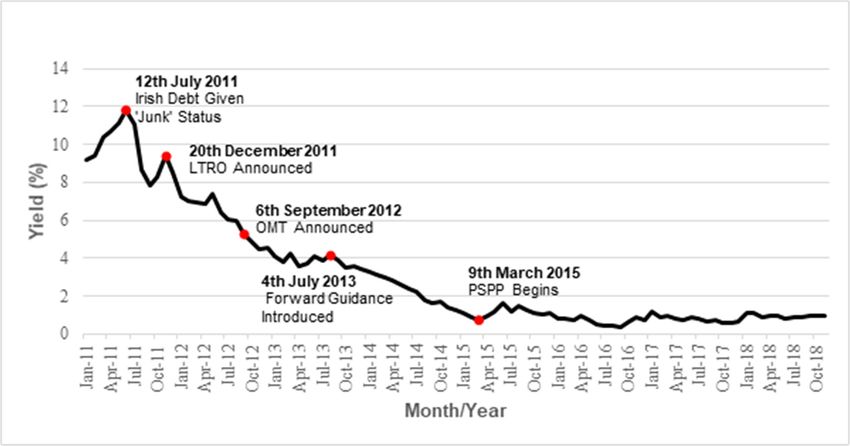
Economies 2019, 7, 98                                                                                               2 of 25

corporate-sector purchase programme (CSPP) in March 2016. Collectively, these programmes are
referred to as the expanded asset purchase programme or quantitative easing.
      Between September 2014 and the end of 2018, the ECB purchased over €2.5 trillion worth of
securities under these four programmes3 (Larkin et al. 2019, p. 3). Net APP purchases ended in
December 2018 with reinvestment of maturing principal amounts occurring from January 2019. This is
expected to continue well past the time when the ECB begin to increase key interest rates (ECB 2019b).
      The economics literature suggests that central bank asset purchases affect the macroeconomy
through three main channels: the portfolio rebalancing channel, the signalling channel and the
lending channel (Benford et al. 2009, pp. 93–95; Dunne et al. 2015, p. 65; Gern et al. 2015, p. 207;
Brózda 2016, p. 755). In a European context, there is much empirical evidence on the existence of
the portfolio channel (Urbschat and Watzka 2017, p. 27; Albertazzi et al. 2018, p. 2); the signalling
channel (Altavilla et al. 2015, p. 2; Neugebauer 2018, p. 22; Zaghini 2019, p. 21) and the lending
channel (Tischer 2018, p. 35). In Ireland, Larkin et al. (2019, p. 22) found strong evidence that the
signalling effect was present in the Irish bond market.
      This paper contributes to the literature by expanding this focus to the operation of all three
transmission channels in Ireland. The main research question is to identify whether the ECB’s APP
in Ireland operated through the portfolio rebalancing channel, the signalling channel or the lending
channel. It is a first attempt to identify if the channels were operative and if there were any possible
barriers to their operation in Ireland. This paper presents a quantitative descriptive analysis of some
key data sets in the 2014–2018 period when the ECB was undertaking asset purchases. The aim is to
identify initial trends and possible correlations in key variables over this period through time-series
visualisation and trend analysis and point to areas for further investigation in the context of theoretical
models. This work is important to help inform policy makers on the likely effects of the recently
announced new ECB asset purchase programme starting in November 2019.
      The remainder of this paper is divided into five sections. Section 2 provides a literature review
which provides a theoretical perspective on how the portfolio rebalancing channel, the signalling
channel and the lending channel transmit central bank asset purchases to the macro economy. Section 3
documents the data description and analysis. Section 4 presents a summary of the main findings.
Section 5 discusses some of the main findings from the data analysis with reference to the literature.
Section 6 offers some concluding remarks.

2. Literature Review
     From a theoretical perspective, the ECB’s expanded asset purchase programme was aimed at
further enhancing the transmission of monetary policy, facilitating credit provision to the euro area
economy, easing borrowing conditions for households and businesses and ultimately contributing to
returning inflation rates to levels below, but close to, 2 percent over the medium-term, consistent with
the ECB’s primary objective of maintaining price stability (ECB 2015; ECB 2016).
     Dunne et al. (2015, p. 65) identify three primary channels in the economic literature through which
a central bank’s purchases of assets can affect the real economy: the portfolio rebalancing channel,
the bank lending channel and the signalling channel. Figure 1 presents these three transmission
channels and their macroeconomic outcomes (Dunne et al. 2015, p. 65). The main research question in
this paper is to identify whether the ECB’s APP in Ireland operated through the portfolio rebalancing
channel, the signalling channel or the lending channel. This section presents theoretical perspectives on
these three channels. Section 2.1 considers the portfolio rebalancing channel, Section 2.2 the signalling
channel and Section 2.3 the bank lending channel.

3   Purchases by the ECB are taken to mean purchases by the Eurosystem, including the ECB and the national central banks of
    euro-area countries.
Economies 2019, 7, x FOR PEER REVIEW                                                                                                3 of 26

    Economies 2019, 7, 98                                                                                                                3 of 25

           Figure 1. Transmission channels of asset purchases to the macro economy (Dunne et al. 2015, p. 66).

    2.1. Portfolio Rebalancing Channel
      Figure 1. Transmission channels of asset purchases to the macro economy (Dunne et al. 2015, p. 66).
         The portfolio rebalancing channel operates via incentivising institutions to rebalance their portfolio
2.1.from
     Portfolio
          safe Rebalancing        Channel
                assets, like government           bonds, to riskier assets with higher expected returns, like corporate
    bonds  or  loans,   in  their  search   for
      The portfolio rebalancing channel operateshigher   yield (Albertazzi       et al. 2018, p.institutions
                                                                      via incentivising            1 and Tischer  to 2018).    Theoretically,
                                                                                                                       rebalance       their
    the central   bank    buys    government       bonds   and   this increased      demand      increases
portfolio from safe assets, like government bonds, to riskier assets with higher expected returns, like        government        bond     prices
    and  decreases      their    yield.   This,  in  turn,  indirectly     pushes      down     yields    on
corporate bonds or loans, in their search for higher yield (Albertazzi et al. 2018, p. 1 and Tischer 2018).    corporate      debt    as  some
    investors   rebalance       their portfolios     away   from   government         debt
Theoretically, the central bank buys government bonds and this increased demand increases    with   suppressed        yields   and    towards
    corporate debt
government       bondinprices
                            whichand the decreases
                                          yield is higher
                                                        their(Joyce
                                                               yield.etThis,
                                                                         al. 2014,    p. 3;indirectly
                                                                                in turn,     Gern et al.pushes
                                                                                                            2015, p.down207). This,
                                                                                                                                yieldsinon  turn,
    pushes   up   corporate       bond   prices   and   decreases    their  yield.
corporate debt as some investors rebalance their portfolios away from government debt with
         Alternatively,
suppressed      yields andcentraltowards  banks     can directly
                                             corporate     debt in buy
                                                                     which  private
                                                                                the yieldsector   assets, (Joyce
                                                                                              is higher      whichetdirectly
                                                                                                                          al. 2014,increases
                                                                                                                                       p. 3;
Gern et al. 2015, p. 207). This, in turn, pushes up corporate bond prices and decreases theirprices
    corporate    asset   prices    and  reduces    their  yields  (Gern    et  al. 2015,   p.  208).  The    higher    asset    yield. have a
    wealth   effect on asset
      Alternatively,       central holders
                                      banksand canthis,   should,
                                                      directly   buyin private
                                                                        theory, boost
                                                                                    sectortheir    spending
                                                                                              assets,    which(Joyce
                                                                                                                   directlyet al.  2014, p. 7;
                                                                                                                                increases
    Dunne et
corporate       al. 2015,
            asset    pricesp.and 67).reduces
                                      Sovereign     bond
                                                their      yields
                                                       yields       are et
                                                                (Gern    used
                                                                            al. in  the p.
                                                                                 2015,    pricing   of a broad
                                                                                            208). The      higherrange
                                                                                                                    assetof    interest
                                                                                                                             prices    haverates
    relevant   to  the   real   economy      (Larkin    et al. 2019,   p.  5).  The    lower    yields
a wealth effect on asset holders and this, should, in theory, boost their spending (Joyce et al. 2014, p.across    the   economy        should
    make loans
7; Dunne    et al. cheaper,
                    2015, p. 67).allowing    households
                                      Sovereign             and firms
                                                    bond yields           to borrow
                                                                    are used      in themore     andof
                                                                                           pricing     repay
                                                                                                         a broadtheirrange
                                                                                                                       debt more       cheaply.
                                                                                                                               of interest
    This
rates     shouldtofeed
       relevant        the into
                              real higher
                                    economy   consumption
                                                 (Larkin et al. and2019,
                                                                      investment
                                                                            p. 5). The   andlower
                                                                                               eventually
                                                                                                      yields feed
                                                                                                                across through      to higher
                                                                                                                          the economy
should make loans cheaper, allowing households and firms to borrow more and repay theirp.debt
    prices, helping     to   achieve    the  ECB’s    overall   objective   of   price   stability   (De   Santis   et  al.  2018,       66).
         Empirical
more cheaply.        Thisevidence
                              shouldinfeedsupport
                                                into of  this transmission
                                                       higher    consumptionmechanism and investmenthas been  and found     in a number
                                                                                                                      eventually        feed of
    countries.     Krishnamurthy          and    Vissing-Jorgensen        (2013,     p.   101)  and
through to higher prices, helping to achieve the ECB’s overall objective of price stability (De SantisCarpenter       et al.  (2015,    p. et
                                                                                                                                            230),
    among     others,
al. 2018, p. 66).        showed       evidence      of this  channel     in  the    US    associated     with    the   Federal     Reserve’s
    QE  programme.
      Empirical     evidence Joyce inet  al. (2014,
                                      support          p. 1)
                                                  of this      argued thatmechanism
                                                           transmission          investors shifted
                                                                                                has been  their  portfolios
                                                                                                             found               away of
                                                                                                                       in a number         from
    government      bonds      towards    corporate     bonds   due   to  the  Bank     of England’s
countries. Krishnamurthy and Vissing-Jorgensen (2013, p. 101) and Carpenter et al. (2015, p. 230),        QE   Programme.         In  the   euro
among others, showed evidence of this channel in the US associated with the Federal Reserve’s QE all
    area, Urbschat      and     Watzka    (2017,   p.  27), Neugebauer         (2018,    p. 22)   and   Larkin     et al.  (2019,    p.  12)
    show evidence
programme.        Joyceofetdeclining
                                 al. (2014,yields
                                               p. 1)onargued
                                                        sovereign thatgovernment         bonds, with
                                                                         investors shifted          theirperipheral
                                                                                                            portfolioscountries’
                                                                                                                             away from    bond
government bonds towards corporate bonds due to the Bank of England’s QE Programme. In thethat
    yields  declining      by   more    than   core   countries’   bond     yields.     Albertazzi      et al.  (2018,    p.  2)  found
    portfolio rebalancing played a relevant role in the transmission of the ECB’s APP, with rebalancing
Economies 2019, 7, 98                                                                                4 of 25

skewed more towards loans in non-vulnerable countries compared to vulnerable countries such
as Ireland.
      The literature also suggests that the APP may have impacted both targeted government and
corporate bonds and non-targeted or non-eligible bonds (Albertazzi et al. 2018, p. 2). For example,
Altavilla et al. (2015, p. 40) found that the ECB asset purchase programme significantly lowered yields
in a broad set of market segments and there have been spill-overs to non-targeted assets, with this
spillover accentuated by the low degree of financial stress prevailing at the announcement of the
programme. In addition, Zaghini (2019, p. 21) found evidence of a significant impact of the CSPP on
yield spreads, both directly on purchased and targeted bonds and indirectly on other bonds.

2.2. The Signalling Channel
     Eggertsson and Woodford (2003, p. 67) have argued that the key to dealing with a situation in which
monetary policy is constrained by the zero-lower bound on short-term nominal interest rates is “the
skilful management of expectations regarding the future conduct of policy”. Gern et al. (2015, p. 207)
and Moessner and Rungcharoenkitkul (2019, p. 83) consider the signaling channel to be one of the
most prominent channels of central bank asset purchases and that, in practice, it takes the form of
forward guidance communication strategies employed by many central banks to influence expected
and actual short-term interest rates.
     The ECB officially started using forward guidance in July 2013 by announcing that it expected
“the key ECB interest rates to remain at present or lower levels for an extended period of
time” (ECB 2014b, p. 65). Forward guidance has been maintained as a monetary policy since then.
Gern et al. (2015, pp. 207–8) and Bhattarai et al. (2015, p. 32) suggest that QE actually strengthens
the credibility of the central bank to keep interest rates low for a prolonged period of time because an
earlier exit from this strategy would trigger losses for the central bank. The expectation of low-level
of long-run real interest rates should encourage spending and increase credit demand. This should
stimulate consumption, investment and net exports and ultimately increase inflation back up towards
the ECB’s 2 percent target over the medium-term (ECB 2014b, pp. 65–66).
     In addition, the signaling of the lower expected interest rates should weaken the currency and
increase demand for exports. The weaker currency should also feed into higher import prices and so
raise inflation and inflation expectations (Dunne et al. 2015, p. 69). This is sometimes referred to as the
exchange rate channel (Glick and Leduc 2013, p. 19 and Haldane et al. 2016, p. 10). A related point is
that when the ECB buys Euro-area bonds from non-euro area holders, the portfolio rebalancing effect
outlined above should also weaken the exchange rate and, therefore, impact on prices.
     Empirical evidence in support of the signalling transmission mechanism has been found in the
euro area. Altavilla et al. (2015, p. 2) demonstrate that the bulk of the impact of asset purchase
programmes is found to arise at announcement (“stock effects”), whereas “flow effects” generated
by the actual implementation of the purchases are limited. Urbschat and Watzka (2017, p. 27) found
that the effects in yield and spread reduction were most pronounced for the initial announcement
on the PSPP but declined afterwards for additional announcements. Neugebauer (2018, p. 22),
using an event study, found that the effects of ECB’s asset purchase announcements on euro-area
government bond yields arose with a one-day delay. In an Irish context, Larkin et al. (2019, p. 22),
who also uses an event study, showed that the announcement effect related to PSPP reduced Irish
sovereign bond yields significantly and contributed to a flattening of the yield curve. In terms of the
CSPP, Zaghini (2019, p. 21) found that the announcement of the CSPP programme in March 2016 had
an immediate effect on bond trades.
     Empirical evidence also exists for the exchange rate effect due to signaling effects. For example,
Demertzis and Wolff (2016, p. 8) suggested the expected interest rate differential arising from
announcements undermined EUR/USD, with much of the decline occurring with discussions about
when and how the ECB would start the PSPP. Indeed, Ferrari et al. (2017, p. 25) found that the
exchange rate was more sensitive to monetary policy when the effective lower-bound interest rate
Economies 2019, 7, 98                                                                                                 5 of 25

became increasingly binding. This is supported by Dedola et al. (2018, p. 1), who found that the ECB’s
APP programme led a depreciation in the euro relative to the USD of 12 percent between September
2014 and the end of 2016 and that the signaling channel contributed to the exchange rate response to
QE. This is especially important in the context of a small open economy like Ireland.

2.3. Bank Lending Channel
       The traditional bank lending channel can occur directly, with institutions selling bonds to the
ECB and using the proceeds to extend credit to the real economy (ECB 2015), or indirectly through
banks’ lending a proportion of their increased deposits, from investors who have sold bonds to the
ECB and lodged the proceeds in their bank accounts, to households and firms (Butt et al. 2014, p. 1).
In particular, banks keep a proportion of their increased deposits to meet their reserve, liquidity and
capital requirements but will use excess funds to finance loans at higher interest rates than they could
earn if they left it on deposit at negative interest rates at the ECB (Dunne et al. 2015, p. 68). Indeed,
the negative ECB deposit facility rate (−40 basis points since March 2016) encourages lending and
accentuates the effect of the APP on credit supply by increasing the cost of holding the reserves injected
via the APP, thus incentivising banks to rebalance towards bank loans4 (Altavilla et al. 2019, p. 35).
This channelling of funds from deposits to productive firms and households is essential to ensuring
investment and growth (Altavilla et al. 2019, p. 3), especially in times of stress (Bruno et al. 2017, p. 25),
and ultimately impacting on higher inflation levels and a return to price stability.
       Empirical evidence in support of the traditional bank lending channel is mixed. For example,
Butt et al. (2014, p. i) found no evidence to suggest that the Bank of England’s QE operated via a
traditional bank lending channel. Tischer (2018, p. 35), using data on German banks for 2014–2016,
showed that QE encouraged banks to rebalance from securities to loans but that this was primarily
motivated by portfolio rebalancing, as described above.
       It is worth noting that there is another view that argues that the level of deposits or reserves in
banks are not important in determining bank lending (Disyatat 2010, p. 2). This is reflected in the
theory of ‘endogenous money’, which suggests that bank lending is not constrained by banks’ level
of deposits and reserves but by what banks view as ‘credit-worthiness’ in borrowers, the interbank
market, quest for profitability, and liquidity controls by central banks (Lavoie 2014, p. 193). This theory
has gained traction in central banking circles. For example, McLeay et al. (2014, p. 1) from the Bank of
England and the Bundesbank (2017, p. 17), have suggested that banks can grant loans without any
prior inflows of deposits. This is relevant to the ECB’s APP as it suggests that central bank purchases
of secondary market assets are not necessary to spur bank lending. Fullwiler (2013, p. 186), referring
to QE specifically, argues that “since banks require neither reserve balances nor deposits to make loans
. . . adding to the stock of either does not in itself stimulate the economy”.
       The literature also suggests that well-capitalised banks are a prerequisite to an effective bank
lending channel arising from unconventional monetary policy. For example, Boeckx et al. (2016, p. 3)
found that better capitalised banks have, on average, responded more to ECB’s credit support policies
used in the pre-APP years. Albertazzi et al. (2016, p. 16) found that capital and economic constraints
were the key dimension that determined the extent to which banks transmit non-conventional monetary
impulses via shifts in lending supply. Bruno et al. (2017, p. 26), also focusing on the pre-APP years,
showed that the main bank characteristics affecting lending are size, capitalisation, liquidity, and
ownership and, to a lower extent, reliance on deposits. In addition, Altavilla et al. (2019, p. 38) reported
that the APP led to increased loan volumes in the Euro area and the impact was stronger for banks
with larger holdings of sovereign bonds.

4   Andrade et al. (2016, pp. 19–22); Tischer (2018) also suggest that quantitative easing can increase banks’ equity through
    higher asset prices and that this also is conducive to a more productive lending environment.
Economies 2019, 7, 98                                                                                                       6 of 25
Economies 2019, 7, x FOR PEER REVIEW                                                                                       6 of 26

3. Data
3. Data Description
        Description and
                    and Analysis
                        Analysis
     The main
     The     mainresearch
                      researchquestion
                                  question forfor
                                               thisthis
                                                     studystudy
                                                            is to is to identify
                                                                  identify  whether whether
                                                                                       the ECB’stheAPP
                                                                                                     ECB’s     APP inoperated
                                                                                                          in Ireland       Ireland
operated     through      the  portfolio   rebalancing     channel,    the signalling     channel
through the portfolio rebalancing channel, the signalling channel or the lending channel. This paperor the   lending      channel.
This apaper
uses            uses a descriptive
        quantitative       quantitative    descriptive
                                         analysis of some  analysis
                                                             key dataof sets
                                                                         some    key2014–2018
                                                                             in the    data sets period
                                                                                                   in the when
                                                                                                           2014–2018the ECB period
                                                                                                                               was
when     the   ECB      was    undertaking      asset   purchases.     The   aim    is  to  identify
undertaking asset purchases. The aim is to identify trends and possible correlations in key variables  trends     and     possible
correlations
over  this periodin key   variables
                        through        over this visualisation
                                   time-series   period through       time-series
                                                                    and              visualisation
                                                                         trend analysis     and pointandtotrend
                                                                                                             areasanalysis     and
                                                                                                                      for further
point to areasin
investigation      forthefurther  investigation
                            context   of theoreticalin models.
                                                       the context of theoretical models.
     Given      the   relative   confidentiality     of
     Given the relative confidentiality of NCB-related  NCB-related purchases
                                                                         purchases (ECB(ECB 2014c),
                                                                                               2014c), finding
                                                                                                        finding data data onon the
                                                                                                                                the
impact    of  the  APP     via these   three  channels    in Ireland    was  difficult.  In particular,
impact of the APP via these three channels in Ireland was difficult. In particular, it was necessary to  it  was    necessary    to
find data
find data on on purchase
                  purchase quantities,
                                quantities, programme
                                              programme participants
                                                              participants andand the
                                                                                   the market
                                                                                         market response.
                                                                                                   response. This
                                                                                                                This data
                                                                                                                        data was,
                                                                                                                              was,
therefore,    compiled       from   combining    data   from    various   sources.    Data
therefore, compiled from combining data from various sources. Data was sourced for the two   was   sourced    for  the   two core
                                                                                                                              core
components of
components        ofthe
                     theAPP,
                           APP,thethe   PSPP
                                     PSPP   andand   CSPP.
                                                 CSPP.    TheThe   rationale
                                                               rationale       for this
                                                                          for this was wasthat that
                                                                                               thesethese   two programmes
                                                                                                      two programmes          were
were   the   main     constituents     of the  APP.    Figure   2  shows   the   APP
the main constituents of the APP. Figure 2 shows the APP Net purchases by Programme     Net  purchases     by   Programme
                                                                                                                      in October in
October    2018.   It  can  be  seen  that  the bulk   of the  APP   centered    on  the  PSPP   (81.8 percent
2018. It can be seen that the bulk of the APP centered on the PSPP (81.8 percent as at October 2018) and          as   at October
2018)
the    and(10.24
    CSPP      the CSPP      (10.24
                      percent    as percent   as at
                                     at October      October 2018).
                                                  2018).

             Figure 2. Asset purchase programme (APP) Net Purchases by Programme, October 2018.
             Figure 2. Asset purchase programme (APP) Net Purchases by Programme, October 2018.
      Data for the PSPP purchases were sourced from Amundi Research’s monthly compilation of
      Data for the PSPP purchases were sourced from Amundi Research’s monthly compilation of
statistics on each Eurozone nation’s purchases under the PSPP. CSPP purchases and figures were
sourced from UniCredit, whom disclosed the ECB’s CSPP portfolio in research reports. Historical
corporate bond data was garnered from ISIN codes published by the Central Bank of Finland (which
conducted the CSPP purchases for Ireland).
      The data sources used for the purposes of bank lending analysis were collated from the Central
      The data sources used for the purposes of bank lending analysis were collated from the Central
Bank of Ireland’s Credit and Banking Statistics and Quarterly National Accounts data. Concerning
securities holdings statistics, this report uses the aggregate balance sheets for Irish Headquartered Credit
securities holdings statistics, this report uses the aggregate balance sheets for Irish Headquartered
Institutions, as opposed to the broader Domestic Market Credit Institutions data. The rationale for this is
Credit Institutions, as opposed to the broader Domestic Market Credit Institutions data. The rationale for
that this data encompasses national banks that have accounts with the Irish central bank and domestic
this is that this data encompasses national banks that have accounts with the Irish central bank and
clients, as opposed to investment banks and so-called O-SIIs (Other Systemically Important Institutions)
domestic clients, as opposed to investment banks and so-called O-SIIs (Other Systemically Important
that operate outside of the regulatory parameters of depository financial institutions, and do not have
Institutions) that operate outside of the regulatory parameters of depository financial institutions, and
accounts with the Irish central bank and, therefore, did not participate in the APP directly. Additional
do not have accounts with the Irish central bank and, therefore, did not participate in the APP
reference material has been taken from Bruegel’s Sectorial Sovereign Bond Holdings database, as well
directly. Additional reference material has been taken from Bruegel’s Sectorial Sovereign Bond
as the European Central Bank’s Statistical Data Warehouse on Securities Holding Statistics.
Holdings database, as well as the European Central Bank’s Statistical Data Warehouse on Securities
Holding Statistics.
Economies 2019, 7, 98                                                                                    7 of 25

      There are a number of caveats to this approach. First, there are limitations to the availability
of the data. For example, aggregate bank balance sheets detail only security holdings by sector and
not by maturity. Second, lending statistics from non-financial corporations (NFC) are not readily
available, which would have been an insightful counterpart to the SME lending data gathered.
However, SMEs form an intrinsic part of the Irish economy. There are currently 248,344 SMEs in
Ireland (Houses of the Oireachtas 2019, p. 29), which comprises 99.7% of all Irish NFCs (ibid., p. 11).
Additionally, as SMEs are generally restricted to domestic bank-based funding, they provide a more
accurate picture of the effectiveness of the APP’s bank-lending channel within Ireland.
      Third, this approach does not derive an operational model from the theory and run regressions to
test a hypothesis as per much literature cited here. However, it does shed light on the transmission
channels for QE to the Irish economy and points to possible areas for further investigation. The links
drawn are not definitive and more work will need to be done to disentangle the impact of the APP
from other factors and consider these findings in the context of theoretical models.

4. Findings
     This section describes the initial findings that the two main programmes in the APP, the PSPP and
the CSPP, had on the Irish economy. It is divided into three sections. Section 4.1 presents findings
arising from the PSPP on Irish government bonds and Irish debt. Section 4.2 shows the findings arising
from the CSPP on corporate bonds. Section 4.3 considers the portfolio rebalancing of households and
banks and the lending behavior of Irish banks from the APPs announcement in January 2015.

4.1. The PSPP and the Irish Economy
     Between March 2015 and December 2018, the ECB conducted net purchases of public-sector
securities under the PSPP. This section considers public-sector purchases in Ireland and is divided into
three sections. Section 4.1.1 details the Irish Central Bank’s purchase of bonds over the period March
2015 to December 2018. Section 4.1.2 shows the impact on Irish government bond yields. Section 4.1.3
reflects on the impact of the PSPP on Irish long-term debt.

4.1.1. Description of the Irish PSPP
     As of 31 December 2018, cumulative net purchases of Irish government bonds by the ECB
amounted to €30.1 billion (Larkin et al. 2019, p. 7). Table 1 shows a breakdown of the Central Bank of
Ireland’s purchase of sovereign debt from March 2015 to November 2018.

                 Table 1. Irish public-sector asset purchase programme (PSPP) Monthly Purchases.

                        Total Holdings   Monthly Purchase            Total Holdings   Monthly Purchase
                          (€Billions)       (€Billions)                (€Billions)       (€Billions)
        Mar-15               0.80              0.80         Feb-17       19.70               0.60
        Apr-15               1.50              0.70         Mar-17       20.20               0.50
        May-15               2.20              0.70         Apr-17       20.80               0.60
        Jun-15               3.00              0.80         May-17       21.30               0.50
        Jul-15               3.80              0.80         Jun-17       21.80               0.50
        Aug-15               4.40              0.60         Jul-17       22.40               0.60
        Sep-15               5.20              0.80         Aug-17       22.90               0.50
        Oct-15               6.10              0.90         Sep-17       23.40               0.50
        Nov-15               6.90              0.80         Oct-17       23.50               0.10
        Dec-15               7.60              0.70         Nov-17       24.60               1.10
        Jan-16              8.40               0.80         Dec-17       25.30               0.70
        Feb-16               9.20              0.80         Jan-18       25.70               0.40
        Mar-16              10.00              0.80         Feb-18       26.10               0.40
Economies 2019, 7, 98                                                                                                                   8 of 25

    Economies 2019, 7, x FOR PEER REVIEW                                                                                      8 of 26
                                                                Table 1. Cont.
         Feb-16               9.20                 0.80          Jan-18         25.70                              0.40
                             Total Holdings       Monthly Purchase           Total Holdings                     Monthly Purchase
        Mar-16               10.00                 0.80          Feb-18         26.10                              0.40
                               (€Billions)          (€Billions)                (€Billions)                        (€Billions)
        Apr-16               11.10                 1.10         Mar-18          26.50                              0.40
           Apr-16                  11.10                1.10          Mar-18      26.50                               0.40
        May-16
          May-16             12.2012.20            1.10 1.10    Apr-18Apr-18    27.10
                                                                                  27.10                            0.60
                                                                                                                      0.60
           Jun-16
        Jun-16               13.2013.20            1.00 1.00    May-18May-18 27.6027.60                               0.50
                                                                                                                   0.50
           Jul-16                  14.20                1.00          Jun-18      28.20                               0.60
        Jul-16               14.20                 1.00          Jun-18         28.20                              0.60
          Aug-16                   14.90                0.70          Jul-18      28.75                               0.55
        Aug-16
           Sep-16            14.9015.90            0.70 1.00     Jul-18
                                                                      Aug-18 28.7529.30                            0.55
                                                                                                                      0.55
           Oct-16
        Sep-16               15.9016.90            1.00 1.00    Aug-18Sep-18      29.60
                                                                                29.30                                 0.30
                                                                                                                   0.55
          Nov-16                   17.90                1.00          Oct-18      29.80                               0.20
        Oct-16               16.90                 1.00          Sep-18         29.60                              0.30
           Dec-16                  18.60                0.70          Nov-18      29.90                               0.10
        Nov-16
           Jan-17            17.9019.10            1.00 0.50     Oct-18         29.80                              0.20
         Dec-16              18.60                   0.70          Nov-18
                                                       Source: Amundi (2015–2019). 29.90                            0.10
         Jan-17              19.10                   0.50
                                                     Source: Amundi (2015–2019).
     The table shows that the PSPP began with an initial purchase of €800 million of Irish bonds in
MarchThe2015.table shows that the PSPP began with an initial purchase of €800 million of Irish bonds in
                Irish bond purchases declined from November 2016, which could be referred to as an
  March 2015. Irish bond purchases declined from November 2016, which could be referred    5 . Theytoincreased
                                                                                                      as an
early ‘Irish tapering’, 13 months prior to the official ECB tapering of January 2018                           in
  early ‘Irish tapering’, 13 months prior to the official ECB tapering of January 20185. They increased in
the month of November 2017 to €1.1 billion and then tapered, in line with the ECB official tapering.
  the month of November 2017 to €1.1 billion and then tapered, in line with the ECB official tapering.
This pattern
  This  patterncan
                 canalso
                     alsobe
                          be seen in Figure
                             seen in Figure3.3.

               Billion (€)
                  1.2
                                                                      November 2016
                  1.0                                                 Irish Purchases
                                                                      Reduced
                  0.8                                                                                January 2018
                                                                                                     Official Tapering Begins
                  0.6

                  0.4

                  0.2

                  0.0

                         Figure3.
                        Figure 3. Irish PSPP
                                        PSPPPurchases
                                             PurchasesPer
                                                       PerMonth.
                                                           Month.Data sourced:
                                                                   Data        Amundi
                                                                         sourced:     (2015–2018).
                                                                                  Amundi   (2015–2018).

        TheECB’s
      The   ECB’scapital
                   capital key was
                                 was used
                                      usedtotoguide
                                                guidenet
                                                       netpurchases
                                                            purchases given thatthat
                                                                         given   the ECB   was buying
                                                                                     the ECB            bondsbonds
                                                                                                was buying
  acrossmany
across    manydifferent
                different sovereign
                          sovereign bond
                                      bondmarkets
                                              marketsonona monthly
                                                           a monthly basis (ECB
                                                                        basis    2019a).
                                                                              (ECB       Figure
                                                                                     2019a).    4 shows
                                                                                              Figure      Irish Irish
                                                                                                      4 shows
  PSPP   purchases  as a percentage   of all PSPPs versus  the Irish allocated capital key of 1.65%.
PSPP purchases as a percentage of all PSPPs versus the Irish allocated capital key of 1.65%. It      It can  becan be
  seen that a precise achievement of the capital key was not achieved each month, with some flexibility
seen that a precise achievement of the capital key was not achieved each month, with some flexibility
  built in to support the smooth implementation of the programme (ECB 2019a). However, as of 31
built in to support the smooth implementation of the programme (ECB 2019a). However, as of 31
  December 2018, cumulative net purchases of Irish government bonds by the ECB amounted to €30.1
December 2018, cumulative net purchases of Irish government bonds by the ECB amounted to €30.1
  billion, which represents a 1.55 percent share of total PSPP purchases (excluding supranational
billion,
  bonds)which   represents
          (Larkin et al. 2019,a p.7).
                                1.55 percent share of total PSPP purchases (excluding supranational bonds)
(Larkin et al. 2019, p. 7).

5       Official ECB tapering refers to the first major reduction of purchases from €60 billion until December 2017, to €30 billion in January
    5     Official
        2018.      ECB
              See the    tapering of
                      chronology   refers
                                      assettopurchases
                                                the first here:
                                                          majorhttps://www.ecb.europa.eu/mopo/implement/omt/html/index.en.html.
                                                                reduction of purchases from €60 billion until December 2017,
          to    €30     billion      in   January     2018.     See     the    chronology       of      asset    purchases     here:
          https://www.ecb.europa.eu/mopo/implement/omt/html/index.en.html.
Economies 2019, 7, 98                                                                                                                                                                                                                                                             9 of 25
Economies 2019, 7, x FOR PEER REVIEW                                                                                                                                                                                                                                             9 of 26

         3.10% 2019, 7, x FOR PEER REVIEW                                                                                                                                                                                             January 2018
       Economies                                                                                                                                                                                                                                 9 of                       26
                                                                                                                                                                                                                                      Tapering
         2.60%
                                                                                                                                           September 2016                                                                 January 2018
               3.10%
                                                                                                                                           True Taper Begins?                                                             Tapering
         2.10%
               2.60%
                                                                                                                                         September 2016
         1.60%                                                                                                                           True Taper Begins?
               2.10%

         1.10%1.60%

         0.60%1.10%

               0.60%
         0.10%
                  3月-15
                              5月-15
                                          7月-15
                                                      9月-15
                                                                 11月-15
                                                                           1月-16
                                                                                       3月-16
                                                                                                     5月-16
                                                                                                                 7月-16
                                                                                                                             9月-16
                                                                                                                                        11月-16
                                                                                                                                                   1月-17
                                                                                                                                                              3月-17
                                                                                                                                                                           5月-17
                                                                                                                                                                                          7月-17
                                                                                                                                                                                                       9月-17
                                                                                                                                                                                                                 11月-17
                                                                                                                                                                                                                              1月-18
                                                                                                                                                                                                                                        3月-18
                                                                                                                                                                                                                                                   5月-18
                                                                                                                                                                                                                                                            7月-18
                                                                                                                                                                                                                                                                    9月-18
               0.10%
                          3月-15
                                      5月-15
                                                  7月-15
                                                              9月-15
                                                                      11月-15
                                                                               1月-16
                                                                                         3月-16
                                                                                                 5月-16
                                                                                                             7月-16
                                                                                                                         9月-16
                                                                                                                                     11月-16
                                                                                                                                                 1月-17
                                                                                                                                                           3月-17
                                                                                                                                                                   5月-17
                                                                                                                                                                              7月-17
                                                                                                                                                                                      9月-17
                                                                                                                                                                                                  11月-17
                                                                                                                                                                                                               1月-18
                                                                                                                                                                                                                          3月-18
                                                                                                                                                                                                                                      5月-18
                                                                                                                                                                                                                                                7月-18
                                                                                                                                                                                                                                                        9月-18
                                                          Ireland Capital Key 1.607%                                                                               Ireland monthly % of PSPP
                                                                  Ireland Capital Key 1.607%                                                                 Ireland monthly % of PSPP
      Figure 4. Irish PSPP Purchases (as % of all PSPP) vs. Allocated Capital Key. Source: Amundi
      Figure 4. Irish PSPP Purchases (as % of all PSPP) vs. Allocated Capital Key. Source: Amundi (2015–
      (2015–2018).
      2018).Figure 4. Irish PSPP Purchases (as % of all PSPP) vs. Allocated Capital Key. Source: Amundi (2015–
             2018).
4.1.2. Impact on Irish Government Bond Yields
       4.1.2. bond
      Irish   Impactyields
                       on Irishhave
                                  Government      Bond Yields since 2011. Figure 5 shows the decline in the yield
                                       fallen substantially
      Irish  bond
on 10-yearIrishbonds  yields
                   bondfrom    have   fallen
                          yieldsJanuary        substantially
                                            2011
                                   have fallen                  since
                                                   to Octobersince
                                                 substantially    2018.2011.
                                                                      2011.     Figure
                                                                           AsFigure
                                                                               evidenced  5 shows
                                                                                      5 shows here,  the
                                                                                                      muchdecline
                                                                                                the decline      thein
                                                                                                              ofthe
                                                                                                             in         theon
                                                                                                                       drop
                                                                                                                      yield  yield   on
                                                                                                                               in Irish
10-year   bonds
bond 10-year
        yield  was  from
                 bonds     January
                         from
                      primarilyJanuary 2011
                                    caused2011to
                                              bytoOctober
                                                   October 2018.
                                                   monetary  2018.  Asevidenced
                                                                   As
                                                                policy  evidenced   of here,
                                                                         outside here,        much
                                                                                        themuch
                                                                                             PSPP,     ofdrop
                                                                                                          the drop
                                                                                                  of including
                                                                                                     the           theinlonger-term
                                                                                                               in Irish   Irish bond
                                                                                                                         bond
yield   was
       yield   primarily
               was           caused
                     primarily    caused bybymonetary
                                                monetary   policy
                                                            policy   outside
                                                                    outside   of of
                                                                                  thethe   PSPP,
                                                                                       PSPP,
refinancing operations (LTRO) announced in December 2011 and Outright Monetary Transactions         including
                                                                                               including   the    the   longer-term
                                                                                                                longer-term
refinancing
(OMT) announced operations
       refinancing    operations(LTRO)
                                    (LTRO)announced
                         in September                          December
                                              announced in December
                                           2012. In addition,                 2011
                                                                            2011
                                                                  some of the
                                                                                  and and   Outright
                                                                                        Outright
                                                                                 decrease               Monetary
                                                                                                   Monetary
                                                                                             can be attributed      to Transactions
                                                                                                               Transactions
                                                                                                                       continuously
(OMT)  (OMT)     announced
          announced         in  in  September
                                September         2012.
                                                 2012.   In
                                                        In   addition,
                                                             addition,   some
                                                                           some  of  the
                                                                                    of     decrease
                                                                                         the  decreasecan  be
                                                                                                           can attributed
                                                                                                                 be          to
                                                                                                                       attributed     to
low interest rates employed by the ECB from 2012. Figure 5 also shows that the initial                                   downward
       continuously
continuously      low   low  interest
                         interest      rates
                                    rates     employed
                                            employed      by
                                                          by  the
                                                              the ECB
                                                                   ECB  from
                                                                          from 2012.
                                                                                 2012.Figure  5
                                                                                          Figurealso
                                                                                                   5  shows
                                                                                                     also     that
                                                                                                           shows    the initial
                                                                                                                     that  the   initial
price downward
       action on government
                     price action onyields     was far
                                        government      more
                                                      yields    driven
                                                              was         by driven
                                                                   far more   the announcements          or forward
                                                                                       by the announcements              guidance of
                                                                                                                  or forward
downward
the various     price  action
                policies         on
                            than by  government      yields
                                       the implementation      was  far  more    driven
                                                                   of the policies         by the
                                                                                       themselves. announcements
                                                                                                         For example,     orthe
                                                                                                                             forward
                                                                                                                                  PSPP
       guidance    of the various    policies than by the implementation        of the policies  themselves.   For example,
guidance
was announcedof the
       the PSPP wasin
                      various    policies
                           January in
                         announced     2015 than   by the
                                               and 2015
                                          January
                                                            implementation
                                                    implemented        from March
                                                         and implemented
                                                                                  of  the
                                                                               from March
                                                                                           policies
                                                                                          2015,       themselves.
                                                                                                  after
                                                                                              2015,      which
                                                                                                     after whichvery
                                                                                                                       For  example,
                                                                                                                          little price
                                                                                                                    very little
the PSPP
action pricewas    announced
              action
         occurred.    occurred. in January 2015 and implemented from March 2015, after which very little
price action occurred.

      Figure 5. Irish 10-Year Bond Yield, January 2011–October 2018 Sources: St Louis. Fed, European
      Central Bank; Tabulated in Excel.
Economies 2019, 7, x FOR PEER REVIEW                                                                                10 of 26

Economies 2019, 7, 98                                                                                                     10 of 25
          Figure 5. Irish 10-Year Bond Yield, January 2011–October 2018 Sources: St Louis. Fed, European
          Central Bank; Tabulated in Excel.
      Figure 6 compares the yields on 2-, 5- and 10-year Irish treasury bonds. It can be seen that overall,
       Figure 6 compares the yields on 2-, 5- and 10-year Irish treasury bonds. It can be seen that overall,
yields did narrow but that this was prior to the PSPP’s launch in March 2015. For example, the spread
  yields did narrow but that this was prior to the PSPP’s launch in March 2015. For example, the spread
between 10- and 2-year bonds decreased from 242 basis points in May 2014 to just 78 basis points (a
  between 10- and 2-year bonds decreased from 242 basis points in May 2014 to just 78 basis points (a
decline of 164 basis points) in May 2015. However, the following year when PSPP purchases were
  decline of 164 basis points) in May 2015. However, the following year when PSPP purchases were
active, the spread actually increased on average. Similarly, the yield on 10-year (benchmark) bonds
  active, the spread actually increased on average. Similarly, the yield on 10-year (benchmark) bonds
decreased   from 3.02% in January 2014 to 0.757% year-on-year to March 2015, but only fell to 0.733% the
  decreased from 3.02% in January 2014 to 0.757% year-on-year to March 2015, but only fell to 0.733%
following   year. Two-year
  the following year.         yieldsyields
                        Two-year      first entered  negative
                                            first entered      territory
                                                          negative        at theatbeginning
                                                                     territory                of the
                                                                                   the beginning   ofPSPP, logging
                                                                                                      the PSPP,
−0.21%
  loggingin−0.21%
            March in
                   2015,  a trend
                       March      which
                               2015,       haswhich
                                     a trend    held steady through
                                                      has held  steadytapering.
                                                                        through Since   March
                                                                                   tapering.    2015,
                                                                                             Since    term2015,
                                                                                                   March   spreads
have  remained    at a relatively steady   rate.
  term spreads have remained at a relatively steady rate.

    3.6
    3.1
                                       March 2015                                                         January 2018
    2.6                                                                      September 2016
                                       PSPP Begins                                                        Overall Tapering
    2.1                                                                      Irish Taper                  Begins
    1.6
    1.1
    0.6
    0.1
   -0.4
   -0.9
           1月-14
           3月-14
           5月-14
           7月-14
                         9月-14
                        11月-14
                         1月-15
                         3月-15
                         5月-15
                                            7月-15
                                            9月-15
                                           11月-15
                                                         1月-16
                                                         3月-16
                                                         5月-16
                                                                 7月-16
                                                                 9月-16
                                                                            11月-16
                                                                             1月-17
                                                                                     3月-17
                                                                                     5月-17
                                                                                             7月-17
                                                                                             9月-17
                                                                                                     11月-17
                                                                                                      1月-18
                                                                                                              3月-18
                                                                                                              5月-18
                                                                                                              7月-18
                                                                                                                       9月-18
                                                                                                                      11月-18
                                                                                                                       1月-19
                                           10 yr Price         2 yr Price             5 yr Price

       Figure6.6. Term
      Figure      Term Spreads—2-, 5- and
                       Spreads—2-, 5- and 10-Year
                                           10-YearGovernment
                                                   GovernmentBond
                                                              Bond  Yields,
                                                                  Yields,   January
                                                                          January    2014–January
                                                                                  2014–January    2019.
                                                                                               2019.
       Source:Investing.com.
      Source:  Investing.com.

4.1.3.
  4.1.3.Impact
         Impactof
                ofPSPP
                  PSPP on
                       on Irish Long-Term Debt
                          Irish Long-Term Debt
     The
       Thefindings
             findingssuggest
                       suggest that the the NTMA
                                            NTMA(National
                                                      (NationalTreasury
                                                                   TreasuryManagement
                                                                                Management       Agency),
                                                                                              Agency),     thethe   Irish
                                                                                                                Irish      state
                                                                                                                       state
agency
  agencythat
           thatmanages
                 manages the the national    debt,used
                                  national debt,    usedthetheAPP
                                                                APPtotoextend
                                                                           extend thethe  maturity
                                                                                       maturity      profile
                                                                                                 profile        of Irish
                                                                                                            of Irish  debt.debt.
Figure
  Figure 7 shows an inverse relationship between the proportion of PSPP purchases in Ireland for a a
         7 shows    an  inverse    relationship   between     the   proportion     of  PSPP  purchases       in Ireland    for
  givenquarter
given    quarter (as per
                      pernational
                            nationalaccounts)
                                        accounts)andand
                                                      the the
                                                          decrease    in Irish
                                                               decrease     in long-term   securities-based
                                                                               Irish long-term                   debt overdebt
                                                                                                    securities-based
  thatthat
over   samesame
              period. UsingUsing
                    period.     ‘Q1 2015’
                                       ‘Q1as2015’
                                              the anchor-point     (0%), Figure
                                                   as the anchor-point        (0%),7 shows
                                                                                      Figurethat  trajectory
                                                                                              7 shows     thatoftrajectory
                                                                                                                   the two of
the two variables are similar. Table 2 shows some descriptive statistics, which correspond to7.Figure
  variables   are similar.  Table   2 shows    some  descriptive    statistics, which    correspond    to  Figure       The 7.
  correlation   coefficient    shows    that  there  is a   relatively   strong    correlation
The correlation coefficient shows that there is a relatively strong correlation of 0.64 between of   0.64   between      the the
  governmentlevel
government       levelof
                       of long-term
                           long-term debt
                                        debt and
                                              andPSPP
                                                   PSPPpurchases
                                                          purchasesover  overthe
                                                                               theperiod
                                                                                    period Q1Q1
                                                                                              2015
                                                                                                 2015andandQ3Q3 2018.  ThisThis
                                                                                                                    2018.
  suggests  that  there  is a motivation   for  exploring   this relationship    further  with regression
suggests that there is a motivation for exploring this relationship further with regression analysis.         analysis.
Economies 2019, 7, 98                                                                                                             11 of 25
   Economies 2019, 7, x FOR PEER REVIEW                                                                               11 of 26

                                                                      September 2016:           January 2018:
                         154                                                                                    3.5
                                                                      PSPP Purchases Reduce     Tapering
                         152
                                                                                                                3
                         150
                         148                                                                                    2.5

                                                                                                                       € (Billions)
          € (Billions)

                         146                                                                                    2
                         144
                         142                                                                                    1.5
                         140                                             Long-Term Securities                   1
                         138                                             Debt Returns                           0.5
                         136
                         134                                                                                    0
                               2015 2015 2015 2015 2016 2016 2016 2016 2017 2017 2017 2017 2018 2018 2018
                                Q1 Q2 Q3 Q4 Q1 Q2 Q3 Q4 Q1 Q2 Q3 Q4 Q1 Q2 Q3
                                   PSPP Quarterly Purchases (RHS)             Long-Term Securities Debt (LHS)

          Figure 7. Irish Long-Term Security Debt to PSPP Purchases. Source: Central Bank of Ireland.
            Figure 7. Irish Long-Term Security Debt to PSPP Purchases. Source: Central Bank of Ireland.
                            Table 2. Irish Long-Term Security Debt to PSPP Purchases.
        Subsequently, government debt outstanding in long-term bonds have returned to pre-PSPP
                                   Government
   levels (0% level on fig above), first         Long-Term
                                         by the initial        Securities
                                                        ‘Irish-only’ tapering PSPP  Quarterly
                                                                              that began      Purchases 2016
                                                                                         in November
   and then the Mean
                official ECB tapering from January  1462018.                            1.973
              Variance                              11.162                              0.416
               Median                              148.506
                            Table 2. Irish Long-Term   Security Debt to PSPP Purchases.  1.9
         Standard deviation                          3.341                              0.645
        Correlation coefficient   Government Long-Term
                                                  −0.6432       Securities PSPP Quarterly Purchases
                               Mean                             146                                  1.973
               Variance
     Subsequently,  government debt outstanding    11.162                            0.416to pre-PSPP levels
                                                       in long-term bonds have returned
(0% level on figMedian
                 above), first by the initial ‘Irish-only’
                                                  148.506   tapering that began in November
                                                                                      1.9     2016 and then
the official ECB tapering
          Standard         from January 2018. 3.341
                   deviation                                                         0.645

4.2. TheCorrelation coefficientBonds
         CSPP and Corporate                                   −0.6432

   4.2.Between
        The CSPPJune
                  and 2016  and Bonds
                      Corporate   December 2018, the ECB conducted net purchases of corporate-sector
bonds under the corporate-sector purchase programme (CSPP) (ECB 2019a). This section considers
         Between June 2016 and December 2018, the ECB conducted net purchases of corporate-sector
the impact of the CSPP on corporate bonds in the Irish economy. Section 4.2.1 describes the CSPP in
   bonds under the corporate-sector purchase programme (CSPP) (ECB 2019a). This section considers
Ireland. Section 4.2.2 considers a case study of one company, Ryanair, as a targeted bond of the ECB.
   the impact of the CSPP on corporate bonds in the Irish economy. Section 4.2.1 describes the CSPP in
Section 4.2.3 looks at spill overs from the CSPP to non-targeted bonds.
   Ireland. Section 4.2.2 considers a case study of one company, Ryanair, as a targeted bond of the ECB.
   Section 4.2.3 looks at spill overs from the CSPP to non-targeted bonds.
4.2.1. The CSPP in Ireland
  4.2.1. The CSPP
     In Ireland,     in Ireland from 8 June 2016, the Corporate-Sector Purchase Programme involved
                  commencing
the ECBInbuying   Irish  non-sovereign
           Ireland, commencing     from bonds
                                         8 June via
                                                2016,thethe
                                                          Finnish Central Bank
                                                            Corporate-Sector     (2016). Programme
                                                                              Purchase   Table 3 shows   the Irish
                                                                                                      involved
corporate   bonds   that  were  bought,  all of which    are or have been  listed on  the Irish Stock
  the ECB buying Irish non-sovereign bonds via the Finnish Central Bank (2016). Table 3 shows the      Exchange.
These
  Irishwere   identified
         corporate   bondsby   tracing
                             that were the   ISINall
                                        bought,    (International
                                                      of which areSecurities    Identification
                                                                     or have been               Number)
                                                                                    listed on the          codes
                                                                                                   Irish Stock
published   as eligible  holdings  for securities lending    (Bank of Finland  2018).
  Exchange. These were identified by tracing the ISIN (International Securities Identification Number)
   codes published as eligible holdings for securities lending (Bank of Finland 2018).
Economies 2019, 7, 98                                                                                                                     12 of 25

         Table 3. Irish corporate-sector purchase programme (CSPP) Bonds (listed by CSPP purchase date).

Economies 2019, 7, x FOR PEER REVIEW                                                            Date of        CSPP Purchase               12 of 26
                                                                                                                                Initial Issue
      ISIN                  Issuer                                     Coupon       Maturity
                                                                                                 Issue             Date        Volume (€mn)
         Table 3. Irish
      XS1419674525      corporate-sector
                     Dublin               purchase
                            Airport Authority       programme
                                                1.554     7/06/28(CSPP)07/06/16
                                                                        Bonds (listed by CSPP purchase 290
                                                                                      15/07/16         date).
      XS1239586594                               ESB                   2.125        08/06/27     05/06/15      15/07/16             850
                                                                                               Date of                            Initial Issue
        ISIN
      XS1288849471                             Issuer
                                             Kerry Group              Coupon
                                                                       2.375        Maturity
                                                                                    10/09/25     10/09/15 CSPP Purchase
                                                                                                               15/07/16 Date        850 (€mn)
                                                                                                Issue                            Volume
    XS1419674525
      XS1077584024 Dublin Airport Authority
                            Ryanair                                     1.554
                                                                        1.875      7/06/28
                                                                                   17/06/21    07/06/16
                                                                                                 17/06/14      15/07/16
                                                                                                               15/07/16             500290
    XS1239586594
      XS1199964575           ESB
                            Ryanair                                     2.125
                                                                        1.125      08/06/27
                                                                                   03/10/23    05/06/15
                                                                                                 10/03/15      15/07/16
                                                                                                               15/07/16             750850
    XS1288849471         Kerry Group                                    2.375      10/09/25    10/09/15        15/07/16                850
      XS0375220588 Dublin Airport Authority                             6.872      09/07/18      09/07/08      29/07/16             400
    XS1077584024           Ryanair                                      1.875      17/06/21    17/06/14        15/07/16                500
      XS1428782160            ESB                                       1.875      14/06/31      14/06/16      29/07/16             600
    XS1199964575           Ryanair                                      1.125      03/10/23    10/03/15        15/07/16                750
      XS1505896735           CRH
    XS0375220588 Dublin Airport Authority                               1.375
                                                                        6.872      18/10/28
                                                                                   09/07/18      18/10/16
                                                                                               09/07/08        21/10/16
                                                                                                               29/07/16             600400
    XS1428782160
      XS1529684695           ESB Ireland
                     Gas Networks                                       1.875
                                                                        1.375      14/06/31
                                                                                   05/12/26    14/06/16
                                                                                                 05/12/16      29/07/16
                                                                                                               20/01/17             500600
    XS1505896735
      XS1560853670          CRH
                              ESB                                       1.375
                                                                         1.75      18/10/28
                                                                                   07/02/29    18/10/16
                                                                                                 07/02/17      21/10/16
                                                                                                               10/02/17             500600
    XS1529684695    Gas Networks Ireland                                1.375      05/12/26    05/12/16        20/01/17                500
      XS1565699763          Ryanair                                     1.125      15/08/23      15/02/17      17/02/17             750
    XS1560853670             ESB                                         1.75      07/02/29    07/02/17        10/02/17                500
                                    Sources:                          Bank of Finland, Finanzen De, Unicredit.
    XS1565699763           Ryanair                                      1.125      15/08/23    15/02/17        17/02/17                750
                                                         Sources: Bank of Finland, Finanzen De, Unicredit.

                             Irish component
     It can be seen that the Irish component of the CSPP
                                                       CSPP was highly concentrated, with three of the
beneficiaries being state-owned (ESB, Gas Networks Ireland) or semi-state bodies (DAA), most of
which had multiple bonds bought. The remainder were purchased by Designated Activity Company
                                        Ryanair, Kerry
(DAC) subsidiaries of private firms; Ryanair,    Kerry Group
                                                       Group and   CRH66. The maturities of these bonds
                                                              and CRH
were varied
were  varied in accordance
                accordance with the CSPP’s aim of lowering interest rates across the investment-grade
spectrum. Figure
             Figure8 8shows thethe
                        shows   initial bond
                                   initial   term
                                           bond    andand
                                                 term  the years remaining
                                                           the years        for these
                                                                     remaining    for bonds as of March
                                                                                      these bonds  as of
2019.
March 2019.

                                                  DAA 6.5872%
                                            Kerry Group 2.375%
                                                    ESB 2.125%
                 Issuer + Coupon %

                                                    ESB1.875%
                                                Ryanair 1.875%)
                                                     ESB 1.75%
                                     GAS Networks Ireland 1.75%
                                                   DAA 1.554 %
                                        CRH Finance DAC 1.375%
                                                Ryanair 1.125%
                                                Ryanair 1.125%

                                                                  0     2       4         6     8         10      12     14     16
                                                                                               Years

                                                      Initial bond term         Years Remaining (Coupon Payments)

               8. Irish CSPP Bond Term
       Figure 8.                  Term Structure/Remaining
                                       Structure/Remaining (as
                                                           (as at
                                                               at March
                                                                  March 2019).
                                                                         2019). Source:
                                                                                Source: Bank of Finland
                                                                                                Finland
       (2018), Börse Frankfurt.
                      Frankfurt.

     This
     This programme
          programme hashas provided
                           provided aa select
                                       select subsection
                                               subsection of
                                                          of Irish
                                                             Irish NFCs
                                                                   NFCs with
                                                                         with indirect
                                                                               indirect funding
                                                                                        funding with
                                                                                                 with total
                                                                                                       total
net          of €1.345
net holdings of €1.345 billion by June 2018 (53 percent of Ireland’s capital key of 1.607 percent). The
    holdings           billion by June  2018  (53 percent of Ireland’s capital  key of 1.607 percent).  The
following
following section
          section considers
                  considers aa case
                               case study
                                    study of
                                           of one
                                              one such
                                                   such company,
                                                        company,Ryanair.
                                                                   Ryanair.

4.2.2. CSPP Case Study: Ryanair
6     It is worth noting that the Irish corporate bond market is relatively thin compared to, for example, the French corporate
         This
      bond     section takes a case study approach to consider the impacts of the CSPP on one company
             market.
quoted on the Irish Stock Exchange (ISEQ). Ryanair is chosen as it was one of the largest beneficiaries

6     It is worth noting that the Irish corporate bond market is relatively thin compared to, for example, the French
      corporate bond market.
Economies 2019, 7, 98                                                                                                                                                                                              13 of 25

4.2.2. CSPP Case Study: Ryanair
      This section takes a case study approach to consider the impacts of the CSPP on one company
quoted on the Irish Stock Exchange (ISEQ). Ryanair is chosen as it was one of the largest beneficiaries
of the CSPP. Table 4 shows the purchase of Ryanair’s bonds by the Central Bank of Finland with an
initial purchase made on 15 July 2016.

                                                Table 4. Ryanair bond purchases by the Central Bank of Finland.

          Initial ECB Purchase                                            15/072016                                15/07/2016                                 17/02/2017                                Total
                   ISIN                                              XS1077584024                            XS1199964575                                 XS156569963
                Coupon                                                    1.875                                   1.125                                       1.125
                Maturity                                                17/06/21                                 10/3/23                                     15/8/23
             Date of issue                                             17/06/2014                              10/03/2015                                  15/02/2017
              Initial (€mn)                                                850                                     850                                         750
        Holdings as at Sept 2016                                     €38,484,542.53                          €38,484,542.53                                                                       €76,969,085.06
        Holdings as at Nov 2017                                     €147,381,620.72                         €142,205,088.32                            €125,249,704.23                           €414,836,413.77
       Holdings as at March 2018                                    €164,597,763.51                         €159,594,371.03                            €140,383,694,33                           €464,575,828.87
        Holdings as at June 2018                                    €169,361,040.92                         €163,675,808.38                            €143,799,186.96                           €476,836,036.27
       % of Irish CSPP Portfolio                                          12%                                     13%                                       11%                                        37%
                                                                                      Source: UniCredit (2016–2018).

      Rather than expanding the purchases to different companies as the programme continued, the
ECB increased net purchases within the existing portfolio each month. Shown here is that Ryanair net
purchases increased sharply during the initial purchase phase, with holdings increasing from €76.83 to
€414.84 million between September 2016 and November 2017. Purchases reflected a constant weighting
of 0.32% in the overall CSPP and 37% in its Irish component in the financial statements observed. It is
also worth noting that the ECB added the second 1.125% 2023 bond just two days after its first date
of issuance.
      While this data does not isolate the impact of the APP on Ryanair bond performance relative to
other factors, such as Ryanair strikes and cancellations over this time period, it is, however, likely that
admission to the CSPP created higher bond prices due, in part, to anticipated and actual CSPP demand.
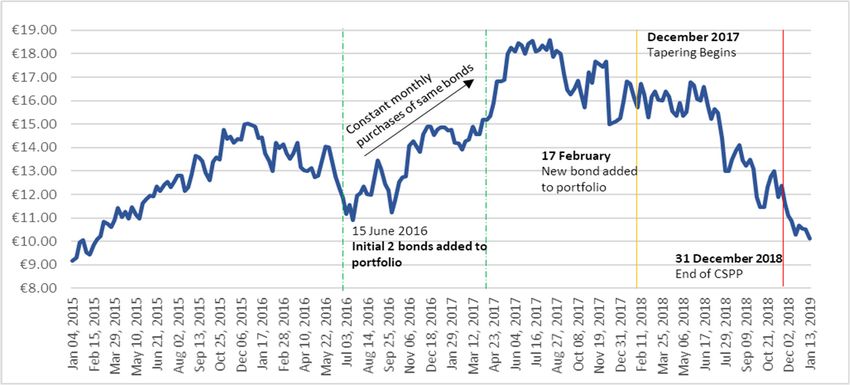
Figure 9 shows the Ryanair 1.875% 2021 bond performance through the CSPP. It can be seen that the
1.875% 2021 bond rose in value from €101.96 in January 2016 (on the announcement of the CSPP), to a
high point of €108.60 in May 2016. With a sustained increase in purchases by the ECB held monthly
between June 2016 and December 2017 (after which tapering began), these bonds remained on an
elevated plateau of a price average of €105.74 over the CSPP’s duration with a standard deviation
of 0.79. Although an official ECB taper did not occur until December 2018, investment in the CSPP
portfolio components slowed far sooner. After tapering, this price has declined down to €102.82 by
February    2019.2019, 7, x FOR PEER REVIEW
         Economies                                                                          14 of 26

                           110
                                                                  9 March 2015                                15 July 2016
                           108                                    PSPP Begins                                 Added to CSPP Portfolio
                  Bond Value (€)

                           106                                            10 March 2016
                                                                          CSPP
                           104                                            Announced                 Stable, elevated price through
                                                                                                    CSPP
                           102

                           100

                                   98
                                        8月-14
                                                 11月-14
                                                          2月-15
                                                                  5月-15
                                                                          8月-15
                                                                                  11月-15
                                                                                           2月-16
                                                                                                   5月-16
                                                                                                           8月-16
                                                                                                                    11月-16
                                                                                                                             2月-17
                                                                                                                                     5月-17
                                                                                                                                             8月-17
                                                                                                                                                     11月-17
                                                                                                                                                               2月-18
                                                                                                                                                                       5月-18
                                                                                                                                                                               8月-18
                                                                                                                                                                                       11月-18
                                                                                                                                                                                                2月-19

              9. Ryanair
      Figure Figure         1.875%
                    9. Ryanair 1.875%2021  Performance
                                      2021 Performance    through
                                                       through CSPP.CSPP.
                                                                     Source:Source:   Bank of
                                                                             Bank of Finland    Finland
                                                                                             (2018), Börse (2018),
      Börse Frankfurt.
             Frankfurt.

               Regarding corporate performance, Ryanair’s participation in the CSPP coincided with a significant
               jolt to its share price. Figure 10 shows that when CSPP commenced, Ryanair share prices rose from
               €12.97 on the date of Ryanair’s first two CSPP bond commencements, 15 June 2016, to €14.18 on
               issuance of its third bond to the ECB on 17 February 2017. The share price reached a high of €18.60 on
               13 August 2017 and has—since tapering—decreased significantly.
98

                     8月-14
                             11月-14
                                       2月-15
                                               5月-15
                                                        8月-15
                                                                11月-15
                                                                         2月-16
                                                                                 5月-16
                                                                                         8月-16
                                                                                                 11月-16
                                                                                                           2月-17
                                                                                                                   5月-17
                                                                                                                           8月-17
                                                                                                                                   11月-17
                                                                                                                                            2月-18
                                                                                                                                                    5月-18
                                                                                                                                                            8月-18
                                                                                                                                                                     11月-18
                                                                                                                                                                              2月-19
Economies 2019, 7, 98                                                                                                                                                                      14 of 25
         Figure 9. Ryanair 1.875% 2021 Performance through CSPP. Source: Bank of Finland (2018), Börse
         Frankfurt.
      Regarding corporate performance, Ryanair’s participation in the CSPP coincided with a significant
         Regarding corporate performance, Ryanair’s participation in the CSPP coincided with a significant
jolt to its share price. Figure 10 shows that when CSPP commenced, Ryanair share prices rose from
         jolt to its share price. Figure 10 shows that when CSPP commenced, Ryanair share prices rose from
€12.97 €12.97
         on theondate     of Ryanair’s first two CSPP bond commencements, 15 June 2016, to €14.18 on
                      the date of Ryanair’s first two CSPP bond commencements, 15 June 2016, to €14.18 on
issuance    of  its third bondbond
         issuance of its third    to the  ECB
                                      to the   onon1717February
                                             ECB                 2017.The
                                                        February 2017. The  share
                                                                          share     price
                                                                                 price     reached
                                                                                       reached a higha of
                                                                                                       high      €18.60 on
                                                                                                              of on
                                                                                                          €18.60
13 August      2017   and  has—since     tapering—decreased       significantly.
         13 August 2017 and has—since tapering—decreased significantly.

                              Figure10.
                             Figure  10.Ryanair
                                         RyanairShare
                                                Share Price
                                                      Price through
                                                            through CSPP.
                                                                    CSPP. Source:
                                                                          Source:Börse
                                                                                  BörseFrankfurt.
                                                                                        Frankfurt.

     Figure  1111
        Figure   shows
                    showsthetheperformance
                                 performance of of Ryanair    shares relative
                                                   Ryanair shares     relativetotothetheoverall
                                                                                          overallISEQISEQ   index
                                                                                                          index     over
                                                                                                                 over  thethe
  period
period    January2014
        January      2014toto March
                              March 2019.
                                      2019.PrePrethethe
                                                     CSPPCSPPin 2016,  it indicates
                                                                 in 2016,             that Ryanair
                                                                             it indicates              share prices
                                                                                             that Ryanair      sharewere
                                                                                                                      prices
  closely
were       correlated
      closely           withwith
               correlated     the overall ISEQ ISEQ
                                   the overall   index.index.
                                                          Furthermore,     Table 5 Table
                                                                 Furthermore,      shows5that showsRyanair   share prices
                                                                                                        that Ryanair   share
  had ahad
prices   verya strong   correlation
                very strong          of 0.956ofto0.956
                                correlation       the market
                                                         to thebetween
                                                                  market January
                                                                             between2014     and May
                                                                                        January      2014 2016.
                                                                                                            andFigure   11
                                                                                                                  May 2016.
  shows
Figure  11this
           showscorrelation    deteriorating
                    this correlation          after theafter
                                       deteriorating      introduction     of CSPP,ofwith
                                                               the introduction         CSPP, thewith
                                                                                                    Ryanair   share price
                                                                                                         the Ryanair   share
  outperforming
price outperforming  the the
                          ISEQ.  Table
                              ISEQ.     5 shows
                                     Table  5 showsthethe
                                                        correlation   coefficient
                                                            correlation             fellfell
                                                                           coefficient   to 0.576
                                                                                             to 0.576from   June
                                                                                                         from     2016
                                                                                                               June  2016to to
  February   2017   with  the introduction   of the first two  bonds   to  the CSPP.   This   fell further
February 2017 with the introduction of the first two bonds to the CSPP. This fell further to 0.068 from     to 0.068 from
  February2019,
February     2017
  Economies2017  toxto
                 7,
                       JanuaryREVIEW
                     January
                     FOR PEER2018
                                 2018when
                                      whenthethesecond
                                                  second Ryanair
                                                           Ryanair bond
                                                                     bond was wasadded
                                                                                   addedtotothe theCSPP
                                                                                                      CSPPportfolio.  The
                                                                                                             portfolio.   The
                                                                                                                   15 of 26
  change in these correlations warrants further investigation to isolate the impact of CSPP on Ryanair’s
change in these correlations warrants further investigation to isolate the impact of CSPP on Ryanair’s
  share price performance.
share price performance.

    €            Ryanair (LHS)                            ISEQ Overall (RHS)
   20                                                                                                                                                                                 10,000.00
                                      15th July 2016                                                                                                 January 2018
   18                                                                                                                                                Tapering Begins
                                      Ryanair Introduced to CSPP                                                                                                                      9,000.00
   16
                                                                                                                                                                                      8,000.00
   14
   12                                                                                                                                                                                 7,000.00
   10
                                                                                                                                                                                      6,000.00
     8
                                                                                                                                                                                      5,000.00
     6
     4                                                                                                                                                                                4,000.00
          Jan 02, 2014
         Feb 27, 2014

         Jun 25, 2014
         Aug 20, 2014

         Dec 10, 2014

          Jan 20, 2016
         Mar 16, 2016
         Feb 09, 2015

         Jun 05, 2015

         Sep 25, 2015

         Sep 06, 2016

         Dec 29, 2016

         Dec 07, 2017

          Jan 18, 2019
         Mar 15, 2019
         Feb 24, 2017

         Jun 22, 2017
         Aug 17, 2017

         Feb 06, 2018

         Jun 05, 2018

         Sep 25, 2018
         Apr 28, 2014

         Oct 15, 2014

         Apr 08, 2015

         May 16, 2016

         Oct 12, 2017
           Jul 31, 2015

         Nov 20, 2015

           Jul 12, 2016

         Nov 01, 2016

         Apr 25, 2017

         Apr 06, 2018

           Jul 31, 2018

         Nov 20, 2018

      Figure 11.11. Ryanair
        Figure              Sharerelative
                    Ryanair Share relativeto to ISEQ
                                             ISEQ     Performance
                                                   Performance     Through
                                                               Through CSPP.CSPP. Sources:
                                                                            Sources:         Investing.com,
                                                                                     Investing.com, Börse
      Börse Frankfurt.
        Frankfurt.

                                                       Table 5. Ryanair Share Price and CSPP Statistics.

                                                                                                                                                                    February 2017–
                                                                                                          June 2016–February
                                                       January 2014–May                                                                                     January 2018 (Second
                                                                                                            2017 (First Bond
                                                        2016 (Pre-CSPP)                                                                                             Bond Added to
                                                                                                            Added to CSPP)
You can also read