Using electrostatic potential maps as visual representations to promote better understanding of chemical bonding - De Gruyter
←
→
Page content transcription
If your browser does not render page correctly, please read the page content below
Chemistry Teacher International 2021; ▪▪▪(▪▪▪): 1–21

Research article

Georgios Tsaparlis*, Giannoula Pantazi, Eleni T. Pappa and Bill Byers

Using electrostatic potential maps as visual
representations to promote better
understanding of chemical bonding
https://doi.org/10.1515/cti-2021-0012
Received April 6, 2021; accepted May 25, 2021; published online June 10, 2021

Abstract: Static visual representations (VRs) of chemical structures are necessary for an understanding of
chemical bonding, a topic which continues to lead to learning difficulties and misconceptions for many
students. The efficacy and problems associated with the use of VRs of chemical structures and chemical
bonding in the form of electrostatic potential maps resulting from accurate quantum mechanical calculations
are the subject of this study, which involved a sample of first year, second semester students, studying the
elective course “Science Education” (N = 31). Students distinguished between nonpolar and polar covalent
bonding, however, they encountered difficulties with concepts related to ionic bonding. Most students did not
employ multistructural thinking (in the sense of the SOLO taxonomy), when providing explanations about the
variation of bond polarity. Persistence of a covalent-ionic bond dichotomy was apparent, while for some, ions
can be involved in both ionic and covalent bonding. Many students preferred to use their established high
school knowledge. On a positive note, many students were clearly affected by the information provided by the
colored VRs. Finally, the minimal experience of our students with these VRs leads us to believe that a more
systematic and extensive coverage would be likely to produce improved outcomes.

Keywords: chemical bonding; chemistry education; first-year undergraduate; misconceptions; quantum
chemistry.

Introduction
The use of models and images (in general, of visual representations) are vital to our understanding of chemistry,
with physical models of molecules providing tools for visualization of the molecular world for both learners and
researchers. Such static images have become a sine qua non for chemistry textbooks. Visualization of a range of
phenomena is clearly necessary for development of an understanding of chemistry (Ferk, 2003; Gkitzia, Salta, &
Tzougraki, 2011; Kozma & Russell, 1997; Wu, Krajcik, & Soloway, 2001) so, in recent years, images, as a rule
colored images, have taken up more and more space in textbooks. In addition, the use of technology, especially
of personal computers and smart phones, has been increasingly important in enhancing both student interest
and learning (Kelly & Akaygun, 2019). For instance, VandenPlas, Herrington, Shrode, and Sweeder (2021)
developed and used online materials (simulations and screencasts) to support students’ learning of chemistry
outside of a face-to-face classroom, with a focus on student understanding of the concepts of force and energy

*Corresponding author: Georgios Tsaparlis, Department of Chemistry, University of Ioannina, GR-451 10 Ioannina, Greece,
E-mail: gtseper@uoi.gr. https://orcid.org/0000-0002-0856-747X
Giannoula Pantazi, Science Laboratory Center (EKPhE) of Preveza, GR-48100 Preveza, Greece, E-mail: liannapantazi@gmail.com
Eleni T. Pappa, 1st ‘Agios Athanasios’ General Senior High School (Lykeion), GR-57003 Thessaloniki, Greece,
E-mail: elenpappa@yahoo.gr
Bill Byers, School of Health Sciences, Ulster University, Jordanstown, BT37 0QB, UK, E-mail: w.byers@ulster.ac.uk

  Open Access. © 2021 Georgios Tsaparlis et al., published by De Gruyter.       This work is licensed under the Creative Commons
Attribution-NonCommercial-NoDerivatives 4.0 International License.
2        G. Tsaparlis et al.: Using electrostatic potential maps as visual representations

changes as they pertain to bonding and intermolecular attractions. Also, Isaloka and Dwiningsih (2020) pro-
duced 2D interactive multimedia to display special-visual orientations of polar and nonpolar covalent bonds,
and evaluated their content validity, construct validity and practicality, while Brown, Whaley, and Hyslop (2020)
compared the effectiveness of three methods (virtual reality, computer simulation, and traditional modeling)
used in teaching molecular geometry to college chemistry students, and reported that while differences among
the three methods were not significant, the results showed that the virtual reality method resulted in more
enthusiasm and positive attitudes toward the topic among the students.
     However, the mere use of images and technology does not guarantee their effectiveness in promoting
learning and it may even contribute to the formation of misconceptions by students. Learning outcomes
appear to depend on both the quality and the pedagogic content of the images and also on how the images and
the technology are used (National Research Council, 2012). In particular, the speed with which a user can
access different representations of molecules in a technology enabled environment can provide important
benefits to cognitive development (Polifka, Baluyut, & Holme, 2021). Education research has definitively an
important role to play here in assessing the outcomes and the effectiveness of these tools.
     One topic where visual representations currently play a crucial role is that of chemical bonding, which is
fundamental to the teaching of chemistry (Atkins, 1999; Gillespie, 1997; Holme & Murphy, 2012; Holme,
Luxford, and Murphy, 2015; Taber & Coll, 2003). Chemical bonding is associated with the understanding of
many chemistry concepts, such as chemical reactions and structure–property relationships, but continues to
be difficult for teachers to organize and teach and for students to learn and understand. The initial focus here is
on the teaching and learning of basic bonding concepts in upper secondary education (grades 10th to 12th).
Prevailing approaches to teaching chemical bonding continue to lead to learning difficulties and mis-
understandings for many students, with many of these misunderstandings proving resistant to instruction (e.g.
Levy Nahum, Mamlok-Naaman, Hofstein, & Krajcik, 2007; Nicoll, 2001; Özmen, 2004; Taber & Coll, 2003).
     Taber (1998) proposed an ‘alternative conceptual framework’ for chemical bonding, according to which
the ‘octet rule’ is used by the students as an explanatory framework for chemical stability and reactivity, and he
further identified the four key “pedagogical learning impediments” to the effective teaching and learning of
chemical bonding (Taber, 2001): (1) an atomic ontology and the initial atomicity; (2) the over-generalization of
the octet rule; (3) the dichotomous classification of bonding; and (4) the use of anthropomorphic language,
with student explanations commonly phrased in terms of what an atom might ‘want’ or ‘need’” (Taber & Adbo,
2013, p. 348). Taber (1999) considered this framework as a largely coherent theory-like basis for thinking about
chemical stability, change and bonding (for a review, see Taber, 2013). In addition, Taber (2001) introduced a
curricular model of chemical bonding, which starts with metallic structures, then goes on to ionic structures, to
giant covalent structures, and finally to simple molecular structures. The model emphasizes molecules and
ions (rather than atoms) as the basic unit of matter, so as to avoid the assumption of initial atomicity, while the
nature of bonding, structures, and properties of substances are explained in terms of electrostatic forces, but
not the octet rule, nor the desires of atoms. Addressing bonding in terms of electrostatics could also serve as a
good foundation for subsequently learning about electronegativity, bond polarity, hydrogen bonds, and
solvent-solute interactions.
     Levy Nahum et al. (2007) (see also Kronik, Levy Nahum, Mamlok-Naaman, & Hofstein, 2008; Levy Nahum,
Mamlok-Naaman, & Hofstein, 2013; Levy Nahum, Mamlok-Naaman, Hofstein, & Taber, 2010) also developed
“a new teaching approach for the chemical bonding concept aligned with current scientific and pedagogical
knowledge”. A qualitative description that is conceptually consistent with quantum mechanics was adopted,
providing an answer to the question “what really causes atoms to interact and form a chemical bond?” The
authors suggested the ‘bottom up’ approach for teaching the bonding concept. The crux of the suggestion is
that bonding should be taught based on elementary principles and by using the idea of a continuum of bond
strengths, removing the artificial dichotomous division between different types of bonding.
     In a preceding publication, we reviewed studies concerning students’ conceptual difficulties with the topic
of chemical bonding, tested the knowledge of 10th-grade Greek students on certain key aspects of bonding and
presented our findings from the use of an enriched teaching text on this topic (Tsaparlis, Pappa, & Byers, 2018).
The enriched text started with covalent bonding between atoms of the same or different chemical elements and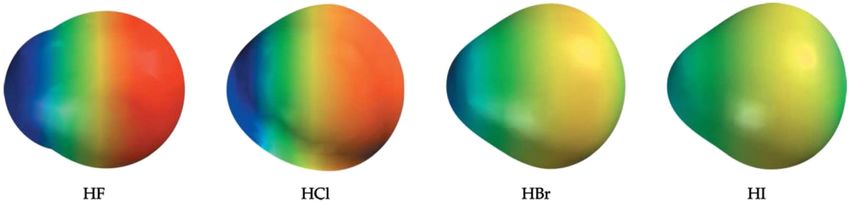
G. Tsaparlis et al.: Using electrostatic potential maps as visual representations   3

the nature of the bonding but postponed the study of bond polarity (polar covalent bonds) until after dis-
cussing ionic bonding. It included a careful discussion about the octet rule, paid particular attention to
features that characterize both the covalent and the ionic bond, and gave a more detailed coverage of elec-
tronegativity, stressing its importance to the understanding of the continuum between ionic and covalent
bonding. The intervention introduced with the treatment group demonstrated mixed results, with statistically
significant differences being detected for some concepts/knowledge elements, but not for others. Finally, in a
follow up study to our previous one (Tsaparlis, Pappa, & Byers, 2020), we reviewed studies on student
understanding and on teaching of bonding concepts and presented proposals for the teaching of chemical
bonding at secondary level based on the findings of our own study (Tsaparlis et al., 2018). The proposals
included a spiral curriculum spanning all three upper-secondary grades, plus a learning progressions
approach, employing lower and upper anchors of relevant scientific knowledge and a proposed list of potential
core concepts, lever concepts, and stepping-stones.
     The net conclusion is that critical details and some sophisticated reasoning are required for an under-
standing of chemical bonding, for example the many types of bonding (metallic, ionic, covalent, polar and
non-polar bonding, intermolecular bonding). It is crucial to have in mind that, because bonding is taught at
both the (mainly upper) secondary and the tertiary level, there is an overlap of concepts, instructional tools and
approaches between the secondary and the first-year undergraduate level. Although, complexity is present
from the early stages, it deepens as we move from secondary to tertiary education.
     In the present study, we examined the efficacy and problems associated with the use of static colored visual
representations (VRs) of chemical structures and chemical bonding resulting from accurate quantum mechanical
calculations (Jensen, 2010). The diagnostic part of our 2018 study led to the conclusion that many fundamental
misconceptions were evident in our samples. We list below some selective misconceptions and conceptual
difficulties that were discussed in the Tsaparlis et al. (2018) study, which are relevant to the present study:
– The ionic bond is referred to as just a transfer of electrons between separate atoms in order to acquire full
     valence shells and satisfy the octet rule.
– Covalent and ionic bonds are often presented in isolation, as bonds that share electrons and bonds that
     transfer electrons respectively.
– Bond polarity is directly linked to the covalent bond. As a consequence, students fail to realize the
     covalent-ionic bond continuum.
– Ions are involved in both ionic and covalent bonding (deriving from the knowledge that a polar covalent
     bond possesses some ionic character).

Rationale
In the final part of a previous paper, we considered the pros and cons of teaching a modern qualitative
quantum mechanical approach to bonding (Tsaparlis et al., 2020). Despite the fact that the teaching of modern
qualitative quantum mechanical descriptions of atomic and molecular structure at secondary level has been
criticized by some chemistry educators (Bouayad, Kaddari, Lachkar, & Elachqar, 2014; Tsaparlis, 1997a, 1997b,
2013), there is no doubt that quantum mechanics can refine one’s understanding about the submicroscopic
world. Atomic orbitals, their physical interpretation, as well as electron configurations of atoms and mon-
oatomic ions are often discussed in upper secondary school. Although molecular orbitals are not generally
introduced, Lewis structures, possibly hybrid atomic orbitals, use of the VSEPR model to discuss molecular
structure and consideration of electron clouds and their overlap in bonding are all likely to be beneficial to
students’ understanding. Pauling’s proposal that beginning courses in chemistry should emphasize the
simpler aspects of molecular structure in relation to the properties of substances is clearly of relevance here.
According to Pauling (1992), concepts to be covered should include the electronic structure of the atom, with
emphasis on the noble-gas structure, the shared electron-pair bond, the tetrahedral carbon atom, the elec-
tronegativity scale, the partial ionic character of bonds, and the idea of resonance as applied to the benzene
molecule; but molecular orbitals should not be introduced at this stage.
4 G. Tsaparlis et al.: Using electrostatic potential maps as visual representations
Some researchers have encouraged early introduction of a quantum mechanical approach. For example,
considering upper-secondary and first-year undergraduate students, Dhindsa and Treagust (2014) used the
valence-bond model of bonding to explain covalent bonding in terms of the overlap of atomic orbitals on
bonded atoms, while Nimmermark, Öhrström, Martensson, and Davidowitz (2016), based on data concerning
Swedish undergraduate students, suggested that it is likely to be beneficial to the understanding of bonding
(and especially the covalent bond) if secondary-school students have been introduced to at least a simplified
quantum model of the atom. Although the physical interpretation of atomic orbitals and the electron con-
figurations of atoms and monoatomic ions may be useful, molecular orbitals should certainly not be intro-
duced at the secondary level, and only Lewis structures and the VSEPR model should be used to consider
molecular structures at this stage. It appears that the teaching of certain aspects of the molecular quantum
mechanical model in secondary education, such as electron clouds and their overlap in bonding, can be
beneficial to students and should not be ruled out. However, modern quantum-chemical concepts should only
be introduced, with great care (Dunstan, 1968; Tsaparlis, 1997a, 1997b).
The importance of static visual representations of chemical structures resulting from
quantum mechanical calculations
It is known that conventional undergraduate courses on quantum chemistry tend to be strongly mathemati-
cally oriented and this poses a learning impediment to most students, making it hard for them to gain
conceptual understanding of the relevant concepts (Tsaparlis, 1997a, 2013). On the other hand, qualitative
approaches, which are based on the visualization of atomic and molecular orbitals and, as a rule, are employed
in introductory general and inorganic chemistry courses, may also fail to provide a clear physical picture. For
Barradas-Solas and Sánchez Gómez (2014), the use of graphical representations of orbitals have characteristics
that fall into the category of alternative conceptions or misconceptions and this has even led to suggestions
that these ‘chemical’ orbitals should be omitted from chemistry education altogether. In any case, to be
effective, such approaches require great care (Tsaparlis & Papaphotis, 2009). Dangur, Avargil, Peskin, and
Dori (2014) employed a qualitative visual-conceptual approach to teaching quantum chemistry (including
bonding concepts, and emphasizing interdisciplinary real-life applications) and investigated the effectiveness
of the approach on students’ visual and textual understanding of quantum mechanical concepts. According to
their findings, the textual and visual understanding of quantum mechanical concepts and the ability to move
across illustrations and explanations were significantly improved for high school honors and undergraduate
chemistry students, who were exposed to this approach. Polifka, Baluyut, and Holme (2021) have used a
“Variable Representation Assessment” tool, with which questions and responses are delivered via a web
browser, and which can provide formative information about how students in a course are utilizing molecular
representations to respond to questions about molecular properties that can be inferred from such repre-
sentations. Using this tool, students in a US general chemistry course navigated among five different repre-
sentation styles: (1) chemical formulas; (2) Lewis structures; (3) wedge and dash structures; (4) ball and stick
structures; and (5) electrostatic potential maps. Results suggested that students needed to utilize a better
balance among the various molecular representations. It was concluded that the preponderance of use of
Lewis structures in many chemistry lessons might have led students to limit their use of a wider range of
representations, while the students’ apparent lack of familiarity with electrostatic potential maps seems likely
to have contributed to their relative aversion to using them.
Supplementary Material S1 discusses the concept of electron probability density (or simply electron density)
(Jensen, 2010; Matta & Gillespie, 2001, 2002; Pilar, 1967), while Supplementary Material S2 describes the
method of construction and interpretation of isodensity surfaces and electrostatic potential maps (Anslyn &
Dougherty, 2006; Reed College, 2021). Note that this knowledge is supplied here for the benefit of the readers,
but it was not part of the teaching and knowledge of the students in our study. Also, although electrostatic
potential ranges were not included in the electrostatic potential maps used, it is important and useful to
compare structures with the same electrostatic potential ranges (see Supplementary Material S2).G. Tsaparlis et al.: Using electrostatic potential maps as visual representations 5
The present study – research questions
Taking into account that the students were not familiar with the static colored representations prior to the
examination used in the present study, the main research question is:
– How do students interpret colored VRs when presented with them for the first time? Or equivalently:
– Are students able to immediately decode and incorporate/synthesize colored VRs into their previous
chemistry knowledge?
The answer to this main research question will be derived from the answers to a number of subsidiary research
questions, relating to students’ use of static visual colored representations (VRs) of chemical structures and
chemical bonding which have resulted from accurate quantum mechanical calculations, as follows:
– To what degree did the provided static colored VRs help the students to:
RQ1: deduce the type of bonding in various molecules?
RQ2: explain the variation of bond polarity in various molecules?
RQ3: exploit the difference in size between an atom and its corresponding ion?
RQ4: comprehend the concept of a continuum of bonding type and overcome the common misconception that
bond polarity is only a feature of covalent bonds and not of ionic bonds? In addition:
RQ5: What types of static VRs for common covalent molecules, such as H2 and H2O, are the students already
familiar with?
RQ6: How does the information that students can obtain from the colored VRs resulting from quantum
mechanical calculations compare with the information that they can obtain from the VRs that they are already
familiar with?
Method
Sample
The students of our study (Ν = 31) were in their first year, second semester (age 18–19), studying the elective course “Science
Education” in the Department of Chemistry at the University of Ioannina, in the spring semester of the academic year 2018–19. The
purpose of the course was to function as an introduction to content knowledge and pedagogic content knowledge which is relevant
to the profession of a secondary school chemistry teacher. Students take this course because “Chemistry Education” is prescribed by
the Greek Ministry of Education and by Greek law as one of the tests to be taken by secondary chemistry teacher candidates.
The lecturer, who was one of the authors of this paper (GP), is a secondary science teacher with a first degree in physics, and a
holder of a M.Sc. and a Ph.D. in science education and was hired to teach this course within a project offering university teaching
experience to recent Ph.D. graduates. Instruction was carried out in Greek and followed an in-class lecture format, with the
instructor adopting an interactive approach, making efforts to engage the students in thinking, questioning and discussion during
the lectures. The students (both male and female, with females outnumbering males: 19 vs. 12) were majoring in chemistry and used
Greek science education textbooks (in Greek) that were recommended for this course by the instructor.
The study utilized a final written in-class closed-book examination in June 2019. There were four sections in the examination
paper, but only section D is relevant to this study and has been reproduced in English in Supplementary Material S3. The duration of
the examination was 3 h, but the distribution of time to each section and question was left entirely up to the student.6 G. Tsaparlis et al.: Using electrostatic potential maps as visual representations
The instrument
Section D of the examination consisted of four questions. Question D.1 (which addressed research question RQ5 and is also related to
RQ6) asked the students to draw as many VRs as they knew about the hydrogen molecule (H2) and the water molecule (H2O).
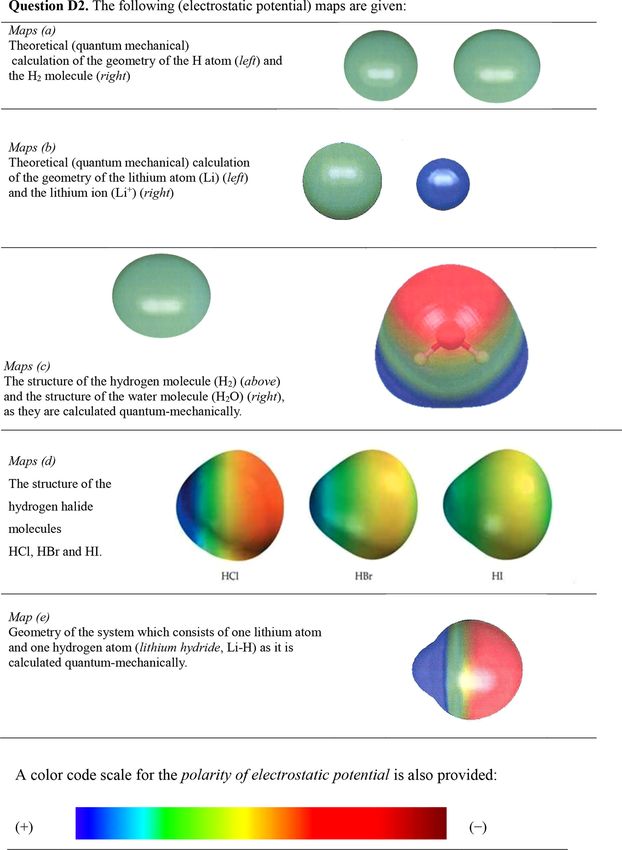
Question D.2 involved five parts and related to a set of colored static structures, in the form of electron potential density (EPD)
surfaces, which have resulted from proper quantum mechanical calculations of high accuracy (Jensen, 2010). The electrostatic
potential map for hydrogen fluoride was not included with the hydrogen halide molecules because its intense polarization, as
shown through coloring, makes it very similar to the coloring of LiH, hence there was the fear that HF could be taken by the students
as being essentially ionic (see Figure 1). Figure 2 shows the electrostatic potential maps used in the study.1 Note that dipole
moments, electronegativity differences and gas phase bond lengths were not supplied for the hydrogen halide molecules.2
For convenience of reference for the reader, the five parts of question D.2 are listed in Table 1, along with the research questions
they were designed to address.
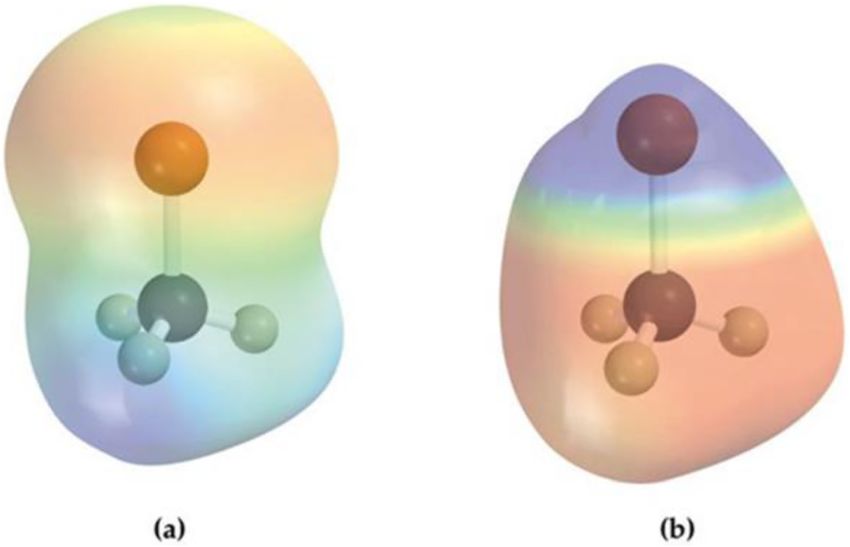
Question D.3 (which addressed research question RQ2) provided pictures of colored VRs for two organic molecules with similar
structures (CH3Li and CH3Cl) (see Figure 3 and Supplementary Material S3), and asked students to identify and justify which
structure corresponded to which molecule. Note that the diagrams used for question D.3 (which were taken from the internet) have
certain drawbacks, such as the weakness of the blue and red coloring, as well as the sizes of the shown nuclei of the chlorine and the
lithium atoms, which must have caused problems to the students. This was taken into account when marking the students’ answers.
Finally question D.4 (which addressed research question RQ6 and is also related to all previous research questions) was of a
metacognitive nature and asked students to compare the VRs for the hydrogen molecule and the water molecule that they drew in
answering question D.1 with the corresponding colorful quantum mechanical VRs.
Ethical considerations
Every effort was made to observe the rules of good ethical conduct for implementing a social research study with university students
(Taber, 2014). The students answered the questions as part of their final examination in the science education course, that is, they
were not given any choice over taking part. Institutional permission to use formal examination material in the research was not
required, but the lecturer had to report on the course and the exam to a departmental professor. In addition, the students were
informed that the particular questions would be used as part of an education research study and no objections were received. All
students provided written consent to the use for their responses for the stated research part of the test. Although the students were
required to provide their names, as the questions were part of the examination, with responses contributing to their course mark,
their names were not to be revealed to any third parties.
Figure 1: The electrostatic potential maps for the hydrogen halide molecules HF, HCl, HBr and HI, where the colors show differences
in chemical bond polarity. The dipole moments μ (in D) are 1.86 for HF, 1.11 for HCl, 0.788 for HBr, and 0.382 for HI. The corresponding
Pauling electronegativity differences are 1.78/0.96/0.76/0.46. Note that the shapes shown do not reproduce the relative actual
molecular sizes: the gas phase bond lengths D(H–X) (in pm) are 91.7 for HF, 127.4 for HCl, 141.4 for HBr, and 160.9 for HI.
1 Εlectrostatic potential maps resulting from quantum mechanical calculations of high accuracy by Jensen (2010), in black-and-
white. The static colored figures were taken from website http://www.flickr.com/photos/molmodbasics (accessed 17-May-2021) and
are used here with permission from the author.
2 Although it is assumed that a lack of understanding of electronegativity may lead to a misunderstanding of polar covalent
bonding (Burrows & Reid Mooring, 2015), we wanted to avoid the simple interpretation that if the electronegativity difference is
large enough then ionic bonds will be formed. However, we know that it is not as simple as this, as the case of HF demonstrates.G. Tsaparlis et al.: Using electrostatic potential maps as visual representations 7 Figure 2: The electrostatic potential maps used in the main study, including a color code scale for the polarity of electrostatic potential.
8 G. Tsaparlis et al.: Using electrostatic potential maps as visual representations
Table : The five parts of question D. and the corresponding research questions (see also Figure ).
Part of Tasks Research
D.2 question
D.a Compound lithium hydride is ionic (it is a crystalline solid, for which the melt is a conductor of RQ, RQ
electricity).
(i) Which are the cation and the anion in this compound?
(ii) With the aid of: maps (a) (left), maps (b) and map (c), explain why this compound is ionic.
D.b What do the color differences of the HCl, HBr and HI hydrogen halide molecules show? [maps (d)] RQ
D.c Which of the structures of maps (c), (d) and (e) show a chemical bond polarity? RQ
D.d State in which one of the maps (a), (b), (c), (d) and (e), the structures demonstrate the continuity RQ
between the covalent and the ionic bond, and why.
D.e Mention two features that the color visual representations (VRs) help us understand. RQ, RQ, RQ,
RQ
Figure 3: Visual representations
of chemical structures
referring to chloromethane
(CH3Cl) and methyllithium
(CH3Li) from question D.3.
(Students were asked to
identify and justify which one
corresponds to CH3Cl and
which to CH3Li and why?).
Method of analysis
A variety of assessment approaches was adopted for marking the scripts. Three of the authors agreed on the
assessment approaches to be used. Question D.1 was marked on the basis of a sequence of expected VRs for the
H2 and H2O molecules. In the case of H2, half of the marks were assigned for the inclusion of the ellipsoid
isodensity surface (a ‘flattened sack’) for H2 [see maps (a) right in Figure 2, and the top right shape in the answer
of student #18 in Figure 4]. The marking is evident from the answers provided by the two best students, as
shown in Figures 4 and 5. Question 4 was of a metacognitive character and its marking was based on a list of
expected points of view. In the cases of question D.2 (with the exception of part D.2e) and question D.3, the
SOLO taxonomy was considered most appropriate. SOLO stands for “Structure of Observed Learning Out-
comes”, and is suitable for open-ended questions where the complete answer involves many factors; it may, in
addition, require relational and abstract thinking. More specifically, it classifies students’ responses into five
levels of understanding from the simplest to the most complex: (1) pre-structural, (2) uni-structural, (3) multi-
structural, (4) relational, and (5) extended abstract (Biggs, 1999; Biggs & Collins, 1982). Extended abstract
understanding is essential for complex conceptual situations and for real problem solving. Further informa-
tion about the SOLO taxonomy and the marking scheme employed can be found in Supplementary Material S4.
In our case, we first considered what should be expected as a complete answer for each question, and thenG. Tsaparlis et al.: Using electrostatic potential maps as visual representations 9
judged the SOLO level that was required. Using this approach, we concluded that all questions were relatively
straightforward, so extended abstract thinking was not required to answer any of them. Two parts (D.2b and
D.2c) required only multi-structural thinking, while a further two parts (D.2a and D.2d) were more complex
requiring relational understanding in addition to multi-structural thinking. Part D.2e required students to
mention two features that the colored visual representations (VRs) help us to understand, so declarative and
partly procedural knowledge were likely to be sufficient here, making the marking of this question relatively
straightforward.
Reliability of the marking of the scripts was ensured on the one hand by the students’ scripts being subjected
to three rounds of marking by one author (GT) according to a pre-determined marking scheme. The correlations
between markings were positive and very strong. For example, the Pearson correlation coefficient between the
second and the third marking for question D.2a was r = 0.851, while the corresponding Spearman coefficient was
ρ = 0.835; also the Pearson correlation coefficient between the second and the third marking for question D.3 was
r = 0.936, while the corresponding Spearman coefficient was ρ = 0.878. In addition, ten of the student scripts were
marked by another author (EP) according to the set marking scheme. After the dissolution of discrepancies by
discussion, the Pearson correlation coefficients between the two markers ranged from 0.831 to 0.980, and the
Spearman correlation coefficients (with one exception: 0.583) ranged between 0.766 and 0.969.
In addition to descriptive statistics, quantitative data were subjected to an inductive analysis, employing
nonparametric statistics tests, as follows: the Friedman test for comparing multiple measures and the Wil-
coxon signed-ranks test (with a Bonferroni correction applied) for carrying out paired comparisons.
Nonparametric statistics was adopted because of the limited sample size and the non-conformity of the data to
normal distribution in most cases. Statistical analyses were made using the SPSS package. However, the main
Figure 4: Student #18’s
drawings in response to
question 1. This student was
marked 100% for the
structures for H2 and 96% for
the structures of H2O.
Figure 5: Student #16’s
drawings in response to
question 1. This student was
marked 50% for the structures
for H2 and 93% for the
structures of H2O.10 G. Tsaparlis et al.: Using electrostatic potential maps as visual representations emphasis of our reported results is on qualitative conclusions based on students’ written justifications of their answers. The examination paper and students’ written responses were in Greek. Accuracy of translation into English was checked by back translation of the English version into Greek by one of the authors (GT). The two Greek versions (original and back-translated) were then compared, some changes to the English version were made and the final text in English was checked by another author (BB) (Brislin, 1970, 1986). Results and discussion Descriptive statistics The mean mark obtained by the 31 students on section D was 52.9% (s.d. 16.2%), reflecting a moderate performance. There were seven students (22.6% of all students) who achieved a mark >70% (students # 18, 8, 27,16, 9, 12, and 4, with student #18 achieving the highest mark 77.4%). Table 2 shows descriptive statistical data for each of the four questions and the total mark for section D. We note that the highest mean mark was for question D.2 (57.9%) and the lowest for questions D.1 (37.3%). Inductive statistical analysis I: comparison of the individual questions D.1, D.2, D.3 and D.4 of section D The Friedman test statistic is χ2(3) = 8.089, which is significant (p = 0.044). Table 3 shows the statistical comparisons between pairs of questions D.1, D.2, D.3 and D.4, according to the Wilcoxon signed-ranks test. It is seen that question D.1’s differences from questions D.2, D.3, and D.4 are statistically significant (for D.1–D.2, and D.1–D.3, p < 0.01; for D.1–D.4, p < 0.05), while D.2 and D.3, as well as D.2 and D.4 and D.3 and D.4 are not differentiated between themselves. It is concluded that while D.1 proved the most difficult question, the performances on D.2, D.3 and D.4 were all similar. Table : Results of descriptive statistics: Percent achievement on the individual questions and overall performance on section D. Question (contribution) D.1 (20 marks) D.2 (60 marks) D.3 (10 marks) D.4 (10 marks) Section D, total Mean .% .% .% .% .% s.d. .% .% .% .% .% Max % % % % % Min % % % % % Median .% .% .% .% .% Table : Paired comparisons of questions D., D., D. and D. on the basis of the Wilcoxon signed-ranks test. Values of z statistic, with -tailed significance level (p) within parenthesis. Question D.1 D.2 D.3 D.4 D. – −. (
G. Tsaparlis et al.: Using electrostatic potential maps as visual representations 11
Question D.1: visual representations of the hydrogen and water molecules
Question D.1 showed the poorest achievement (37.3%), and this was the case for both its parts (see Table 4),
dealing with VRs for the hydrogen and the water molecule respectively. The poor results resulted from the fact
that many students used only simple structural formulas: H–H and linear and/or bent H–O–H, plus the
corresponding Lewis structures. Many also used ball & sticks models. Very few included the value (104.5°) for
the angle in H2O. Several students used models of atoms in molecules, such as two touching and/or over-
lapping circles for H2. Very few used the ellipsoid isodensity surface for H2 (see Figure 4) or the sp3 hybrid
orbitals model for H2O (see Figures 4 and 5).
Figures 4 and 5 show the best two answers (97 and 80% respectively) to question D.1, which were
submitted by students #18 (Figure 4) and #16 (Figure 5). Note that student #18 was ranked first with a mark of
77.4% and student #16 was ranked fourth with a mark of 73.4 overall on section D.
Question D.2: using electrostatic potential maps as visual representations
We will now focus on question D.2 and its five parts (see Table 1 and Figure 2), which is particularly relevant to
the present study. Table 5 shows the descriptive statistics. Students performed well on parts D.2e and D.2c (82.7
and 73.2% respectively). D.2e asked for two features of the colored VRs that help us to understand chemical
bonding and most students provided good answers, while part D.2c asked about polar structures among the
colored figures. The remaining three questions showed lower mean performances of around the 50% mark.
Part D.2a asked for an explanation of the highly polar bond (approaching ionic) displayed in the compound
LiH, Part D.2b concerned the color differences displayed by the hydrogen halides HCl, HBr and HI, while D.2d
involved the continuity between ionic and covalent bonding. For a complete explanation, all three of these
parts required multi-structural SOLO thinking, that is, employment of more than one feature or property was
needed. In addition, parts D.2a and D2.d, where a complete answer requires a relational dimension of the SOLO
taxonomy, in addition to the multi-structural elements were considered particularly demanding. For this
reason, we chose to assign a higher contribution to these two parts in comparison to the other three parts of
question D.2 (see Supplementary Material S3).
Table : Percent achievement on the parts of question D..
Part (contribution) D.1a (6 marks) D.1b (14 marks)
Mean .% .%
s.d. .% .%
Max % %
Min % %
Median .% .%
Table : Percent achievement in the five parts of question D..
Part (contribution) D.2a (15 marks) D.2b (10 marks) D.2c (10 marks) D.2d (15 marks) D.2e (10 marks)
Mean .% .% .% .% .%
s.d. .% .% .% .% .%
Max % % % (nine times) % (three times) % ( times)
Min % % % % (six times) %
Median .% .% .% .% 12 G. Tsaparlis et al.: Using electrostatic potential maps as visual representations Table : Paired comparisons of the five parts of question D., on the basis of the Wilcoxon signed ranks test. Values of z statistic, with -tailed significance level (p) within parenthesis. Part D.2a (15 marks) D.2b (10 marks) D.2c (10 marks) D.2d (15 marks) D.2e (10 marks) D.a – −.a (.) −.a (
G. Tsaparlis et al.: Using electrostatic potential maps as visual representations                13

    Student #23: “Li lies lower (than H) in the periodic table, so it is less electronegative, therefore Η has a larger tendency to attract
    electrons. Consequently, H is the anion and Li is the cation. From maps (b) it is seen that the Li cation is smaller since it loses
    one electron, and its color is blue … and acquires a positive charge. On the other hand, H, which acquires a negative charge,
    becomes red. Therefore, with the formation of ionic bond between them, the representation in map (e) results” [Note that this
    student, and also many others, were exact in their response to the first subquestion and just stated which is the cation and which
    the anion, without referring to their actual charges (Li+ and H−). Several other students, however, did write the Li+ and H− ions].

It is true that this student’s answer to the first subpart of D.2a was based on noting trends in electronegativity
related to placement within the periodic table. This allowed the student to deduce that H would be the anion
and Li the cation. This information was then mapped onto the VR to deduce which side is lithium and which
side is hydrogen. Although most students utilized the color coding and electronegativity difference and/or the
bond polarity, few made reference to the size of the two bonded entities:

    Student #3: “Li+, H−. Ionic is the compound in map (e) because, as we see from the colors, the compound contains one blue
    color (the cation) and one red color (the anion)”.

    Student #1: “From the colors [the color scale] for electronegativity, we see blue and red colors in Li–H, which means that there is
    a large difference in electronegativity, therefore the bond is much polarized, so that the elementary charges become nearly
    unity and we have an ionic compound (Besides, Li is a metal, so it does not make covalent bonds)” (Note the more elaborate
    answer here).

It is noteworthy that 10 students did not refer to the color coding for bond polarity at all, but instead used
various arguments concerning the “mechanism” for ionic bond formation (the “history conjecture”, including
anthropomorphic elements) (Taber, 2013):

    Student #26: “It is about an ionic compound because as Li has one electron, which is … donated to H, which has already one
    electron and wants to fill a He noble-gas structure. In map (e) we see that the bond is ionic because of the polarity difference,
    which is considerable” (Note, the reference to the large bond polarity seems likely to have been deduced from the color differences
    observed).

This argumentation is consistent with the approach taught in the upper secondary education (10th grade)
chemistry lessons for these students (see Tsaparlis et al., 2018).

The polar character of the bonds in hydrogen halides and its chromatic interpretation

Part D.2b asked students to identify what the color differences of the HCl, HBr and HI hydrogen halides in maps
(d) show. A complete answer required reference to both bond polarity and the difference in electronegativity
among the three halogen atoms, as well as an explanation for the variety in the coloring. Most students used
just one feature, and answers were often very short or vague. This accounted for the poor performance (mean of
50.2%) on this part.

    Student #11: “[The color differences] show the difference of electronegativity between HCl, HBr, HI” [Similar: #12].

    Student #17: “[It shows] where the charge is displaced”.

    Student #10: “The color difference of the HCl molecule shows that from positive becomes negative, for HBr shows that from
    positive becomes neutral, while HI is a neutral molecule”.

Several students referred to ionic bonds or to ions, especially in the case of HCl:

    Student #13: “[The color difference] shows the polarization of the ionic bond”.

    Student # 23: “The stronger the ionic bond, the more intense and distinct the colors are in the quantum mechanical structures.
    Therefore, the color differences show the reduction of the electronegativity from Cl− to I−".
14 G. Tsaparlis et al.: Using electrostatic potential maps as visual representations
Student # 6: “They show the larger overlap of the H+ atom by the anions, because of their size and their electronegativity. [In
terms of size] the case is that I− > Br− > Cl−”.
Student #4: “The color differences of these molecules show the difference in electron density, and in this way we realize the
ionic nature of the molecular bond and that there is a difference in electronegativity. The last molecule, HI, could even have a
covalent bond because the electrons are nearly evenly distributed”.
Student #15: “The color differences show the difference in polarization of the atoms that make up each molecule; in short, they
show the kind of the bond, which tends to ionic bond and which [tends] to covalent bond. Accordingly, HCl makes an ionic
bond, where Cl pulls the common electron pair; HBr, where Br pulls a little the electrons; and HI makes covalent bond and
shares the electrons”.
Note the elaborate wording of students #4 and #15, despite their conceptual deficiencies. Others referred to
‘ionicity’, meaning apparently the varying ‘ionic character of the (covalent) bond’:
Student #3: “The color changes show the difference of electronegativity between Cl, Br, I; that is, HCl is more ionic compound,
while HBr and HI are not so ionic”.
Finally, we quote the best and three other very good answers to part D.2b (according to our marking):
Student #8: “The color difference show the change in bond polarity (HCl > HBr > HI). The larger the electronegativity difference,
the more polarized the bond is: HCl, large difference, → much polarized; HBr, moderate difference, → little polarized; HI,
small difference, → the least polarized [Similar: #9 and #26].
Student #22: “[They show] that because, in terms of the electronegativity, Cl > Br > I, … the particular coloring happens, because
Cl causes a larger polarity than Br, and Br than I” [Similar: #26].
Student #18: “They show how much polarized each bond is, because of the electronegativity difference”.
Student #14: “The color difference shows bond polarity, that is, [an] electronegativity difference between the two atoms of the
molecule. The more electronegative the atom is (Cl > Br > I), the more red is the color of the atom that is joined to H”.
Structures with a chemical bond polarity
Part D.2c asked which of the structures given in maps (c), (d) and (e) show polarity in a chemical bond. Nine
students achieved a 100% and 2/3 of the students included in their answer an essentially ionic structure for
LiH, which is encouraging, leading to a satisfactory performance (mean mark = 73.2%):
Student #12: “In maps (c), the water molecule is a polar chemical bond because oxygen attracts electrons toward it. In maps (d),
HCl shows the largest polarity, and then follow HBr and HI, with much smaller (nearly zero) polarity. In map (e), LiH is a polar
chemical bond”.
Student #8: “maps (c): H2O; maps (d): HCl, HBr (slightly), HI (almost not); map (e): LiH”.
On the other hand, apparently or implicitly, some students assumed that the LiH bond was nonpolar (Students #3,
25, 28 and 30). “In LiH we cannot talk about (bond) polarity” (Students #28 and 30). This is a known misconception:
“Polarity occurs only in covalent bonds but not in ionic bonds” (Tsaparlis et al., 2018). One student (#3) did not
include HCl among the polar bonds because (s)he assumed that it was ionic. Actually, several students assumed HCl
to be ionic as was found from their responses to part D.2d: # 3, 4, 12, and 16 (for #3 and #4, “it is clearly ionic”).
Hydrogen chloride is of course encountered by students as a strong acid, in its ionized form as an aqueous solution,
and this seems likely to contribute to the above misconception. However, we have also observed an unfortunate
side-effect of the colored representations that appeared to confuse several students: the intense/“thick” blue and red
colors were taken as an indication of ionic bonding. This was the case more often with HCl (as compared to HBr and
HI) but was also found with H2O in some cases. The responses of students #23 and #25 were particularly notable:G. Tsaparlis et al.: Using electrostatic potential maps as visual representations 15
“In maps (c), the continuity among bonds is apparent, because the form on the left (H2) shows the covalent bond, while the
form on the right (H2O) (shows) two ionic bonds” (#23).
“Maps (c) show continuity between covalent and ionic bond because on the basis of the [shown] polarity scale it passes
through both stages in the formation of H2O” (#25).
What appears to have happened in these cases is that students have naively adopted the ionic-covalent bond
dichotomy and failed to appreciate the difference between highly polar covalent and ionic bonding.
The covalent-ionic bond continuity
As we reported earlier, part D.2d which dealt with the continuity between covalent and ionic bonds, had the
lowest mean mark (46.3%) among all five parts of question D.2. A complete answer involves both the third
(multi-structural) and fourth (relational) dimensions of the SOLO taxonomy. It is noticeable that performance
in this question was similar to that for D.2a (47.9%), the only other question requiring the relational level. Four
students did not answer the question at all, one merely referred to “map (e)”, while a number of others
provided only irrelevant explanations at the pre-structural SOLO level:
Student #6: “Map (e), because none atom dominates, but the charges are different”.
Student #14: “In maps (c), the structures show the difference between ionic and covalent bond, because H2 does not show
polarity (same color everywhere), while in H2O a difference in color appears, therefore it is a polarized molecule, that is, it forms
a covalent bond”.
A serious problem reflected in several students’ responses to this question (which we referred to earlier) was that
of misinterpreting the characteristic contrast between the blue and red colors as an indication of ionic bonding.
This could also be a consequence of the fact that most students did not appear to pay attention to the change in
size upon formation of ions and use this as a feature of ionic bonding. It is true that maps (d) alone do demonstrate
the change of bond polarity on moving from HCl to HI, and these maps were used by most of the students, but map
(e) (with the more polar LiH) and maps (c) (with H2 and H2O) provide further support, so a complete answer should
employ all maps (c), (d) and (e). We quote below two good answers employing only maps (d):
Student #24: “It [the continuity of bond type] is demonstrated in maps (d) because from the left to the right the difference in
electronegativity appears to lessen, and eventually it appears that the electrons appear to be shared equally”.
Student #30: “Maps (d) shows the continuity between ionic and covalent bond because it is evident that the difference in
electrochemical potential decides the bond”.
Some students did employ all three sets of maps (four students) or two of these sets (c) and (d) or (d) and (e)
(another three students). The best response and another interesting one are reproduced below:
Student #27: “The structures that demonstrate the continuity between ionic and covalent bond are those of LiH, HCl, HBr, HI,
H2O, because [starting] from LiH where we have very strong charges (the red and blue colors dominate), we move to H2O where
it [the blue vs. the red coloring] starts diminishing and we arrive at HI, where we have mainly green color in the ends and in the
middle. Therefore we do not have polarity as large as in the previous [cases]”.
Student #11: “The continuity between ionic and covalent bond is evident in maps (c), (d) and (e) because of the alternation of
colors – appearance of blue-green-red – and as shown in the (color) scale, this change of color explains the above
[observations].
Contribution of the colored visual representations to understanding
Part D.2e asked students to refer to two features of the colored VRs that helped them to understand chemical
bonding and a mean mark of 82.7% was obtained on this part. Sixteen students’ responses were awarded16 G. Tsaparlis et al.: Using electrostatic potential maps as visual representations
100%, and satisfactory answers were submitted by many other students. The few poor answers made reference
to only one feature. On the other hand, placing a limit of two features probably restricted the students from
referring to the many issues associated with these VRs. Features reported included the extent of polarization of
the bonds, the evidence for electronegativity differences, the type of bond formed, the size of atoms/ions and/
or the size and form of molecules. There were both short and lengthier good responses:
Student #25: “It helps us deduce the type of bonding, as well as how polarity changes within the molecule”.
Student #8: “(1) The electronegativity of each element (and) consequently the polarity of its bonds. (2) The shape of the electron
density in a compound”.
Student #27: “One feature is the existence of ionic, polar covalent and nonpolar covalent bond, [as deduced] from the color
scale which shows … the polarity of the bond. Also we realize which atom has the negative and which has the positive charge
in the compound”.
Question D.3: an application – visual representations of organic molecules
Question D.3 presented students with colored VRs for two organic molecules which have similar structures,
CH3Cl and CH3Li,3 (see Figure 3) and asked for the identification with justification of the two VRs (which
belongs to which molecule). The mean mark was 55.0%. A complete answer should involve not only bond
polarities (on the basis of the colorings) but also a comparison between the larger electron cloud of Cl [in
structure (a)] as compared to that of Li [in structure (b)]. The following is a good attempt to use both bond
polarities and atomic sizes, however, it also refers to Li+ and to an ionic bond in CH3Li:4
Student #9: “Cl has larger size than Li, and this follows from how the charge is distributed around the molecule. Also the bond
[in CH3Cl] will be covalent, and therefore it will have a smaller polarity. In [the case of] CH3Li the bond will be ionic and this
follows from the polarity of bond, but also by the fact that Li+, which has a smaller size in comparison to C or to Cl because it has
lost one electron”.
Bond polarities in the C–Cl and C–Li bonds respectively, with Cl being electronegative and Li electropositive,
as judged from the coloring, were used as a criterion for the explanation, for 17 out of the 31 students. An
example:
Student #2: “Structure (a) corresponds to compound CH3Cl. Cl is more electronegative than C, so when they are bonded
between themselves, the fraction of negative charge shifts toward Cl, so it acquires a red color in the above representation”
[And similarly for structure (b)].
Question D.4: features and comparisons of various visual representations
Question D.4 asked for a comparison between the VRs for the hydrogen molecule and the water molecule that
students had drawn when answering question (1) and the corresponding colored quantum mechanical VRs. In
particular, the features and the advantages of the two visual representations were required. Although six
students did not answer this question at all, many students provided more or less extensive answers, covering
various aspects and views. Many students were supportive of the quantum mechanical colored VRs, although
3 Chloromethane (CH3Cl), also called monochloromethane and methyl chloride, is a colorless, odorless, flammable gas, soluble in
water. Methyllithium is the simplest organolithium reagent with the empirical formula CH3Li. It is a highly reactive compound,
and, because it is highly reactive toward water, it is used as a solution in ethers.
4 CH3Li can be thought of as being source for the CH3− ion: CH3Li ⇋ CH3− + Li+ (with CH3− being the conjugate base of the very weak
acid CH4 (Ka = 1 × 10−49), so CH3− is the strongest base (Kb = 1 × 1035).G. Tsaparlis et al.: Using electrostatic potential maps as visual representations 17
several realized that they have limitations and are just complementary to the traditional VRs. Some students
suggested that they are likely to be more suitable for older students and one student even suggested that they
were inferior to the traditional ones:
Student #27: “In VRs [of question 1] we have the elements represented with symbols, and these are more understandable, and
also they show better the elements that combine. Also, in these VRs, there is the possibility to represent electrons symbolically
around the atoms, and this makes the concept of bond and electron sharing more understandable. Finally, from these VRs we
obtain information about the orbitals and the geometry of the molecules (e.g. the angles). On the contrary, in the case of the
maps of Figure 2, we have the electron density and [bond] polarity by means of a color scale. This facilitates understanding
about which bond is polar or not, which atom has positive or negative charge in the bond, as well as how this charge is
distributed along the bond”.
Student #9: “The simple VRs [of question 1] help simply in understanding of the bond in the molecule, [but] they don’t show
clearly the nature of the bond, its type or its polarity. … [On the other hand], the quantum mechanical, color representations
offer more information about the bond that is formed, the size of the participating atoms, as well as how polar in this bond”.
Student #28: “In maps (c), the VRs are better because they include color, the H2 molecule appears in color in the form of a
flattened sack. In [the case of] H2O, we have color that shows that it has a dipole moment, since the red [color] is on the side of
oxygen and the blue on the side of hydrogen …”
Student #8. “It is better to use the color structures when teaching elder students, who have already understood concepts such
as chemical bonds, charge, electronegativity of the elements, because while [these] demonstrate very well polarity, bond
strength, [and] electron cloud, they do not show clearly the existence of electrons, the existence of bonds, and the presence of
individual elements. On the contrary, the structures of question 1 make very distinctively apparent the existence of bonds and
of elements [(s)he means atoms], the electrons of each element, and the electrons that participate in each bond. However, they
do not show the difference in electronegativity, bond polarity, [or] the electron cloud. In conclusion, there is not a single
representation which is better than another – we just consider which one is suitable for its purpose.
Student #31: “The [various] VRs present [various] advantages. Concerning the representations of question 1, they show the
elements which form the compound, the bonds that connect them, the ‘free’ [non-bonded] electrons, their geometry in space.
On the other hand, the color representations show the type of bond, [bond] polarity, the difference in electronegativity … In my
opinion, the representations of question 1 show more information about a chemical compound and many details …”
Conclusions and implications
At the outset, we should point out that chemistry teaching in Greek secondary schools has traditionally been
carried out with the aid of the chalkboard and textbooks, with particular attention being paid to the symbolic
level of chemistry (writing molecular and structural formulas and chemical equations) and to solving
computational exercises. Greek students’ experience of physical models of atoms and molecules tends to be
limited to the pictures in their secondary-school textbooks, as no attention tends to be paid to them during the
teaching. Note also that the chemical knowledge of these students was still immature, as they were just
freshman students (at the end of their first year at university), so their responses should be judged taking this
limitation into account. Let us first consider the answers to the individual subsidiary research questions posed
in this study:
(RQ1): To what degree did the provided VRs help the students to deduce the type of bonding in various molecules?
The situation regarding nonpolar and polar covalent bonding appears encouraging. Part D.2c, which asked
which of the structures of maps (c), (d) and (e) in Figure 2 show a chemical bond polarity, got a relatively high
mean mark (73.2%). Consideration of LiH (part D.2a), however, where bonding starts to approach ionic caused
difficulties (mean mark: 47.9%): only four students, plus another who was very close, provided complete or
nearly complete multi-structural and relational explanations, which included mention of both the plus and
minus polarities and the relative sizes of the two ions.You can also read