Clean Water Fund Performance Report - A report of Clean Water Funds invested, actions taken, and outcomes achieved - Minnesota Pollution ...
←
→
Page content transcription
If your browser does not render page correctly, please read the page content below

Clean Water Fund
Performance Report
A report of Clean Water Funds invested, actions taken,
and outcomes achieved

2022                                                     lrp-f-1sy22

January 2022
More information about the measures summarized in this publication can be found on
the Minnesota’s Legacy website at www.legacy.leg.mn/funds/clean-water-fund.
Project Team: Kim Laing (MPCA), Matt Drewitz (BWSR), Diana Ditsch (MDH), Bill Dunn
(MPCA), Tannie Eshenaur (MDH), Mary Juhl (BWSR), David L. Miller (MPCA), Alycia
Overbo (MDH), Paul Putzier (DNR), Emily Resseger (MCES), Lanya Ross (MCES), Jen
Schaust (MDA), Margaret Wagner (MDA), Brad Wozney (BWSR)
Clean Water Fund Interagency Coordination Team: Angie Becker Kudelka (BWSR),
Chris Elvrum (MDH), Jeff Freeman (PFA), Katrina Kessler (MPCA), Sam Paske (Met
Council), Whitney Place (MDA), Jess Richards (MDNR)
Editing: Cathy Malakowski (MPCA), Matt Croaston (MPCA)
Designer: Scott Andre (MPCA)
This publication can be made available in other formats, including Braille, large type, computer
disk or audio tape, upon request.
Minnesota Pollution Control Agency Minnesota Department of Natural Resources Minnesota Department of Agriculture
Minnesota Department of Health Minnesota Board of Soil and Water Resources Minnesota Public Facilities Authority
2022 Clean Water Fund Performance Report | www.legacy.leg.mn
Table of contents

 Protecting and restoring Minnesota’s waters for                                                         Drinking water & groundwater measures .  .  .  .  .  . 37
 generations to come .  .  .  .  .  .  .  .  .  .  .  .  .  .  .  .  .  .  .  .  .  .  .  .  .  .  . 1
                                                                                                         Source water protection plans & implementation. .  38
 Minnesota’s Clean Water Mission and Goals .  .  .  . 2                                                  Source water protection grants. . . . . . . . . . . . . . . . . . . 40

 2022 Clean Water Fund Report Card. .  .  .  .  .  .  .  .  .  .  .  . 4                                 Nitrate monitoring & reduction by local partners. . 42
                                                                                                         Contaminants of emerging concern. . . . . . . . . . . . . . 45
 Investment measures .  .  .  .  .  .  .  .  .  .  .  .  .  .  .  .  .  .  .  .  .  .  .  .  .  . 7
                                                                                                         County atlases. . . . . . . . . . . . . . . . . . . . . . . . . . . . . . . . . . . 47
 Total dollars appropriated. . . . . . . . . . . . . . . . . . . . . . . . . 8
                                                                                                         Long-term monitoring network wells. . . . . . . . . . . . . 50
 Total dollars invested by watershed/statewide. . . . 10
                                                                                                         Unused groundwater wells sealed. . . . . . . . . . . . . . . . 52
 Total dollars awarded . . . . . . . . . . . . . . . . . . . . . . . . . . . . 12
                                                                                                         Land use in Drinking Water Supply
 Dollars leveraged. . . . . . . . . . . . . . . . . . . . . . . . . . . . . . . . 13                     Management Areas. . . . . . . . . . . . . . . . . . . . . . . . . . . . . . 54
 Surface water quality measures. .  .  .  .  .  .  .  .  .  .  .  .  .  .  . 14                          Groundwater quality. . . . . . . . . . . . . . . . . . . . . . . . . . . . . 56
 Major watersheds monitored. . . . . . . . . . . . . . . . . . . . . 15                                  Source water quality for community
                                                                                                         water systems . . . . . . . . . . . . . . . . . . . . . . . . . . . . . . . . . . . 60
 Watersheds monitored by local partners. . . . . . . . . . 17
                                                                                                         Nitrate and arsenic concentrations in new wells. . . 62
 Nonpoint source BMP implementation . . . . . . . . . . . 19
                                                                                                         Groundwater levels. . . . . . . . . . . . . . . . . . . . . . . . . . . . . . 65
 Municipal infrastructure project implementation. 21
                                                                                                         Water efficiency. . . . . . . . . . . . . . . . . . . . . . . . . . . . . . . . . . 68
 Surface water health. . . . . . . . . . . . . . . . . . . . . . . . . . . . . 23
 Lake and stream water quality. . . . . . . . . . . . . . . . . . . . 26                                 Social measures and external drivers. .  .  .  .  .  .  .  .  .  . 70

 Waters restored. . . . . . . . . . . . . . . . . . . . . . . . . . . . . . . . . . 30                   Social measures. . . . . . . . . . . . . . . . . . . . . . . . . . . . . . . . . . 71

 Mercury trends . . . . . . . . . . . . . . . . . . . . . . . . . . . . . . . . . . 32                   External drivers . . . . . . . . . . . . . . . . . . . . . . . . . . . . . . . . . . 75

 Municipal wastewater phosphorus trend . . . . . . . . . 35

2022 Clean Water Fund Performance Report | www.legacy.leg.mn
Protecting and restoring Minnesota’s waters for generations to come

Investing in clean water is money well spent. Minnesota           •   Upgraded 48 municipal wastewater
voters clearly delivered this message when they                       treatment facilities, which reduced
overwhelmingly passed the Clean Water, Land and                       phosphorus discharges by over 268,000
Legacy Amendment in 2008. The amendment provides                      pounds per year.
25 years of dedicated funding to strengthen and enhance           •   Delineated Drinking Water Supply
Minnesota’s response to water resource challenges and                 Management Areas for all 500 vulnerable
to protect high-quality waters. The Clean Water Fund                  municipal water systems to protect their
creates opportunities for Minnesota to take innovative                drinking water sources.
and collaborative approaches to improve water quality
statewide.                                                        •   Engaged over 6,500 visitors in the We Are
                                                                      Water MN exhibit, and of those surveyed, 94%
Clean water management requires a systematic approach                 indicated that they learned something new
to address issues related to surface water, groundwater,              about our water resources.
drinking water, habitat, recreation, and more. Minnesota
                                                             Fund administrators faced unique challenges in
has adopted a watershed-based management approach
                                                             2020 and 2021. The COVID-19 pandemic made it
that promotes increased collaboration and a common
                                                             necessary for state agencies and their local partners to
vision for planning and implementation activities. This
                                                             adjust programming, implementation, and outreach
approach is not limited by county or other jurisdictional
                                                             strategies. Many state employees were assigned new
boundaries. Partnerships between state agencies, local
                                                             job responsibilities to support Minnesota’s public
governments, and other stakeholders play a key role in
                                                             health response to the COVID-19 pandemic, which
successful resource management as they prioritize, target,
                                                             took priority over regular projects and activities. In-
and measure Clean Water Fund activities.
                                                             person learning and networking opportunities moved
Between 2010 and 2021, Minnesota’s Clean Water Fund:         from conference rooms to webinars. For example, the
                                                             Clean Water Fund-backed We Are Water MN travelling
     •   Awarded more than 3,631 grants to protect and
                                                             exhibit — which examines water issues throughout
         restore Minnesota’s water resources.
                                                             Minnesota via personal stories, histories, and scientific
     •   Delisted 66 lakes and streams from Minnesota’s      information —created virtual and outdoor versions
         impaired waters list.                               of the exhibit and offered online interactive speaker
     •   Issued more than 2,087 loans to prevent             series and events. These creative adaptations show that
         nonpoint source water pollution or solve existing   Clean Water Fund activities remained strong despite an
         water quality problems.                             unexpected transition to a largely digital world.
     •   Secured more than 778 easements that will           We know attaining our clean water goals is a
         permanently protect approximately 17,034 acres      marathon, not a sprint, and it will take more than the
         along riparian corridors and within wellhead        Clean Water Fund alone to address all water-related
         protection areas.                                   challenges across the state. We can make a difference
     •   Repaired 788 imminent health threat subsurface      by collaborating, innovating, and leveraging resources
         sewage treatment systems.                           beyond the Clean Water Fund to support lasting
                                                             impacts.

2022 Clean Water Fund Performance Report | www.legacy.leg.mn                                                       1
Minnesota’s Clean Water mission and goals
The Clean Water Council developed the mission, goals, and objectives with stakeholder involvement in an effort to
align activities implemented with Clean Water Fund dollars to the Clean Water Legacy Act. For the 2020 Performance
Report, we began to better align measures with the mission, goals, and objectives the Clean Water Council developed
(shown below).
Mission
Protect and restore Minnesota’s waters for generations to come.

Goals and objectives

                     Drinking water is safe for everyone, everywhere in Minnesota
                       •   Protect public water supplies
                       •   Ensure private well users have safe water
                     Groundwater is clean and available
                       •   Improve and protect groundwater quality
                       •   Ensure sustainable long-term trends in aquifer levels
                       •   Avoid adverse impacts to surface water features due to groundwater use
                     Surface waters are swimmable and fishable
                       •   Prevent and reduce pollution of surface waters
                       •   Maintain and improve the health of aquatic ecosystems
                       •   Protect and restore hydrologic systems
                     Minnesotans value water and take actions to sustain and protect it
                       •   Build capacity of local communities to protect and sustain water resources
                       •   Encourage systems and approaches that support, protect, and improve water
                       •   Provide education and outreach to inform Minnesotans’ water choices
                       •   Encourage citizen and community engagement on water issues

About this report
This report provides a high-level overview of Minnesota’s performance so far in restoring and protecting the quality of
the state’s surface water, groundwater and drinking water resources using Clean Water Fund dollars. Published every
two years, the report highlights:
    •   Action measures to track where agency and partner activities are occurring with Clean Water Fund dollars to
        protect surface, groundwater, and drinking water, including how effectively agencies are completing the work
        to achieve clean water goals.

2                                                2022 Clean Water Fund Performance Report | www.legacy.leg.mn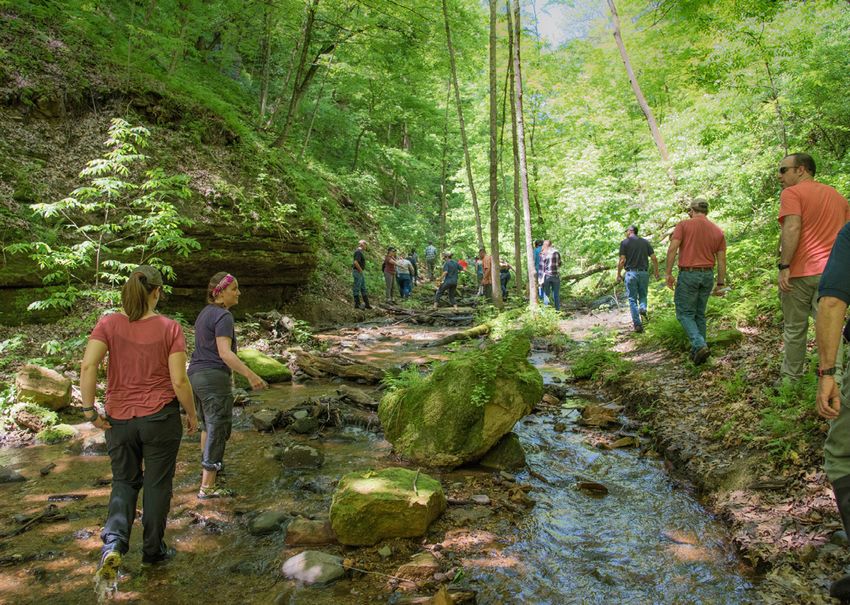
•   Investment measures to track where Clean Water Fund money is spent and how spending patterns are changing,
       including tracking where other funds are leveraged to extend the work done to meet clean water goals.
   •   Outcome measures to track progress on improving the quality of our surface, groundwater, and drinking water.

The report is not a complete assessment of all work achieved with Clean Water Legacy funds, either at the state or
local level, but shows key activities that represent the overall Clean Water Fund investment. All of the water agencies
have other performance measures, but the measures included in this report are chosen to represent progress over the
25 years of the amendment and concerns known to be of public interest.

Report organization
Measure profiles provide a snapshot of how Clean Water Fund dollars are being spent and what progress has been
made. These profiles are organized into three sections: investment measures, surface water quality measures, and
drinking and groundwater protection measures. The report displays how spending and progress are occurring across
Minnesota, to the extent that statewide data are available. Each measure profile includes the following:

The measures used in this report are designed to remain constant over time to make it easy to identify where change
is occurring. However, at times, measures may need to be modified as our scientific knowledge expands and new,
more effective approaches are developed. The procedures used to produce the measures in this report and how they
have changed over time, are documented in a separate metadata document available on the Legacy website. ,

              Figure 1. Each measure profile includes measure type, measure narrative, a graphic, and a qualitative score.

2022 Clean Water Fund Performance Report | www.legacy.leg.mn                                                                 3
2022 Clean Water Fund Report Card

Minnesotans care deeply about the state’s natural resources and cultural heritage. In 2008, we voted to increase our
sales tax and pass the Clean Water, Land and Legacy Amendment, providing 25 years of constitutionally dedicated
funding for clean water, habitat, parks and trails, and the arts.
The following report card highlights work done using Clean Water, Land and Legacy Amendment dollars for
Minnesota’s many water resources. The Report Card tracks a suite of performance measures that are described in the
full report that follows. It provides a qualitative assessment of how well actions are being implemented and what
outcomes are being achieved.
Measures are scored according to their status as of the end of fiscal year 2021 (FY21) and for their trend over time.
Scores were developed using data-informed professional judgment of agency technical staff and managers. The
legend shows the symbols used to describe how measures were scored.

                 Action status legend                                       Outcome status legend                                                      Trend legend
    Symbol                        Meaning                          Symbol                        Meaning                                   Symbol                  Meaning
                       We are making good progress/                               Water quality is high – we are on track to
                                                                                                                                                          Improving trend
                       meeting the target                                         meet long-term water resource needs and
                                                                                  citizen expectations
                       We anticipate difficulty; it is                                                                                                    No change
                       too early to assess; or there                              Water quality needs improvement or it is
                                                                                  too early to assess – it is unclear if we will
                       is too much variability across                                                                                                     Declining trend
                                                                                  meet long-term water resource needs and
                       regions to assess                                          citizen expectations; and/or water quality
                       Progress is slow/we are                                    varies greatly between regions                                          Not enough information to
                       not meeting the target; or                                 Water quality is under intense pressure –
                                                                                                                                               NEI        determine trend at this time
                       the activity or target is not                              long-term water resource needs and/or
                       commensurate with the scope                                citizen expectations exceed current efforts
                       of the problems                                            to meet them

                                                                      Investment measures
                        Measure                                        Status                                 Trend                                  Description
              Total Clean Water Fund dollars       $1.2B has been appropriated to the Clean Water        FY 16-17: $228M           For FY10-21, all 80 watersheds benefited from Clean Water
              appropriated by activity             Fund from FY10-21, ranging from $157M in FY           FY 18-19: $212M           Fund supported activities. Implementation activities
                                                   10-11 to $261M in FY 20-21.                           FY 20-21:$261M            comprise the largest portion of spending in watersheds
                                                                                                         FY 22-23: $257M           statewide.
              Total Clean Water Fund dollars per   All watersheds in the state are benefiting from                                 For FY10-19, all 80 watersheds benefited from Clean Water
INVESTMENTS

              watershed or statewide by activity   local and statewide projects.                                                   Fund supported activities. Implementation activities
                                                                                                                                   comprise the largest portion of spending in watersheds
                                                                                                                                   statewide.
              Total Clean Water Fund dollars     $625M was awarded in grants and contracts to                                      About 83% of grant and contract awards are for
              awarded in grants and contracts to non-state agency partners in FY10-21.                                             implementation activities; 42% of total FY10-21
              non-state agency partners                                                                                            appropriations were awarded to non-state agency
                                                                                                                                   partners.
              Total dollars leveraged by Clean     $492M was leveraged by Clean Water Funds in                                     Required Clean Water match funds were exceeded.
              Water Fund                           FY10-21, or $1.09 for every implementation dollar
                                                   invested.

4                                                                            2022 Clean Water Fund Performance Report | www.legacy.leg.mn
Surface Water Measures
                             Measure                              Status Trend                                          Description
          Percent of monitoring addressing state & local                         Nearly 40% of watersheds met goals for addressing state and local needs for monitoring.
          needs                                                                  Ongoing program development is aimed to ensure local needs are identified for monitoring.
ACTION

          Local partner participation in monitoring efforts                      As of 2021, all programs are meeting participatory goals.

          Number of nonpoint source best management                              Although funding has increased and there is a continued increase in practices and projects
          practices implemented with Clean Water Funding                         being implemented, the total request for projects has remained significantly greater than
          and estimated pollutant load reductions                                available funds.
          Number of municipal point source construction                          Pace of awards is linked to permit cycles, compliance schedules, and available Clean Water
          projects implemented with Clean Water Funding                          Funds. Applications exceed currently available funds even after significant infusion of bond
          and estimated pollutant load reductions                                funds over the past several cycles.
                             Measure                              Status Trend                                         Description
          Rate of impairment/unimpairment of surface
                                                                                 Water quality varies greatly by region. In general, good water quality remains where land is
          water statewide and by watershed: Stream aquatic                NEI
                                                                                 intact; where considerable alteration has occurred, water quality is poor.
          life
          Rate of impairment/unimpairment of surface
                                                                                 Water quality varies greatly by region. In general, good water quality remains where land is
          water statewide and by watershed: Stream                        NEI
                                                                                 intact; where considerable alteration has occurred, water quality is poor.
          swimming
          Rate of impairment/unimpairment of surface
                                                                                 Water quality varies greatly by region. In general, good water quality remains where land is
          water statewide and by watershed: Lake                          NEI
                                                                                 intact; where considerable alteration has occurred, water quality is poor.
          swimming
          Changes over time in key water quality parameters
                                                                          NEI    There are improving trends in lake water clarity in more lakes than not.
          for lakes and streams: Lake clarity
          Changes over time in key water quality parameters
                                                                          NEI    There are more improving trends than declining trends in total suspended solids.
          for lakes and streams: Sediment in large rivers
OUTCOME

          Changes over time in key water quality parameters
                                                                                 Nitrate concentrations are increasing in major rivers.
          for lakes and streams: Nitrate in large rivers
          Changes over time in key water quality parameters
                                                                          NEI    There are more improving trends than declining trends in phosphorus.
          for lakes and streams: Phosphorus in large rivers
                                                                                 Detections in streams vary greatly as a result of hydrologic and agronomic conditions;
          Changes over time in key water quality parameters
                                                                                 exceedances of pesticide water quality standards are rare. Some “surface water pesticides of
          for lakes and streams: Pesticides in streams
                                                                                 concern” are showing increasing detection frequency and concentrations.
          Changes over time in key water quality parameters                      With the exception of detecting chlorpyrifos in two lakes, pesticide detections have been low
          for lakes and streams: Pesticides in lakes                             relative to water quality reference values and generally stable since 2007.
          Changes over time in key water quality parameters
                                                                                 Concentrations are increasing in almost all metro area rivers and streams.
          for lakes and streams: Chloride in streams and rivers
          Number of previous impairments now meeting                             Although many projects are making progress in improving water quality, more waterbodies
          water quality standards due to corrective actions                      are being listed as impaired relative to the slower rate of waterbodies being restored.
                                                                                 Mercury in game fish is not yet responding to decreases in local mercury emissions, although
                                                                                 these reductions likely have prevented a steeper upward trend. Global emissions have
          Mercury in fish                                                        increased. The time lag between emission reductions and response is likely several decades.
                                                                                 It is too soon to see a measurable response in fish mercury levels. Long-term and consistent
                                                                                 monitoring is necessary to track changes in fish tissue.
                                                                                 Significant progress has been made reducing mercury emissions from power plants.
                                                                                 Emissions from mercury use in various products saw a decrease for the 2020 emission
          Mercury emissions                                                      inventory. Conversely, emission from the mining sector have remained relatively steady since
                                                                                 2017. To meet our 2025 emissions goal, significant reduction of mercury emission from the
                                                                                 mining sector and further reduction of mercury use in various products will be necessary.
                                                                                 Significant phosphorus load reductions have been achieved through regulatory policy,
          Municipal wastewater phosphorus discharge trend
                                                                                 infrastructure investments, improved technology, and optimization of operations.

2022 Clean Water Fund Performance Report | www.legacy.leg.mn                                                                                                                    5
Drinking water and groundwater measures
Measure Status Trend Description
Number of community water supplies assisted with On track to meet goal of protecting all vulnerable systems under Source Water Protection Plans
developing source water protection plans by 2020.
Number of grants awarded for source water protection Increasing funds accelerate implementation of proven strategies for source water protection.
Number of local government partners participating in New partnerships continue to be established for nitrate-nitrogen monitoring and reduction
groundwater nitrate-nitrogen monitoring and reduction activities.
activities
Number of new health-based guidance values for Did not meet target for FY 18-19. On track to meet goal of 10 guidance values developed next
contaminants of emerging concern biennium.
County atlases (including the geologic & groundwater atlases) are being completed at the
ACTION
Number of counties completing a county geologic atlas planned rate, and counties continue to step up to participate. With continued and consistent
for groundwater sustainability funding, completion of geologic atlases for all counties is expected around 2035, and completion
of groundwater atlases for all counties around 2040.
Number of long-term groundwater monitoring network Many areas of the state still lack important groundwater information. Long-term ramp up in
wells monitoring accelerated by Clean Water Fund investments is filling gaps.
FY18 funding was awarded to seven public water-suppliers to assist in sealing 17 unused wells.
Number of unused groundwater wells sealed FY 19 funding was awarded to nine local government units to assist in sealing over 300 private
unused wells.
Land use in Drinking Water Supply Management Areas There is increasing research, engagement and activity to protect vulnerable areas in DWSMAs.
Measure Status Description
Changes over time in pesticides, nitrate-nitrogen, and Variable trends for five common pesticides indicate a mixed signal. Low levels are frequently
other key water quality parameters in groundwater: detected in vulnerable groundwater.
Pesticides
Changes over time in pesticides, nitrate-nitrogen, and In many agricultural areas, drinking water supplies are not vulnerable to surficial contamination
other key water quality parameters in groundwater: NEI and most wells have low levels of nitrate-nitrogen. However, in vulnerable groundwater areas
Nitrate-nitrogen statewide (the southeast, Central Sands and southwest), nitrate contamination is a significant concern.
Changes over time in pesticides, nitrate-nitrogen, and In areas where groundwater is vulnerable, nitrate levels can be high. Of the 21 vulnerable
other water quality parameters in groundwater: Nitrate- NEI townships tested in southwest Minnesota (2013-2018), 100% of them were determined to have
nitrogen southwest region 10% or more of the wells over the nitrate-nitrogen 10 mg/L standard.
Changes over time in pesticides, nitrate-nitrogen, and Trend data from the Central Sands Private Well Network shows a slight downward trend in the
other key water quality parameters in groundwater: 90th percentile . However, township testing data show a high level of nitrate in some vulnerable
Nitrate-nitrogen Central Sands aquifers in the Central Sands.
OUTCOME
Changes over time in pesticides, nitrate-nitrogen, and Trend data from the Southeast Minnesota Volunteer Nitrate Monitoring Network shows no
other key water quality parameters in groundwater: change. However, township testing data show a high level of nitrate in some vulnerable areas in
Nitrate-nitrogen southeast region southeast Minnesota.
Changes over time in source water quality used for NEI Identifying correlations between drinking water contaminants is a significant step in trend
community water supplies analysis of source water quality.
Since 1992, there has been a general increase in the percent of new wells that have nitrate levels
Nitrate concentrations in newly constructed wells above the drinking water standard.
The percentage of wells with arsenic above the drinking water standard has remained steady
Arsenic concentrations in newly constructed wells over the past 10 years. Evaluation of ways to reduce this percentage is ongoing and may take
years before significant progress is made.
Most observation wells show no signficant change or an upward trend; many areas of the state
Changes over time in groundwater levels lack important groundwater information while some areas experience declines.
There has been a slight improvement in water efficiency in recent years, although continued
Changes over time in total and per capita water use tracking is needed to determine the amount of impact from annual difference in weather versus
changes in management.
Social measures and external drivers
Measure Status Trend Description
DRIVERS
In recent years, state agencies have developed and piloted the Social Measures Monitoring System — integrating social science
Social measures NEI
into Clean Water Fund projects.
The external drivers identified continue to alter land-water interactions across Minnesota, impacting how Clean Water Funds need
External drivers
to be invested.
6 2022 Clean Water Fund Performance Report | www.legacy.leg.mn
Investment measures

The following four measures illustrate FY 10-21 Clean Water Fund investments to restore and protect surface water
and drinking water.

Investments
  1. Total dollars appropriated

  2. Total dollars invested by watershed or statewide

  3. Total dollars awarded

  4. Dollars leveraged

2022 Clean Water Fund Performance Report | www.legacy.leg.mn                                                        7
Total dollars appropriated
                INVESTMENT
                Measure: Total Clean Water Fund dollars appropriated by activity

Why is this measure important?                              What progress has been made?
This measure illustrates the overall amount of Clean        Voter approval of the Clean Water, Land and Legacy
Water Funds allocated in a particular biennium and          Amendment increased the sales and use tax rate by
provides a breakdown of that funding in specific            three-eighths of one percent on taxable sales, starting
categories to demonstrate spending over time. It is the     July 1, 2009, through 2034. Of those funds, 33% were
first of four financial measures, providing context for     dedicated to the Clean Water Fund.
the others. It is the primary investment that enables
                                                            This totals $1.5 billion since the inception of the Clean
resources to be spent on the actions that will ultimately
                                                            Water Fund. Figure 2 to the right shows the dollars
help achieve outcomes.
                                                            appropriated by biennium for all funding source
                                                            categories. Figure 3 shows how that was appropriated by
What are we doing?
                                                            specific categories.
State agencies, local government and non-profit
organizations are spending Clean Water Funds on             Learn more
thousands of projects to protect and restore the state’s
                                                            Clean Water Fund
surface water, groundwater, and drinking water.
                                                            www.legacy.leg.mn/funds/clean-water-fund
Project categories include water quality monitoring
and assessment, watershed restoration and protection
strategies, protection and restoration implementation
activities, drinking water protection activities, and
applied research.

8                                               2022 Clean Water Fund Performance Report | www.legacy.leg.mn
Status
FY 10-11: $157.2M
FY 12-13: $185.4M
FY 14-15: $197.4M
FY 16-17: $228.3M
FY 18-19: $211.8M
FY 20-21: $261.0M
FY 22-23: $257.0M
Description
Appropriation levels will vary
by biennium due to changes
in sales tax revenue. FY10-21
funds have been allocated,
while FY 22-23 allocations are
Figure 2. Total dollars appropriated by biennium in progress.
Figure 3. Clean Water Fund appropriations by category
2022 Clean Water Fund Performance Report | www.legacy.leg.mn 9Total dollars invested by watershed or statewide
INVESTMENT
Measure: Total dollars invested per watershed or statewide for monitoring/assessment,
watershed restoration/protection strategies, protection/restoration
implementation activities, and drinking water protection
Why is this measure important? State agencies provide technical assistance and
Many Minnesotans want to know how much money administrative oversight for all these activities. They
from the Clean Water Fund is being invested in their include: Minnesota Board of Water and Soil Resources,
backyard. There is also Clean Water Fund work that has a Department of Natural Resources, Department of
statewide benefit. This measure tracks Clean Water Fund Agriculture, Department of Health, Metropolitan Council,
investments in each major watershed in the state, as well Pollution Control Agency, and Public Facilities Authority.
as investments on statewide activities that benefit all
What progress has been made?
watersheds. It shows how the funds are being allocated
geographically to support specific activities in four major A total of $529M in completed projects has been
activity categories: expended for all categories of funding tied directly
to specific watersheds and $303M connects back to
• Water quality monitoring/assessment statewide and regional efforts as a whole, for a total of
• Watershed restoration/protection strategy $832M for this measure.
development Needs by watershed are variable and depend on the
resources of concern, watershed size and complexity, and
• Restoration/protection implementation activities
the technical and administrative capacities of partners in
• Drinking water protection the watershed.
For Fiscal Years 2010-2021, Clean Water Fund allocations
What are we doing? to surface water and drinking water projects are
Thousands of Clean Water Fund-supported projects benefiting all 80 watersheds in Minnesota. As noted
led largely by local governments are completed and above, these activities are being implemented by local
underway across the state. Funded activities include: partners as well as state agencies.
• Implementation of practices to clean up Of the four activity categories, funding for
wastewater, stormwater, and agricultural runoff implementation activities comprised the largest
portion of spending statewide. However, the costs of
• Regular testing, assessment, and modeling of
implementation can vary significantly by watershed,
water quality in lakes and rivers to help gauge the
depending on the type of projects and the problems
effectiveness of clean water practices
being addressed.
• Strategy development and targeting of practices
to guide effective watershed restoration and Learn more
protection, as well as protection of drinking water
Clean Water Fund
and groundwater
www.legacy.leg.mn/funds/clean-water-fund
10 2022 Clean Water Fund Performance Report | www.legacy.leg.mn$50,000 to $1M Up Up to
to $1M $1M
$50,000 to $1M
$1M to $5M $1M
$1M to
to $5M $5M
$1M to $5M
$5M to $15M
$5M
$5M to
to $15M $15M $5M to $15M
$15M to $25M
$15M to $25M
$15M to $25M $15M
$25M to
to 46.5M $25M
$25M to $50M
$25M to $50M $25M to 46.5M
Figure 4. Combined funding for water quality Figure 5. Funding for implementation and drinking water
monitoring, watershed restoration and protection protection actions only
strategies (WRAPs) development, implementation, and
drinking water protection
FY 10-21 Clean Water Fund Dollars by Watershed
The map on the left (figure 4) includes all reported date, as there are several active grants and contracts
financial information by major watershed for with prior appropriations which results are not
the following actions: water quality monitoring, represented in figures 4 and 5. Smaller amounts
watershed restoration and protection strategies of funds have been expended in some northern
(WRAPs) development, implementation, and Minnesota watersheds where there is significant
drinking water protection. As illustrated in figure amount of protected public lands with relatively high-
5, the majority of the funds are going towards water quality. Also, a few watersheds in northwestern
implementation activities, which has been increasing Minnesota and along the Iowa border are very small in
over time. The map on the right shows a subset size and as an artifact of the mapping process appear
of the financial information that includes only to have received less funds, but are similar in funds per
implementation and drinking water protection unit area with adjoining watersheds.
actions. These maps represent projects and
supporting activities that have been completed to
2022 Clean Water Fund Performance Report | www.legacy.leg.mn 11Total dollars awarded
INVESTMENT
Measure: Total Clean Water Fund dollars awarded in grants and contracts to
non-state agency partners
Why is this measure important? Drinking Water Protection
This measure tracks the amount of Clean Water Funds Monitoring/Assesment
awarded in grants and contracts to external, non-state- Watershed Restoration/
Protection Strategies
agency partners to conduct a wide range of clean water
activities. The measure provides context on funding
distribution between state, federal, and local agencies to Restoration/Protection
perform Clean Water Fund-supported work. Implementation Activities
What are we doing?
Thousands of Clean Water Fund-supported projects, led
largely by local government units, are underway and being
Figure 6. The percentage of total grant and contract awards
implemented across the state. Non-state agency partners
($625 million) in FY 10-21 for each major Clean Water Fund-
include cities, counties, soil and water conservation districts,
supported activity. Allocations to implementation activities are
watershed management organizations, federal agencies, expected to stay steady or grow in future years as more projects
universities, non-profit organizations, and private consulting move from strategy.
firms working with local and state agencies.
Funded activities include implementation of practices to The balance of remaining appropriations is largely used
clean up wastewater, stormwater, and agricultural runoff. by state agencies to provide statewide monitoring,
They also include testing water quality to determine watershed protection and restoration strategy
the health of lakes and rivers, strategy development to development, technical assistance, conservation
guide effective watershed restoration and protection, easements with private landowners, and oversight on
and implementation of source water protection plans for Clean Water Fund-supported projects
drinking water. Groundwater monitoring is also funded
through Clean Water Fund dollars and is used to ensure Learn more
drinking water and groundwater protection. Clean Water Fund
For all actions taken by local government units and www.legacy.leg.mn/funds/clean-water-fund
other partners, state agencies provide monitoring
activities, development of watershed protection and Status Description
restoration strategies, as well as technical assistance and
administrative oversight. The agencies include Minnesota $625M was awarded in About 83% of grant and
Board of Water and Soil Resources, Department of Natural grants and contracts contract awards are for
Resources, Department of Agriculture, Department of to non-state agency implementation activities;
Health, Metropolitan Council, Pollution Control Agency, partners in FY10-21. 42% of total FY 10-21
and Public Facilities Authority. appropriations were awarded
to non-state agency partners.
What progress has been made?
As shown in the pie chart (figure 9), a total of $625 million
in Clean Water Funds were awarded to non-state agency
partners in FY 2010-21, with the largest share of that going
to protection and restoration implementation activities.
This represents 42% of the total $1.5B in Clean Water Fund
appropriations for those years.
12 2022 Clean Water Fund Performance Report | www.legacy.leg.mnDollars leveraged
INVESTMENT
Measure: Total dollars leveraged by Clean Water Fund implementation activities
Why is this measure important? being reported over time. During the first reporting cycle
This measure describes how many total dollars for this report (FY 10-11), the ratio of leveraged funds for
supplement the Clean Water Fund dollars invested in BWSR grant programs was much higher than it is today. In
projects in a given year. Throughout Minnesota, the addition, leveraged funding was further reduced by the
demand for funding to protect and restore the water elimination of the Clean Water Fund grant portion of the
resources far exceeds the available dollars. The ability MPCA’s Clean Water Partnership Program.
to use Clean Water Fund dollars to leverage local and
other funds means millions more dollars are available —
increasing the number of projects that are implemented
and making projects more cost effective for communities.
What are we doing?
Clean Water Fund grant programs fund actions to prevent
polluted runoff from fields, streets, lawns, roofs, and
other similar sources. They also fund improvements
to municipal wastewater and stormwater treatment.
Partnerships between state agencies, various local units
of government, and the federal government are critical to
implement these water quality improving activities.
Figure 7. Total dollars leveraged by Clean Water Fund
What progress has been made?
In FY 2018-19, changes to the Public Facility Authority
During Fiscal Years 2020 and 2021, more than $80
grant programs resulted in a significant increase in
million in state grants and loans was awarded to local
leveraged funds for the biennium. For FY 2020-21, MDA
governments (watershed management organizations,
updated its formula for calculating leverage from the
SWCDs, counties, etc.) for projects to reduce runoff
Agriculture BMP Loan Program and the Forever Green
from agricultural fields, streets, lawns, and other similar
Initiatives to more accurately report leveraged funds.
sources. Local match and leveraged federal funds
increased the project dollars available by $56 million.
Learn more
During Fiscal Years 2020 and 2021, more than $17.19 Clean Water Fund
million in state grants was awarded to improve municipal www.legacy.leg.mn/funds/clean-water-fund
treatment facilities and to help small communities invest
in new infrastructure. Local match and other funding
sources increased the project dollars by $58.8 million. Status Description
As a result, during FY 2010-21, more than $492 million FY 2010-21, more than Required Clean Water
dollars was leveraged by Clean Water Fund, or $1.09 for $492 million dollars was match funds were met
every implementation dollar invested. leveraged by Clean Water and exceeded.
Fund, or $1.09 for every
As shown in figure 10, total dollars leveraged has remained implementation dollar
relatively flat from FY 2010-17 compared to the increase invested
of Clean Water Fund implementation funds. This is in part
because BWSR has provided additional clarification to
grantees on match requirements and tracking, which has
resulted in more moderate amounts of leveraged funds
2022 Clean Water Fund Performance Report | www.legacy.leg.mn 13Surface water quality measures
The following eight measures illustrate important Clean Water Fund-supported actions and outcomes undertaken to
protect Minnesota’s surface water quality.
Actions
1. Major watersheds monitored
2. Watersheds monitored by local partners
3. Nonpoint source BMP implementation
4. Municipal infrastructure project implementation
Outcomes
5. Surface water health
6. Lake and stream water quality
7. Waters restored
8. Mercury trends
9. Municipal wastewater phosphorus trend
14 2022 Clean Water Fund Performance Report | www.legacy.leg.mnMajor watersheds monitored
ACTION
Measure: Percent of monitoring addressing state and local needs
Why is this measure important? The MPCA is returning to watersheds to complete the
Minnesotans want to know their investments in water second round of watershed-based lake and stream
quality are making a difference. Thanks to the Clean monitoring, which includes biological, fish contaminant,
Water Fund, Minnesota now has a comprehensive water quality, and pollutant load sampling. This
baseline assessment of conditions across the state. monitoring is essential to measure progress in restoring
Similar to an annual visit to the doctor, this monitoring and protecting lakes and streams. Additionally, the
shows where work to protect or return the watersheds monitoring will fill gaps to guide local planning and
to healthy conditions is required. In Minnesota, the implementation efforts and track long-term changes in
monitoring has shown that more restoration is necessary water quality and biological communities over time.
in the south and west, and more protection of resources
As the MPCA returns to watersheds, the agency
in the north and east.
has reduced essential core monitoring to provide
monitoring capacity for other state and local needs;
such as to support permitting decisions, to address a
local monitoring need, or address a gap identified in the
WRAPS or 1W1P. MPCA is using this modified approach
to planning and monitoring in watersheds for the second
10-year cycles of watershed monitoring around the state.
Figure 8. The MPCA and partner organizations evaluate water
conditions, establish improvement goals and priorities, and take What progress has been made?
actions designed to restore or protect water quality on a 10-year
MPCA has developed a process to solicit requests from
cycle.
other state and local monitoring partners and work with
local and state partners to determine monitoring needs
This data is essential to help develop local plans for in these watersheds. The process was started in 2018 and
targeted implementation activities and over time will continues to evolve as the MPCA and partners identify
measure resulting changes in water quality. By returning opportunities for improvement. Monitoring requests vary
to these watersheds to monitor after 10 years, the across the state due to the unique aspects and needs of
Minnesota Pollution Control Agency (MPCA) can do a each watershed. For example, some watersheds are small
checkup and determine if the targeted implementation is or have few to no lakes and there are few additional local
resulting in changes in water quality. Without continued requests. Others are very large, with extensive stream
monitoring, there is no way to see if the rivers and lakes and lake networks and there are many additional local
are meeting the goal of fishable and swimmable waters. requests. In some, MPCA proposed sites meet the local
needs and there are no additional local requests.
What are we doing?
Learn more
The first round of watershed monitoring and assessment • Clean Water Fund
is complete. This provides the baseline for determining www.legacy.leg.mn/funds/clean-water-fund
where waters need protection and restoration. The • Find your watershed at Watersheds
Watershed Restoration and Protection Strategy (WRAPS) (www.pca.state.mn.us/water/watersheds)
document takes the monitoring data and turns it into • Learn when MPCA will be intensively monitoring
the specific local strategies needed on the ground to your watershed at Watershed approach to restoring
protect and restore waters. This then feeds into local and protecting water quality
water planning and One Watershed One Plan (1W1P) (www.pca.state.mn.us/water/watershed-approach-
to target local implementation activities in order to see restoring-and-protecting-water-quality)
improvement in water quality.
2022 Clean Water Fund Performance Report | www.legacy.leg.mn 15Figure 9. The entire state has completed baseline monitoring (small map). The percentage of requested and approved state and
local need sites relative to the total number of sites per monitoring year is shown on the larger map. Goal is to have 20-30% state or
locally identified needs addressed through monitoring.
Status Trend Description
Nearly 40% of watersheds met
goals for addressing state and
local needs for monitoring.
Ongoing program development
is aimed to ensure local needs are
identified for monitoring.
16 2022 Clean Water Fund Performance Report | www.legacy.leg.mnWatersheds monitored by local partners
ACTION
Measure: Local partner participation in monitoring efforts
Why is this measure important? through the Red River Watershed Management Board. This
Clean Water Fund dollars enable intensive sampling work exposes hundreds of students to local waterways,
and assessment of lakes and streams in all 80 major provides watershed training to teachers, curriculum
watersheds. This allows for better protection of Minnesota’s development for elementary students, and engages
clean waters and restoration of the polluted ones. As noted students in biological and continuous monitoring.
in statute, one of the purposes of the Clean Water Fund
is to provide “…grants, loans, and technical assistance
to public agencies and others testing waters…” This
measure shows the participation of local partners, citizen
volunteers, and students across Minnesota.
The Minnesota Pollution Control Agency (MPCA) alone
cannot complete all of the monitoring necessary to
comprehensively assess the waters in the state. Local
partner participation is crucial to meet water monitoring
strategy goals and to build a base of engaged participants
for restoration and protection activities that follow the
monitoring and assessment of waters.
What are we doing?
MPCA works with local organizations across the state to
build capacity for monitoring efforts. Each year, MPCA Figure 10. Local partners play a crucial role in assessing
prioritizes certain lake, river, and stream sites, and works the health of lakes and streams in Minnesota. Lew Overhaug
(Winona County) and Joe Coleman (Minnesota Conservation
with local partners to award contracts to cover the costs
Corp) collect profile measurements on Lake Winona.
of staff, training, equipment, and lab analysis of condition
monitoring.
In this way, MPCA is ensuring that the most current
and comprehensive dataset is available for assessment
and for the development of protection and restoration
strategies. By bolstering local capacity, expertise, and
equipment inventory, these partners become engaged
and well-suited to carry out future monitoring efforts,
such as subwatershed pollutant load monitoring to aid in
restoration and protection strategies.
In addition, MPCA supports two volunteer monitoring
programs for stream and lake clarity. More than 1,300
volunteers participate annually; the data supports
assessment and trend development work and provides
an engaged citizenry for environmental protection and
restoration.
Clean Water Fund dollars also support “River of Dreams,” a Figure 11. Bethany Chaplin with the Crow Wing SWCD fills a
sample bottle after collecting water from the Gull River.
large environmental education effort in the Red River Basin
2022 Clean Water Fund Performance Report | www.legacy.leg.mn 17What progress has been made? term networks have allowed the state to track trends and
MPCA has maintained its goal of a minimum of 75% of the assess water quality.
priority sites offered being picked up by local partners. Minnesotans benefit from many other local and volunteer
During 2020 and 2021, the MPCA awarded 25 contracts monitoring efforts across the state. This interest in water
for monitoring activities across the state. Local partners resources has provided information to inform local action
who received contracts include one tribe, one regional and engagement.
policy-making council, two counties, three educational
institutions, four joint powers, two watershed districts, one
Learn more
non-profit, and 11 soil and water conservation districts. • Clean Water Fund
www.legacy.leg.mn/funds/clean-water-fund
In the Red River Basin, programs like River of Dreams,
a canoe launch program operated by the International • Learn when MPCA will be monitoring your
Water Institute, are educating students about watersheds. watershed at Watershed approach to restoring and
Through Clean Water funding, staff from the institute protecting water quality
visited 55 classrooms. In 2020, the Red River Explorers www.pca.state.mn.us/water/watershed-approach-
paddling program sponsored eight paddle outings with restoring-and-protecting-water-qualit)
more than 60 students participating. The 25th Annual
River Watch Forum was intended to be an in-person • Surface water assessment grants www.pca.state.
celebration. Due to COVID guidelines, the forum was mn.us/water/surface-water-assessment-grants
held virtually with posted videos viewed more than 2,400
times. Additionally, the spring canoe release through • Watershed pollutant load monitoring grants
River of Dreams was postponed until fall of 2020. Some www.pca.state.mn.us/wplmn/overview
participating schools launched as a class while others
encouraged students to launch individually. A total of 381
canoes were launched. Status Trend Description
Volunteers through the Citizen Stream and Lake As of 2021; all programs are
Monitoring Programs provide data on more than 1,500 meeting participatory goals.
lake and stream locations across Minnesota. These long-
Figure 12. Percent of
watershed chemistry
monitoring performed
by local partners.
18 2022 Clean Water Fund Performance Report | www.legacy.leg.mnNonpoint source BMP implementation
ACTION
Measure: Number of nonpoint source best management practices implemented with
Clean Water funding and estimated pollutant load reductions
Why is this measure important?
Minnesotans want their water resources protected and
restored. Unfortunately, it can take many years for pollution
control practices to result in clean water, particularly
at the scale outlined in the Clean Water Roadmap. This
measure helps us monitor progress toward the long-term
goal of clean water by tracking the actions of people and
organizations to implement best management practices
in cities and on the farm. This measure also tracks the
estimated amount of pollution those management and
conservation practices are expected to reduce.
What are we doing?
The Minnesota Board of Water and Soil Resources (BWSR) is
the primary state agency responsible for nonpoint source
implementation and operates in partnership with local
governments. Local governments — cities, watershed
districts, counties, and soil and water conservation districts
— are leading both cleanup and protection efforts across
the state. They are working directly with communities,
individual landowners, and various non-profit organizations
to implement best management practices. These practices
include reducing polluted runoff from city streets, agricultural
fields and feedlots; stabilizing stream channels; and
upgrading septic systems. See BWSR Clean Water Fund Figure 13. Clean Water Fund projects 2010-2021 (projects by
Stories site for more information. major basin).
The Minnesota Agricultural Water Quality Certification
Program (MAWQCP) is a statewide voluntary opportunity
for farmers and agricultural landowners to take the lead in
implementing conservation practices that protect our water.
The MAWQCP brings together producers with local soil and
water conservation district staff and agronomy professionals
to address the risks to water quality based on a whole-farm
assessment. Farmers and landowners who implement and
maintain approved farm management practices are certified
Figure 14.
and in turn obtain regulatory certainty for a period of 10
Minnesota
years. Certified producers may use their status to promote Agriculture Water
their business as protective of water quality, and producers Quality Certification
interested in becoming certified also receive priority Program
status for technical and financial assistance. Importantly, Certified farms &
independent analysis from Minnesota State Agricultural acres, FY14-21
Centers of Excellence shows MAWQCP-certified farms also
average 20% higher net profit than non-certified farms.
2022 Clean Water Fund Performance Report | www.legacy.leg.mn 19What progress has been made? FY 2010-2021 BWSR Grant Funded Project Outcomes
With funding from the Clean Water Fund, the
implementation of practices to improve and protect Major Basin Number Sediment Phosphorus
Minnesota’s water resources has accelerated, as has the of BMPs tons/year pounds/year
completion of Total Maximum Daily Load (TMDL) and Lake Superior 154 2,686 2,023
Watershed Restoration and Protection Strategy (WRAPS) Lower Mississippi 2,167 32,875 40,980
assessments that outline water quality needs. However, Minnesota 4,445 53,732 84,663
funding is not keeping pace with demand.
St. Croix 737 4,344 6,978
From 2010 to 2021 the Clean Water Fund has: Upper Mississippi 4,824 59,651 46,433
• Funded more than 3,631 grants to protect and Red River 4,766 95,731 75,811
restore Minnesota water resources.
Rainy River 78 766 941
• Issued more than 2,087 loans to prevent nonpoint Missouri 442 14,880 13,408
source water pollution or solve existing water Totals 17,613 264,665 271,237
quality problems.
through BWSR grant programs, resulting in a reduction of
• Secured more than 778 easements that will
about 271,237 pounds of phosphorus and 264,665 tons of
permanently protect approximately 17,034 acres along
sediment across the state.
riparian corridors and within well head protection
areas. The Clean Water Fund enabled BWSR to Learn more
leverage additional funds to provided 5,473 additional
acres of protection for a total of 22,507 acres. • Clean Water Fund
www.legacy.leg.mn/funds/clean-water-fund
• Repaired 788 imminent health threat subsurface
• BWSR Clean Water Fund Stories
sewage treatment systems.
bwsr.state.mn.us/clean-water-fund-stories
The MAWQCP has awarded more than 350 supplemental • Agriculture Best Management Practices (AgBMP)
grants directly to producers to implement conservation Loan Program www.mda.state.mn.us/agbmploan
practices, totaling over $1.4 million. An additional
$12 million in federal funding has been leveraged for • Minnesota Agricultural Water Quality Certification
conservation implementation grants through the USDA Program www.MyLandMyLegacy.com
NRCS Regional Conservation Partnership Program.
• 790,000 acres and 1,100 farms have been Water Status Trend Description
Quality Certified through the MAWQCP. These Although funding has increased
certifications have added more than 2,200 new and there is a continued increase
conservation practices to the landscape. in practices and projects being
implemented, the total request for
In total, more than 17,613 best management projects has remained significantly
and conservation practices have been installed greater than available funds.
Connection Goals: An 8% increase in the percentage This measure will support the roadmap goals by tracking reductions in phosphorus
with Minnesota’s of lakes with good water quality, and a 7% and sediment as a result of implementation activities. State-funded nonpoint
Clean Water increase in the percentage of rivers and implementation projects and associated pollutant reductions are tracked and will be
Roadmap streams with healthy fish communities. analyzed on the major river basin.
20 2022 Clean Water Fund Performance Report | www.legacy.leg.mnMunicipal infrastructure project implementation
ACTION
Measure: Number of municipal point source construction projects implemented with
Clean Water funding and estimated pollutant load reductions
Why is this measure important? adequate wastewater treatment are required to fix
Municipalities across Minnesota are required to upgrade noncomplying individual sewage treatment systems or
treatment facilities, increase treatment of stormwater install community systems when new individual systems
runoff, and replace failing septics in order to protect or are not feasible.
restore our state’s waters. These construction projects The Minnesota Public Facilities Authority (PFA) and the
help meet required wasteload reductions through Minnesota Pollution Control Agency (MPCA) jointly
implementation of total maximum daily loads, phosphorus administer programs that provide grants and loans from
discharge limits, and Water Quality Based Effluent Limits Clean Water Funds to help municipalities pay for these
(WQBEL). These reductions are in addition to the major infrastructure improvements. These Clean Water Funds
water quality benefits already achieved by municipalities supplement existing state and federal funding so that
through ongoing investments to replace aging wastewater municipalities can implement these important upgrades
infrastructure. more quickly.
What progress has been made?
Since 2010, Clean Water Fund dollars have helped 146
projects that implement wastewater and stormwater
improvements, including:
• 52 wastewater construction projects to reduce
phosphorus discharges to 1 milligram per liter or
less, resulting in an estimated total phosphorus
reduction of over 140,000 pounds per year.
• 10 wastewater construction projects to reduce
mercury discharges, resulting in an estimated
total reduction of 719 milligrams per year.
• 2 wastewater construction projects that will
provide treatment to reduce subsurface nitrogen
discharges, resulting in an estimated total
reduction of 5,818 pounds per year.
• 5 construction projects to reduce chloride
discharge, resulting in an estimated total chloride
reduction of 27,751 pounds per year.
• 10 stormwater construction projects that
will provide treatment to reduce phosphorus
discharges by an estimated 1,528 pounds per
Figure 15. Municipal infrastructure projects by major basin, 2010–2021 year and also result in reducing total suspended
solids of 97,949 pounds per year.
What are we doing? • 37 small community technical assistance projects
Cities are required to implement upgrades to their to help small communities evaluate treatment
wastewater and stormwater infrastructure to meet tighter alternatives to address serious water quality and
discharge standards and specific water quality protection public health problems from non- complying
and restoration goals. Small communities without septic systems.
2022 Clean Water Fund Performance Report | www.legacy.leg.mn 21You can also read