Climate Change - What we know and what not
←
→
Page content transcription
If your browser does not render page correctly, please read the page content below
Climate Change –
                               What we know and what not

                                                                        Hauke Schmidt

                       Max Planck Institute for Meteorology, Hamburg, Germany

                                          EPS-SIF International School on Energy, July 2021

(Note: due to unclear copyright situations, some of the figures
have been removed from the original presentation, but
references are given)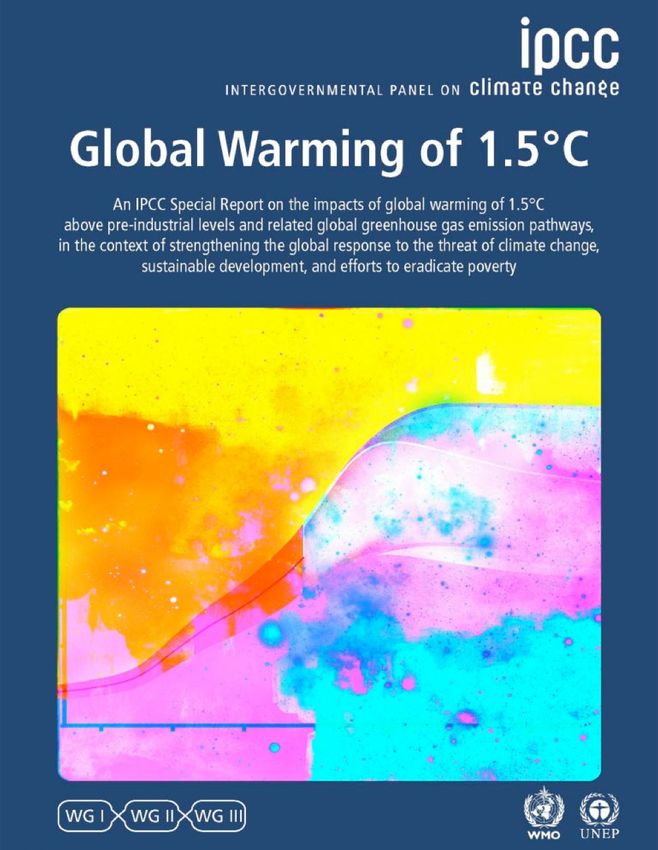
Content

• Basics
    • What is climate?
    • Atmospheric energy balance
• The current state of climate research
    • Observations
    • Causes of climate change
    • Models
    • Projections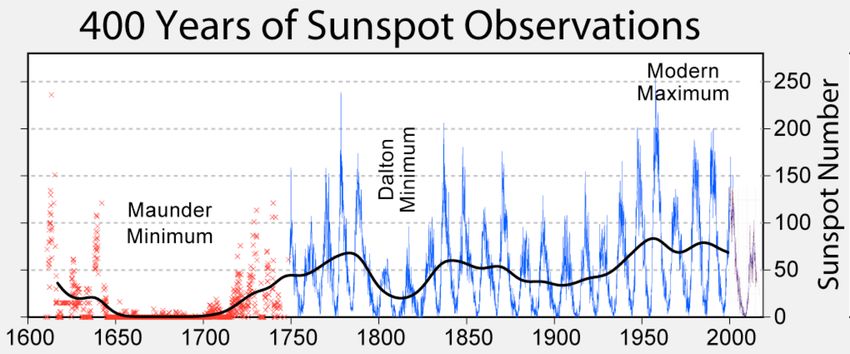
Weather and Climate

                 „Climate is what you expect,
                    weather is what you get.“

(Robert A. Heinlein, 1907-1988, amerikanischer Schriftsteller)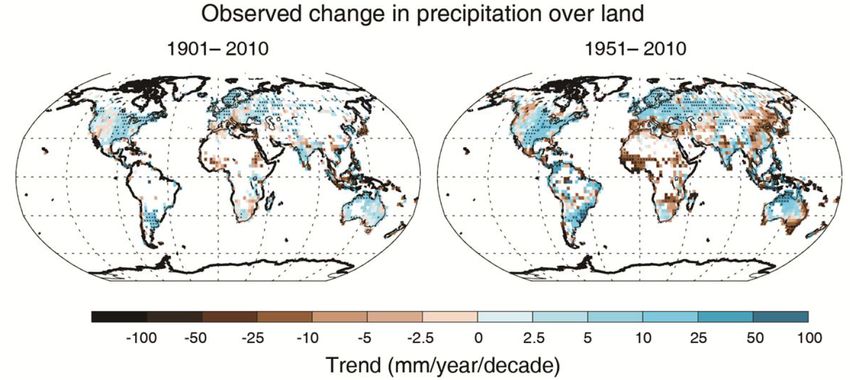
Alexander von Humboldt: Climate

”The word climate, however, denotes first and
foremost a specific property of the atmosphere,     (Picture of A. v.
                                                    Humboldt)
but this property depends on the perpetual
interactions of a fully and deeply moving, of
currents of contrasting temperatures furrowed sea
surface with the heat-radiating dry Earth, which
is manifoldly structured, elevated, coloured,
naked, or covered with woods and herbs.”

A. v. Humboldt, “Kosmos – Entwurf einer
physischen Weltbeschreibung “, 1845-1862,
translated by H. Schmidt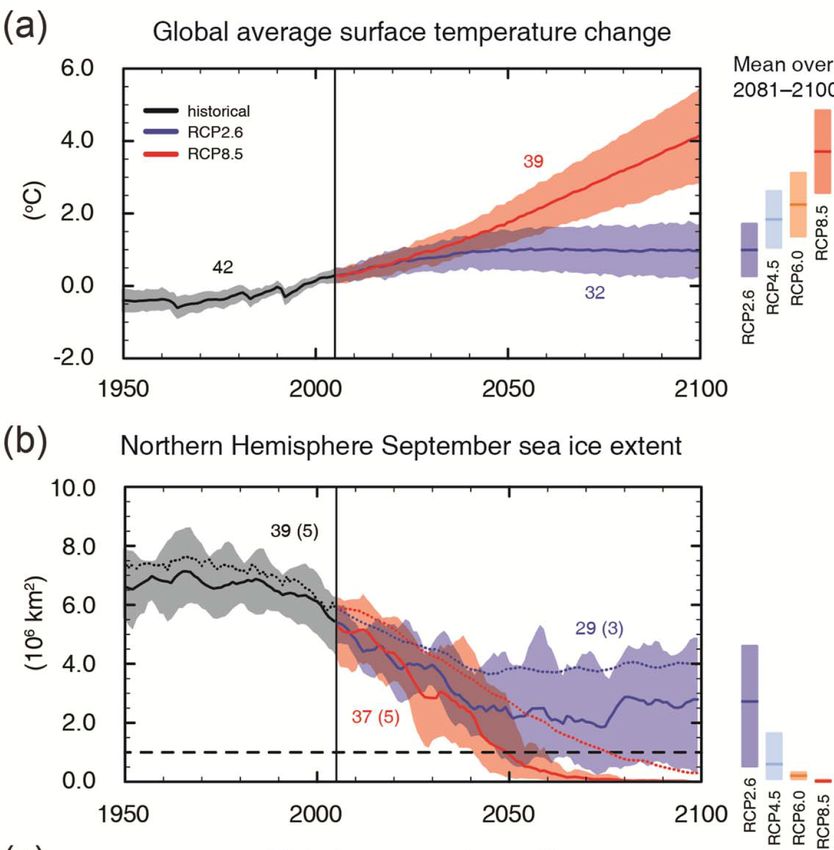
Climate as a probability distribution

(time series and pdf of some climate variable)
The atmospheric energy budget

(Fig. 7 from Kiehl and Trenberth: Earth’s annual global mean
energy budget, Bulletin of the American Meteorological
Society, 1997)
The IPCC
IPCC: Intergovernmental Panel on Climate Change

Established in 1988 by WMO und UNEP

Organized in 3 working groups:
§ WG I assesses the physical scientific basis of the climate system
  and climate change.
§ WG II assesses the vulnerability of socio-economic and natural
  systems to climate change.
§ WG III assesses options for mitigating climate change.

About every 6 or 7 years reports of the working groups are published.
  Hundereds of scientists are involced in this exercise. The „Fifth
  Assessement Report“ (AR5) was published in 2013/14. The
  publication series of AR6 reports will start on August, 9, 2021 with
  WG1.

Downloads: www.ipcc.ch

The current state of climate research
    WORKING GROUP I           IPCC Special Report on Global
CONTRIBUTION TO THE IPCC           Warming of 1.5 °C            WORKING GROUP I
          AR5                                                 CONTRIBUTION TO THE
CLIMATE CHANGE 2013: THE           (published in 2018)               IPCC AR6
 PHYSICAL SCIENCE BASIS                                       (expected to be published
                                                                  August, 9, 2021)
    (http://www.ipcc.ch)           (http://www.ipcc.ch)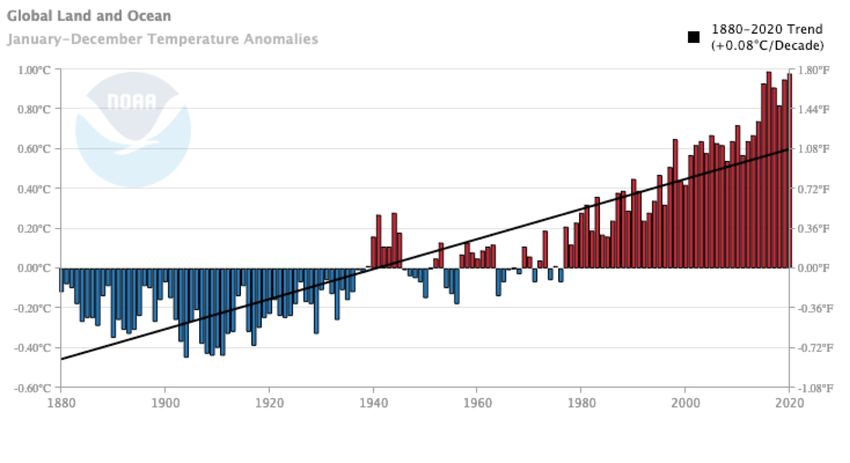
Uncertainties – The language of the IPCC

                                           (IPCC AR5, WG1, TS, 2013)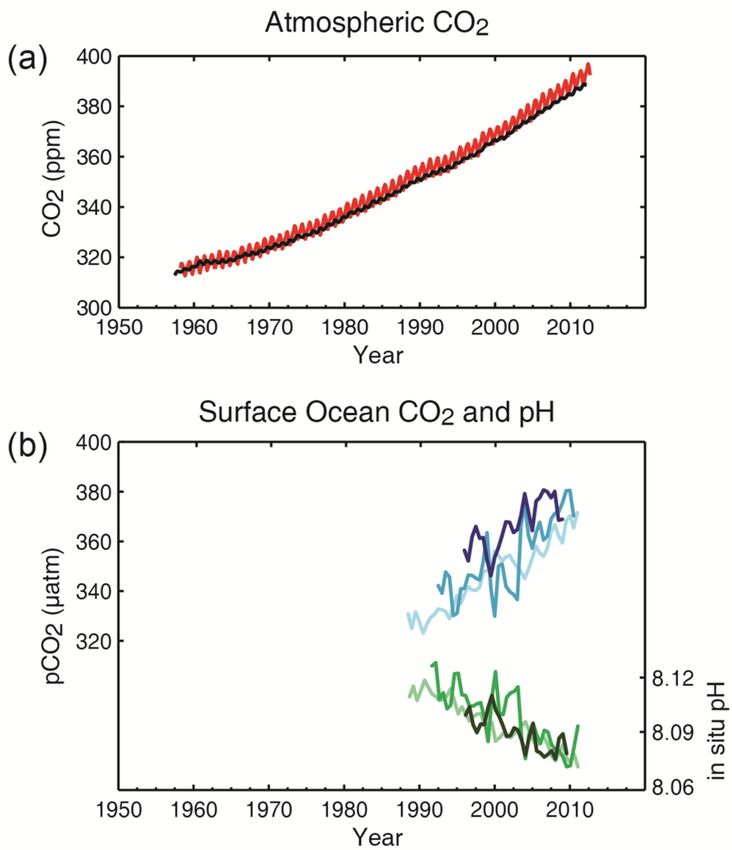
Observed climate change
Global mean surface temperatures 1880-2020

   (NOAA National Centers for Environmental information, Climate at a Glance: Global Time Series,
   published July 2021, retrieved on July 18, 2021 from https://www.ncdc.noaa.gov/cag/)
Warming over oceans and land

(NOAA National Centers for Environmental information, Climate at a Glance: Global Time Series,
published July 2021, retrieved on July 18, 2021 from https://www.ncdc.noaa.gov/cag/)
Why warming over land is larger than over oceans?

                         (Fig. 7 from Kiehl and Trenberth: Earth’s annual global mean
                         energy budget, Bulletin of the American Meteorological
                         Society, 1997)

Increased downward infrared radiation at the surface has to be compensated by surface warming which leads to increased
longwave emission of the surface and increased latent and sensible heat transfer. However, evaporation is limited over dry
surfaces.
Global temperature increase, 1850-2020, max-min range ≈ 1.5℃
(Ed Hawkins, Univ. Reading,
https://www.climate-lab-book.ac.uk)Temperature increase, global vs. Italy
global, 1850-2020, max – min ≈ 1.5℃
Italy, 1901-2020, max – min ≈ 3℃)
(Ed Hawkins, Univ. Reading,
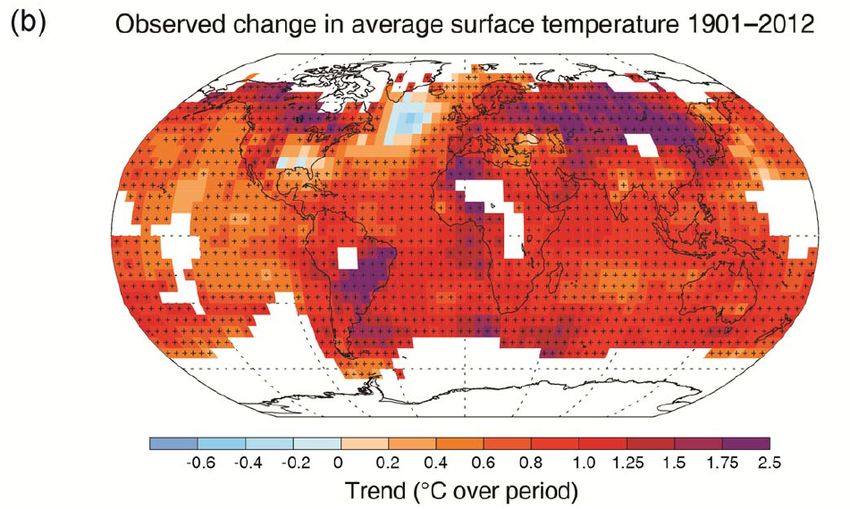
https://www.climate-lab-book.ac.uk)Observed regional temperature increase
(IPCC AR5, SPM, 2013)Observations: Arctic sea ice, global sea level
(IPCC AR5, SPM, 2013)Observations: Arctic sea ice, September
" The observed linear relationship implies a
sustained loss of 3 0.3 square meters of
September sea-ice area per metric ton of CO2
emission. „
Notz and Stroeve, Science, 2016
(September Arctic sea ice figures for 1984 and 2016 from
nsidc.org)Observed regional precipitation changes
(IPCC AR5, SPM, 2013)Observed change in precipitation extremes
(Fig. 1a from O’Gorman: Precipitation Extremes Under Change of annual maximum of
Climate Change, Current Climate Change Reports, 2015) daily precipitation per global
temperature increase of 1KCauses for climate change
Possible causes for climate changes

Natural forcings

  •    Volcanic eruptions
  •    Variations of solar activity
  •    Variations of Earth‘s orbital parameters (Milankovic cycles)

Anthropogenic forcings

  • Fossil fuel burning (coal, oil, gas) (e.g., CO2, SO2, soot)
  • Methane emissions (e.g. from fossil fuel production and
    transport, livestock farming, landfills)
  • Land use changes (e.g. deforestation, urbanisation)

                 Attention, this list is by no means complete ...
                 and there is internal variability of the climate system
The eruption of Mount Pinatubo
In the year after the
eruption of Mt. Pinatubo,
global surface
temperature decreased
by about 0.4oC.Sun spots
(source: Wikipedia)CO2 in the atmosphere
(IPCC AR5, SPM, 2013)
(www.co2.earth)Greenhouse gases in ice cores
CO2
CH4
(IPCC, 2007)Svante Arrhenius (1859-1927) See Tyndall Lecture by Raymond Pierrehumbert, AGU, 2012: https://www.youtube.com/watch?v=RICBu_P8JWI Or read https://history.aip.org/climate/Radmath.htm
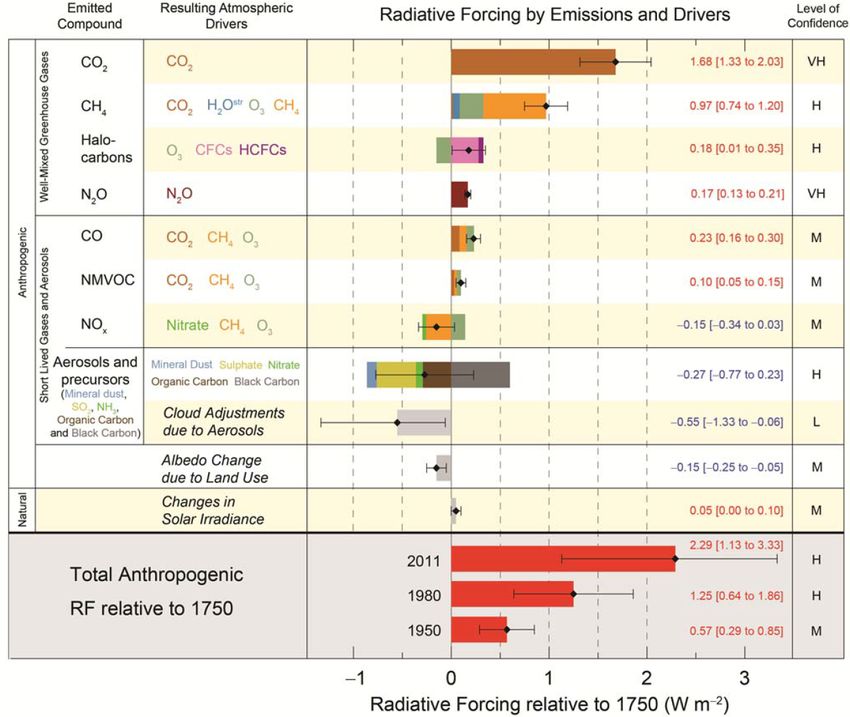
Radiative forcings of the climate system

                                           (IPCC AR5, SPM, 2013)
Climate models
Radiative-Convective Equilibrium

(Fig. 7 from Kiehl and Trenberth: Earth’s annual global mean
energy budget, Bulletin of the American Meteorological
Society, 1997)
A remarkably robust prediction with an RCE-Modell

               (Fig. 16 from
               Manabe &
               Wetherald (JAS,
               1967)

Manabe & Wetherald (JAS, 1967) estimated a warming of 2,7 K for a doubling of the atmospheric CO2 concentration. We
(Kluft et al., J. Climate, 2019) repeated their calculations, arriving at 2,8 K.
Model equations for the atmosphere (and ocean)
: vorticity; : kinetic energy; : vertical coordinate; : mixing ratio of tracer i
F : external forcing. Other symbols have their conventional meanings.
can‘t be solved analytically …... but numerically. However, sub-grid scale processes need to be parameterized.
What is the equation for a tree …?

(Picture of trees)

                                  (Giorgetta et al., JAMES, 2013)
Global temperatures – simulated and observed
(IPCC AR5, WG1, Fig. 9.8, 2013)Is the temperature increase anthropogenic?
(IPCC AR5, SPM, 2013)Climate sensitivity
Climate sensitivity: Temperature increase ΔT
resulting from a radiative forcing ΔF at the
tropopause.
Usually defined as Temperature increase for a
doubling of the atmospheric CO2 concentration
(for which a radiative forcing of ΔF ≈ 3.7 W/m2 is
assumed).
According to IPCC AR5, equilibrium climate
sensitivity (ECS) is likely between 1.5 and 4.5 !.
A recent study (Sherwood et al., Rev. of
Geophysics, 2020) has narrowed this to between
2.6 and 3.9 !.
Several recent global climate models have
sensitivities above these ranges.
I’m curious to see the upcoming IPCC
assessment on this topic.
(IPCC AR5, WG1, TFE.6, Fig.1, 2013)One important reason for differences in climate sensitivity among models?
(IPCC AR5, WG1, Fig.9.43, 2013)Projections of future climates
RCPs: CO2 emissions and concentrations

(Fig. 3 from van Vuuren et al., The representative
concentration pathways: an overview
Climatic Change, 2011)

     Green: RCP2.6; Red: RCP4.5; Black: RCP6.0; Blue: RCP8.5

         RCP8.5 close to SRES A2, RCP4.5 close to SRES B1
Projections: global temperature, Arctic sea ice
(IPCC AR5, SPM, 2013)Cumulative CO2-emissions and global temperature
(IPCC AR5, SPM, 2013)How much can we still emit? Remaining budget (from 2015): ΔT
How much can we still emit?
„In model pathways with no or limited
overshoot of 1.5C, global net anthropogenic
CO2 emissions decline by about 45% from
2010 levels by 2030 (40–60% interquartile
range), reaching net zero around 2050
(2045–2055 interquartile range). For limiting
global warming to below 2C CO2 emissions
are projected to decline by about 25% by
2030 in most pathways (10–30% interquartile
range) and reach net zero around 2070
(2065–2080 interquartile range). Non-CO2
emissions in pathways that limit global
warming to 1.5Cshow deep reductions that
are similar to those in pathways limiting
warming to 2C.“
...
„Most 1.5 C and 2 C pathways are heavily
reliant on CDR (Carbon Dioxide Removal) at
a speculatively large scale before mid-
century.“
(IPCC, 2018: Global Warming
of 1.5 C; Fig. SPM.1; SPM,
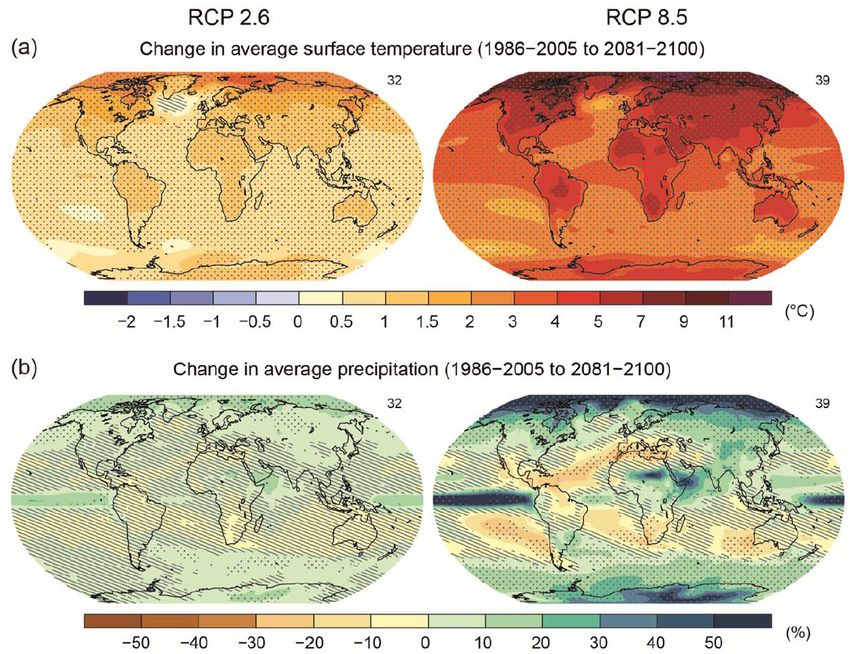
C.1; Section 2.6.3)Projections, temperature and precipitation
(IPCC AR5, SPM, 2013)Why (and how much) it rains more under warming?
(Fig. 7 from Kiehl and Trenberth: Earth’s annual global mean
energy budget, Bulletin of the American Meteorological
Society, 1997)
Latent heating from condensation balances tropospheric radiative cooling to space. This cooling (by CO2 und H2O) increases
under current GHG induced warming of 1℃ by about 2%. Likewise react latent heating and precipitation. So global precipitation
increases less than humidity (about 7%/1℃ following Clausius-Clapeyron) under warming. Precipitation is constrained by
energy, not humidity.Precipitation changes in central Europe, summer
(IPCC AR5, WG1, Fig. AI39, 2013)Projections of different models
Winter mean zonal wind in 850 hPa (gray isolines, 5 m/s) und its change in the 21. century under strong
CO2 increase
(Fig. 4 from Shepherd et al., Atmospheric circulation as a
source of uncertainty in climate change projections, Nature
Geoscience, 2014)Predictability and internal variability
50-year trends (2010-2060) simulated with the CCSM3 model
(Fig. 10a from Deser et al., Projecting North American Climate
over the Next 50 Years: Uncertainty due to Internal Variability
J. Climate, 2013)Projections of different models (Fig. 1 from Stevens & Bony, What Are Climate Models Missing, Science, 2013)
(One) future of modelling

Tropical Atlantic in ICON, August, 23, 2016
Will extreme events increase with global warming?

• Heat waves:                 very likely, globally
• Extreme precipitation:      very likely in mid-latitude and tropical land areas
• Coastal floodings:          very likely
• Droughts:                   likely in sub-tropical regions
• Tropical storms:            uncertain
• Extratropical storms:       uncertain

                                                               (IPCC AR5, Tab. SPM.1, 2013)
What we know and what not
• „It is extremely likely that human influence has been the dominant cause of the observed
warming since the mid-20th century.“ (IPCC AR5)
• A doubling of atmospheric CO2 likely causes global warming between 2.6 and 3.9 ℃
(Sherwood et al., 2020; between 1.5 and 4.5 ℃., IPCC AR5)
• The temperature increase until the end of this century depends largely on the cumulative
GHG emissions. In order to reach the 2 (or 1,5) ℃-limit future cumulative CO2 emissions
should not be larger than 1200 (550) Gt CO2 emittiert werden. In the past, humans have
emitted about 2000 Gt, currently about 40 Gt per year.
• Precipitation has likely already decreased in dry regions and increased in wet regions.
This trend will very likely continue. (IPCC, AR5) Global mean precipitation is expected to
increase by about 2% per 1℃ global warming.
• Currently, sea level rises by about 3 mm per year. A melting of Greenland would increase
sea level by about 7m of Antarctica by more than 40m.
• Several weather extremes will likely increase.
• The global thermodynamics of climate change are well understood, how warming affects
the weather (in particular circulation) less good.
• I expect there will be surprises. Understanding the system better is the best preparation.
Thank you very much !You can also read