Climate Risk and Business - Practical Methods for Assessing Risk - International Finance Corporation

Page created by Ernest Robbins
 
CONTINUE READING
Climate Risk and Business - Practical Methods for Assessing Risk - International Finance Corporation
Climate Risk and Business
Practical Methods for Assessing Risk
Climate Risk and Business - Practical Methods for Assessing Risk - International Finance Corporation
Acknowledgments

© 2010, International Finance Corporation
First printing, September 2010

Authored by
Vladimir Stenek, International Finance Corporation
Richenda Connell, Acclimatise
John Firth, Acclimatise
Michelle Colley, Acclimatise

IFC and the authors wish to thank the management and staff of
Himal Power Limited, Ghana Oil Palm Development Company
and Packages Ltd. for their support and cooperation in the
elaboration of the studies. The authors also wish to thank the
numerous local experts and institutions listed in Annex 3 for their
valuable contributions to the studies.

This work benefited from support provided by the Trust Fund for
Environmentally & Socially Sustainable Development (TFESSD),
made available by the governments of Finland and Norway.

Reviewers
We thank the following for their critical review and comments:
Peter-Martin Thimme (DEG - Deutsche Investitions- und
Entwicklungsgesellschaft mbH) , Alan Miller, Jamie Fergusson,
Susan Holleran, and Katia Theriault (IFC).

Editors
Rachel Kamins, Anna Hidalgo, Vladimir Stenek, Richenda Connell

Designer
Studio Grafik

Photo credits
Vladimir Stenek, International Finance Corporation
Chris Train, UK Environment Agency
Packages Ltd.
Climate Risk and Business
Practical Methods for Assessing Risk
Foreword
Climate change creates both risks and opportunities for the private sector, particularly in emerging
markets. Climate impacts may affect companies’ financial, economic, environmental and social
performance, especially when they rely on long-lived fixed assets or have complex supply chains.

Yet to date, the evidence for the significance of these issues has been poorly defined. Most climate
change assessments express impacts due to changes in a limited number of parameters, usually
average temperature and precipitation, over large geographic areas and on relatively long time-
horizons. However, private-sector needs include shorter time horizons, focused on smaller geographic
areas and information about impacts that is specific to the business. Very few companies and private
sector stakeholders, particularly those that are smaller in size, many of whom are in climate sensitive
sectors, have the capacity and resources to produce such information.

Recognizing the gaps in knowledge of how climate change will affect the private sector and of the
potential significance of the risks to investors, IFC undertook three pilot studies from 2008 to 2009,
based on investments in developing countries. These studies aimed to understand gaps and barriers to
private-sector climate risk analysis, to test and develop methodologies for evaluating these risks and,
in this context, to identify possible adaptation responses and needs.

Despite the challenges and uncertainties inherent in undertaking such assessments, the studies have
been able to generate new information related to climate risks to a variety of businesses across
different locations. They have also demonstrated some of the practical approaches that can be applied
by businesses to understand these risks better, to react as necessary, and to reduce uncertainty about
the future. Ultimately, the ability of businesses like those studied here to adapt to climate change will
depend not only on their own actions but also on the actions that may be needed from the public
sector, non-government organizations, the scientific community and other stakeholders.

These pilot studies are an important first step in IFC’s broader initiative to develop an understanding
of the implications of climate change for business. IFC will continue to support this type of analytical
work, which is critically important to helping our clients, and the private sector more broadly, to adapt
to the challenges and opportunities brought about by climate change.

Rachel Kyte
Vice President, Business Advisory Services
International Finance Corporation
Table of Contents
Foreword

Introduction                                                   1
    The pilot studies                                          1

Approach to the assessments                                    3
    Climate risks to investment performance                    4
    Adaptation actions                                         7

Lessons learned, uncertainties, gaps and barriers              9
    Value of visit to client site and stakeholder engagement   9
    Climate data                                               9
    Assessments of risk to investment performance              12
    Analysis and recommendations on adaptation actions         13

General results and conclusions                                15
    Most significant risks and uncertainties                   15
    Temperature-related impacts                                18
    From uncertainty to risk                                   19

Annex 1: A risk-based approach                                 21

Annex 2: Summary results of pilot studies                      22

Annex 3: Acknowledgments                                       38

References                                                     39
Introduction

The main objective of the first set
of pilot climate risk assessment                 The pilot studies
studies undertaken by IFC was to test
and begin to develop methods for                 Himal Power Ltd. Khimti 1
evaluating climate risks to the private          hydropower scheme, Nepal
sector and to identify appropriate               Khimti 1 is a 60 MW run-of-river
adaptation responses. This included              hydropower facility, generating 350 GWh
analyzing barriers and gaps preventing           of electricity per year, located in Dolakha
evaluation of risks and adaptation               District, about 100 km east of Kathmandu.
options, and understanding the roles             The facility utilizes a drop from 1,270 to
of different stakeholders (private and           586 m above sea level from the Khimti River,        Khimti 1 power house and complex
public) in addressing those constraints.         a tributary of the Tama Koshi River. Khimti
The studies also aimed to provide                1 was built and is owned and operated by Himal Power Ltd. (HPL) and, as a public-
information that reduces uncertainty             private partnership project, will be transferred to the Nepalese government in the
about present-day and future climate-            future. The timescale for this study was from the present day to the 2050s.
related risks to the pilot study clients.
In this context, the pilot studies should        Packages Ltd. Bulleh Shah
be viewed as an initial step towards             Paper Mills, Pakistan
elaboration of general tools for                 Packages Ltd. is Pakistan’s premier pulp and
climate risk assessment and evaluation           paper packaging company and has been
of adaptation options, for use in the            an IFC client since 1964. The company
private sector.                                  produces paper and paperboard, writing
                                                 and printing paper, tissue products, and
The first three studies analyzed                 flexible packaging products. It uses wheat        Winding reels at BSPM
Khimti 1 hydropower facility in Nepal,           straw, recycled and waste paper, and
Packages Bulleh Shah paper mills                 imported pulp in its production lines. The newly established Bulleh Shah Paper Mills
in Pakistan, and Ghana Oil Palm                  (BSPM), near Kasur, have allowed the company to relocate existing pulp and paper
Development Company (GOPDC).                     production facilities from its headquarters in Lahore to larger premises, enabling it
This report aims to provide an                   to increase its production capacity from 100,000 to 300,000 tons per year. It also
overview of the approaches used                  generates power on-site and sells excess power to the grid. The timescale for this
in the studies and the challenges                assessment was from the present day to the 2040s.
encountered. It also provides tables
which summarize the main results                 Ghana Oil Palm Development Company
of the studies. Full reports providing           Ltd. (GOPDC), Ghana
more detailed data and analyses                  GOPDC is an integrated agro-industrial
are available at www.ifc.org/                    company with two oil palm plantations, at
climatechange.                                   Kwae and Okumaning in Ghana’s eastern
                                                 region. GOPDC also operates a mill at
The lessons learned from the pilot               Kwae, where oil palm fresh fruit bunches
studies included:                                are processed into crude palm oil (CPO)         GOPDC plantation worker
                                                 and palm kernel oil (PKO). Also at Kwae,
•   The most significant climate risks           a refinery and fractionation plant processes up to 150 metric tons/day of CPO into
    on the timescales of relevance to            olein and stearin products. The timescale for this assessment was from the present
    clients are where existing climatic          day to the 2030s.
    vulnerabilities may be exacerbated

Climate Risk and Business | Practical Methods for Assessing Risk                                                                         1
and critical performance or          TABLE 1: RISK AREAS ANALYZED FOR THE THREE PILOT STUDIES
        compliance thresholds may be
                                             HPL Khimti 1                  Packages Ltd. Bulleh
        crossed, as well as where systems
                                             hydropower scheme             Shah Paper Mill             GOPDC Ltd.
        are highly sensitive to changes in
        climatic factors.                    Power generation from     Wheat yields                    Oil palm yield
    •   With the rapid evolution of          hydropower scheme during
                                                                       Power production from           Oil palm pests and
        climate science, information on      dry and wet seasons
                                                                       steam turbine and boiler        diseases
        changes in the frequency and         Extreme flood event on
                                                                       Groundwater resources           Ecosystem services
        intensity of extreme climatic        Khimti Khola and Tami
        events (e.g., heavy rainfall or      Koshi rivers              Wastewater treatment            Refinery/fractionation
        major flooding), and potential                                 plant                           plant
                                             Landslide blocking Khimti
        impacts and consequences for a                                 Pulp and paper industry         Power production
                                             Khola River and access
        business’ operations will become                               generally
                                             road to site                                              Groundwater resources
        available.
    •   Using downscaled projections         Glacial lake outburst flood   Community and social
                                                                                                       Wastewater treatment
        of global climate models for                                       issues
                                             Increase in irrigation                                    Malaria affecting GOPDC
        regions where these models are       demand for agriculture                                    workforce
        in good agreement can help
        provide better understanding of      Local community                                           Community and social
        changes at a local level.            livelihoods                                               issues
    •   Publicly funded research can
        help to develop understanding
        of the relationships between
        climatic factors and their           Methodology                                  in time (2008/9), and that some
        impacts on different systems                                                      of the pilot study findings reflect
        and can build generic system         The studies used a risk-based approach,      the underlying uncertainties in
        models. Provided that such           presented in Annex 1. The principal          this evidence base. However, the
        models are made accessible,          areas of risk identified during the          ongoing and rapid advancement of
        private-sector stakeholders can      process are listed in the table above.       climate science – new research and
        adapt them to better represent                                                    new generations of climate models
        the specific conditions for their    It is worth noting that the                  – is expected, in time, to provide
        investments.                         information about climate change             increasing levels of confidence about
                                             and its impacts applied in the studies       climate change and its impacts,
                                             was the best publicly available              even in regions currently known for
                                             information at a specific point              difficulties in climate modeling.

2                                                                   Climate Risk and Business | Practical Methods for Assessing Risk
Approach to the assessments

CLIMATE DATA                                      Figure 1: Trend in Observed Annual Average of Monthly Mean Temperature (°C)
                                                  at Akim Oda Meteorological Station, Near GOPDC Plantations, 1970–2007
Observed conditions
                                                                                         Changes in annual average of monthly mean temperature
The studies required data on                       Annual mean temperature (oC)   28.0
observed and future climatic                                                      27.5
conditions. Observed data were
obtained from a variety of sources,                                               27.0
including the client companies,                                                   26.5
national meteorological agencies,                                                 26.0
and the Intergovernmental Panel on
Climate Change Data Distribution                                                  25.5
                                                                                         1970
                                                                                         1971
                                                                                         1972
                                                                                         1973
                                                                                         1974
                                                                                         1975
                                                                                         1976
                                                                                         1977
                                                                                         1978
                                                                                         1979
                                                                                         1980
                                                                                         1981
                                                                                         1982
                                                                                         1983
                                                                                         1984
                                                                                         1985
                                                                                         1986
                                                                                         1987
                                                                                         1988
                                                                                         1989
                                                                                         1990
                                                                                         1991
                                                                                         1992
                                                                                         1993
                                                                                         1994
                                                                                         1995
                                                                                         1996
                                                                                         1997
                                                                                         1998
                                                                                         1999
                                                                                         2000
                                                                                         2001
                                                                                         2002
                                                                                         2003
                                                                                         2004
                                                                                         2005
                                                                                         2006
                                                                                         2007
Centre (IPCC DDC).1 These data
were analyzed to provide a view of
                                                                                                           Annual Average Mean Temperature
“baseline” climatic conditions against
which future climate change impacts
could be assessed and to identify
any trends in the observed records.               Scenarios of future                                            The country profiles provide analyses
By way of example, Figure 1 shows                 climate change                                                 of changes in the following climatic
the observed trend in annual average                                                                             parameters, year by year, out to
temperatures recorded at Akim                     Scenarios of changes in future                                 2100, on an annual and seasonal
Oda meteorological station, near                  climatic conditions were sourced                               basis:
GOPDC’s plantations. The data show                mainly from the United Nations
an upward trend, with an increase                 Development Program (UNDP)                                     •   Mean temperature
of 1.5°C having occurred over the                 Climate Change Country Profiles                                •   Mean precipitation
period 1970–2007. This represents                 (McSweeney, New, and Lizcano                                   •   Indices of extreme daily
an increase of approximately 0.04°C               2008). These profiles were                                         temperatures (from the
per year and is an indication that the            developed to address the climate                                   2060s onward), including the
effects of climate change may already             change information gap in                                          frequency of “hot” and “cold”
be underway in the region.                        developing countries. They provide                                 days and nights
                                                  multi-model projections of changes                             •   Indices of extreme daily
                                                  in future climatic conditions from                                 precipitation (from the 2060s
                                                  15 of the most up-to-date general                                  onward), including the
                                                  circulation models (GCMs), as used                                 proportion of total rainfall
                                                  in the IPCC’s Fourth Assessment                                    falling in “heavy” events,
                                                  Report, for a range of different                                   maximum 1-day rainfall
                                                  emissions scenarios (namely A2,                                    amounts, and maximum 5-day
                                                  A1B, and B1).2                                                     rainfall amounts.

1. Online at http://www.ipcc-data.org/ddc_visualisation.html.
2. For further information on the IPCC emissions scenarios, see the IPCC Fourth Assessment Report, available online at http://www.ipcc.ch.

Climate Risk and Business | Practical Methods for Assessing Risk                                                                                         3
As an example, Figure 2 shows                        Figure 2: Projected Percentage Changes in Monthly Average Precipitation in
    projected changes in monthly                         Nepal for the Dry Season (Dec/Jan/Feb) and the Wet Season (Jun/Jul/Aug) by
    average precipitation in Nepal by                    the 2030s, relative to the 1970–99 baseline
    the 2030s according to the country’s
    UNDP climate change profile, using
                                                                              Dec/Jan/Feb
    the A2 emissions scenario.3

    On the timescales of relevance to
    the pilot study clients, no data were
    available from the UNDP country
    profiles on changes in the indices
    of extreme daily temperatures and
    precipitation. The limitations of
    applying GCMs to assessments at
    the scale of individual project sites
    are discussed below.

    CLIMATE RISKS TO
    INVESTMENT PERFORMANCE

    The data on future climate change
                                                                              Jun/Jul/Aug
    were used to assess risks to the
    performance of the pilot study
    projects. Undertaking these risk
    assessments required understanding
    of the relationships between
    climatic factors and the aspect of
    performance (i.e., the system) being
    considered.

                                                         Source: McSweeney et al. 2008

    3. The grids in the figure divide the area of Nepal by longitude (x-axis) and latitude (y-axis). Khimti 1 is located in the grid box highlighted in blue
    in the top figure. In each grid box, the central value (large number) shows the median of the 15 climate models, and the values in the upper and
    lower corners are the maximum and minimum model values. According to this analysis, the median change in monthly average precipitation
    projected for Khimti 1 is –7 percent (low to high range of –37 to +11 percent) for the dry season and +2 percent (low to high range of –23 to +43
    percent) for the wet season.

4                                                                                  Climate Risk and Business | Practical Methods for Assessing Risk
Where possible, these relationships          Figure 3: Correlation between Malaria Cases per Month (%) and Number of
were established based on data               Rainy Days (Two Months Lagged), 2004–7, from St. Dominic’s Hospital
recorded at, or close to, the pilot
study site. For example, Figure                                                         Scatterplot of percentage of malaria cases per month vs. number of rainy days
3 uses data collected from St.                                                          per month (two-months lagged), 2004-2007
Dominic’s Hospital, the nearest                                                25

                                              Number of rainy days per month
hospital to GOPDC, to show the                                                                                                                        r=0.79, p
Finally, for risk areas where no           Figure 5: Projected Net Reduction in Income at GOPDC Due to Impacts of Rising
    literature on climate change               Temperatures on Refinery Vacuum Strength and Olein and Stearin Production
    impacts could be found, such as the
    industrial facilities at Packages and        Projected average annual temperatures at Kwae from 2010 to 2030, and associated net
    GOPDC, the study teams were able                  annual financial impact ($) related to reduction in vacuum strength in refinery,
    to work effectively with the facility        affecting olein and stearin production, with excess CPO sold instead (12% discount rate)
    managers and engineers to develop                   31.7                                                                              8000

                                                                                                                                                 Net annual financial impact
    a good understanding of the risks to                31.6                                                                              7000
    the companies’ performance.                         31.5                                                                              6000
                                                        31.4                                                                              5000
    Analysis of financial impacts                       31.3

                                                T(oC)
                                                                                                                                          4000

                                                                                                                                                             ($)
                                                        31.2
                                                                                                                                          3000
    Where possible, technical/                          31.1
                                                                                                                                          2000
    operational, environmental,                         31.0
                                                        30.9                                                                              1000
    and social risks to client project
                                                        30.8                                                                              0
    performance were translated

                                                               2010
                                                               2011
                                                               2012
                                                               2013
                                                               2014
                                                                             2015
                                                                             2016
                                                                                    2017
                                                                                    2018
                                                                                    2019
                                                                                              2020
                                                                                                     2021
                                                                                                     2022
                                                                                                     2023
                                                                                                     2024
                                                                                                                 2025
                                                                                                                 2026
                                                                                                                        2027
                                                                                                                        2028
                                                                                                                        2029
                                                                                                                                   2030
    into financial risks. Achieving this
    depended on being able to apply                                                        Year
    a financial value to risks quantified                  Annual reduction in financial performance ($)                 Temperature (deg C)
    in physical terms. Broadly speaking,
    the financial issues analyzed can be       Note: 12% discount rate applied. Rising temperatures will negatively impact the production of
                                               olein and stearin by raising cooling water temperatures, thus decreasing vacuum strength and
    categorized as:                            reducing the efficiency of GOPDC’s refinery operations. These figures assume that unprocessed
                                               crude palm oil will be sold directly to market, offsetting the loss of revenue due to the reduction
    •   changes in income due to               in olein and stearin production.
        changes in output and efficiency
        (see, e.g., Figure 5) or
    •   changes in operating costs (see,        TABLE 2: PROJECTED REVENUE CHANGES FOR PACKAGES, PAKISTAN,
        e.g., Table 2, purple text).            DUE TO CHANGES IN INCOME AND FUEL COSTS RELATED TO POWER
                                                PRODUCTION
    Some risks, such as temporary               Impact                                         Temperature increase by 2020s
    shutdowns of facilities due to                                                             1.1°C            1.26°C            1.88°C
    extreme climatic events (e.g.,
                                                Power output of steam turbine (current 17.78 MW                 17.77 MW          17.73 MW
    major floods), clearly also have
                                                level is 17.85 MW)
    the potential to affect financial
                                                Reduction in annual income due to   –$57,000                    –$65,000          –$98,000
    performance. However, owing to
                                                reduced power output, based on
    a lack of knowledge about the
                                                assumed $0.1/kWhr and 340 operating
    present-day and future probabilities
                                                days/year
    of such events, it was not possible
    to quantify them in financial terms.        Offset by reduction in annual operating $25,300                 $28,000           $45,000
    Filling this gap is a research objective    cost of natural gas (boiler fuel)
    that is recognized by governments           Net change in annual revenue                   –$31,700         –$37,000          –$53,000
    and scientists, and there are efforts       Total undiscounted change in revenue           –$253,600        –$296,000         –$424,000
    underway to address it through              from present day to 2017
    various fora, such as the World
                                                Total discounted change in revenue             –$157,474        –$183,803         –$263,285
    Meteorological Organization and
                                                from present day to 2017 (12%
    the IPCC. Still, due to the rarity
                                                discount rate)
    of extreme climatic events and
    the complexities in understanding          Note: 2017 is the final year in Package’s current financial model. Rising temperatures will
    what drives changes in their               produce savings for Packages in the cost of its natural gas usage by increasing boiler efficiency.
    incidence, this will continue to be
    an area of uncertainty in climate risk
    assessments. Strategies for robust
    decision making on climate resilience
    need to be developed despite
    the limitations of this imperfect
    knowledge.

6                                                                        Climate Risk and Business | Practical Methods for Assessing Risk
ADAPTATION ACTIONS                           Instead, based on the levels of
                                             confidence in the various risk
The pilot studies made less progress         analyses, different risk management
in analyzing the costs and benefits          options were recommended for the
of adaptation actions to manage              clients to consider. In essence, where
the risks identified. This is because        there was high confidence in the
the appropriate adaptation actions           risk analyses, it was recommended
and associated costs for a given             that clients investigate the costs
client are highly specific to the            and benefits of adaptation
assets or processes being adapted,           actions. Where there was lower
and decisions on when it would be            confidence associated with the risk
appropriate to undertake action              assessments, a more exploratory
may depend on current and future             approach was suggested, including
regulatory positions, age, condition,        research, monitoring, field trials and
and operating regimes of existing            surveillance.
assets, as well as the client’s
investment plans.                            For some risk areas (such as malaria
                                             incidence affecting workers at
                                             GOPDC), the analysis showed that
                                             the effects of present-day climate
The appropriate                              variability on income were already
adaptation actions                           important. In these cases, it was
                                             recommended that the client should
and associated                               investigate actions that could
costs for a given                            be taken now to better manage
                                             climate-related impacts.
client are highly
specific to the                              Overall, the pilot studies have
                                             provided information on climate risks
assets or processes                          and recommendations on adaptation
                                             actions which the clients can
being adapted.                               incorporate into their mid- and long-
                                             term financial and operational plans.

Climate Risk and Business | Practical Methods for Assessing Risk                      7
Lessons learned, uncertainties,
gaps and barriers

In developing the pilot studies,
many issues were encountered that
                                             The Khimti 1 and GOPDC visits
                                             lasted for one and two weeks,
                                                                                       The clients
are common to all climate risk and           respectively. Each involved a             also found the
adaptation assessments and which will        workshop and in-depth meetings
be familiar to those who have been           with client staff responsible for         interaction with
involved in such studies. However,           managing financial, technical/            the study teams
there are also some aspects that             operational, environmental, and
are unique to undertaking these              social performance, as well as site       to be a fruitful
assessments with the private sector.         visits. These were vital in providing
                                             insights into existing climatic
                                                                                       experience, which
VALUE OF VISIT TO CLIENT                     vulnerabilities, sensitivities, and       helped to build
SITE AND STAKEHOLDER
ENGAGEMENT
                                             critical climate-related thresholds.
                                             The clients were also able to provide
                                                                                       their appreciation
                                             data and reports which were used to       of climate risk and
The three pilot studies were                 develop the climate risk assessments.
undertaken in sequence; Khimti 1                                                       its relevance to
was the first, followed by Packages
and then GOPDC. Each study
                                             Meetings with external parties as
                                             part of the visits, including national
                                                                                       their objectives.
gained from the experiences of               and local government officials,
earlier studies, and the GOPDC               research institutes, universities,
study was able to achieve the                community groups and public-              CLIMATE DATA
most. Owing to security concerns             service providers, were also very
in Pakistan, the visit to Packages           informative. These provided data          The climate data constraints
could not be undertaken, and                 and reports on the pilot study            encountered in the pilot studies
interaction between the client               sectors and their vulnerability to        are common to all climate risk
and the consultants was restricted           current climate conditions, as well as    assessments. They relate to
to telephone conferences and                 information on in-country research        uncertainties in data quality for
e-mail exchanges. It became                  on climate change and its impacts.        both observed and future climate
very apparent that this made a                                                         conditions.
considerable difference to the               The clients also noted that they
depth of analysis that could be              benefited from the experience of
achieved for Packages compared               being involved in the pilot studies and   Observed conditions
to Khimti 1 and GOPDC. In many               that it led to some changes in their
cases, the Packages pilot study              activities. For instance, for GOPDC       Ideally, robust climate risk
was therefore based on generic               the work was a stimulus for them to       assessments should be undertaken
published information in the                 begin to monitor climatically sensitive   by drawing on long-term (at least
scientific and engineering literature        issues, to correlate some aspects         30-year), high-quality records of all
rather than on client-specific               of performance against climatic           relevant climate statistics, measured
information.                                 factors, and to engage with other         at the project site. In practice, such
                                             stakeholders who held information         data sets are seldom available, and
                                             about risks.                              it is often necessary to utilize data
                                                                                       collected at meteorological stations

Climate Risk and Business | Practical Methods for Assessing Risk                                                                9
operated by national meteorological        Figure 6: Average Monthly Maximum and Minimum Air Temperatures (°C) for
     agencies, which may not be                 Jiri and Janakpur Meteorological Stations, 1971–2000
     representative of the project site.
                                                                        40
     This is exemplified in the Khimti                                  35
     1 pilot study. Observed monthly

                                                  Temperature (deg C)
                                                                        30
     temperature data for the two closest
                                                                        25
     meteorological stations to the project
     site, Jiri and Janakpur, are shown in                              20
     Figure 6. Jiri and Janakpur are both                               15
     approximately 20 km (north and                                     10
     south, respectively) from Khimti 1                                  5
     power station, at altitudes of about                                0
     2,000 m and 78 m. The Khimti 1
                                                                        -5
     power station is at an altitude of                                      Jan   Feb   Mar    Apr   May    Jun    Jul   Aug    Sep    Oct   Nov      Dec
     approximately 700 m. As can be seen
                                                                                                              Month
     in Figure 6, the differences in altitude                                      Average monthly max                        Average monthly min
     result in considerable differences                                            temps Jiri (1971-2000)                     temps Jiri (1971-2000)
     in the climate data recorded at                                               Average monthly max                       Average monthly min
     each meteorological station. The                                              temps Janakpur (1990-2000)                temps Janakpur (1990-2000)
     catchment area for the Khimti Khola
     River (on which the hydropower             Furthermore, in order to undertake a                                “The understanding of
     scheme relies) is in very mountainous      climate risk assessment it is important                             anthropogenic warming and
     terrain, over which there is great         to understand the natural variability in                            cooling influences on climate
     variation in climate conditions. To        climate conditions onto which climate                               has improved since the TAR
     undertake a climate risk assessment        change effects will be superimposed.                                [Third Assessment Report],
     of future changes in river flow,           For instance, where climate change                                  leading to very high confidence
     it is first necessary to develop a         leads to decreases in precipitation,                                that the global average net
     model that relates observed climatic       these decreases would be exacerbated                                effect of human activities since
     conditions and observed river flows.       in a dry year in the future, leading to                             1750 has been one of warming
     Building such a model in an area           potentially severe impacts, whereas                                 (IPCC 2007b, “Technical
     where the baseline climate is highly       they might be counteracted in a                                     Summary,” sec. 2.5).”
     spatially variable over a small area is    wetter year. In general, precipitation is
     challenging.                               highly variable from year to year (see,                             “Warming of the climate system
                                                e.g., the data from Lahore, Pakistan,                               is unequivocal, as is now evident
     Ideally, robust                            in Figure 7), whereas variability in
                                                temperature tends to be lower. In
                                                                                                                    from observations of increases
                                                                                                                    in global average air and ocean
     climate risk                               practice, however, given constraints                                temperatures, widespread

     assessments should                         on the resources available for the pilot
                                                studies, the climate risk assessments
                                                                                                                    melting of snow and ice, and
                                                                                                                    rising global average sea level
     be undertaken                              were generally performed by                                         (IPCC 2007a, sec. 1.1).”
                                                superimposing future climate change
     by drawing on                              scenarios onto the average baseline                                 For the next two decades, a
     long-term (at least                        climate conditions.                                                 warming of about 0.2oC per
                                                                                                                    decade is projected for a range
     30-year), high-                            Scenarios of future climate                                         of SRES4 emission scenarios.
     quality records of                         change
                                                                                                                    “Anthropogenic warming and
     all relevant climate                       The IPCC Fourth Assessment Report                                   sea level rise would continue
                                                makes it clear that man-made                                        for centuries due to the time
     statistics, measured                       climate change has been underway                                    scales associated with climate
     at the project                             for decades and will continue for
                                                decades to come:
                                                                                                                    processes and feedbacks, even if
                                                                                                                    greenhouse gas concentrations
     site. In practice,                                                                                             were to be stabilised (IPCC
     such data sets are                                                                                             2007a, sec. 3).”

     seldom available.                          4. Special Report on Emissions Scenarios; IPCC 2007a, “Summary for Policymakers”

10                                                                                       Climate Risk and Business | Practical Methods for Assessing Risk
Figure 7: Observed Monthly Precipitation at Lahore (top) and Time-Series of                                           How global climate change will
    Winter (Dec/Jan/Feb/Mar) Precipitation at Lahore (bottom), 1861–2008                                                  translate at the local level. To some
                                                                                                                          extent, this can be analyzed by
           300
                  This chart shows average monthly precipitation
                  over this 150-year record, with 10% and 90%
                                                                                                                                   90%risks based on a wide
                                                                                                                          investigating
                  precipitation amounts shown using error bars.                                                           range of global (coarse-scale) and
                                                                                                                          regional10%
           250
                  Natural variability in rainfall is very high in this                                                              (finer-scale) climate models
                  region, particularly during the rainy season.
           200    For 10 months of the year the 10th percentile                                                           and/or using statistical downscaling
                                                                                                                                   2005
mm/month

                  precipitation amount is zero.                                                                           techniques. At present, there are
           150                                                                                                            many global
                                                                                                                                   2004 climate models to draw
                                                                                                                          from, but far fewer regional models.
           100                                                                                                                     2003 in some parts of the
                                                                                                                          Furthermore,
                                                                                                                          world the global climate models
                                                                                                                                   2002
            50                                                                                                            are not good at simulating baseline
                                                                                                                          climate 2001
                                                                                                                                   conditions, nor are they
             0                                                                                                            in agreement about projections
                 Jan

                         Feb

                                    Mar

                                              Apr

                                                         May

                                                                   Jun

                                                                            Jul

                                                                                     Aug

                                                                                               Sep

                                                                                                        Oct

                                                                                                              Nov

                                                                                                                    Dec
                                                                                                                          of future2000
                                                                                                                                     changes, particularly in
                                                                         Month                                            relation to precipitation (see Figure
                       Average (50%) precipitation by month (in mm). Bars show 10% and 90%
                                                                                                                          2 above1999
                                                                                                                                    for an example). These
                                  precipitation amounts over the 1901-1970 period                                         kinds of model uncertainties are not
                                                                                                                                   1998
                                                                                                                          untypical, particularly in areas where
                                            Data from this long-term precipitation record show no
           250
                                            discernible trend in winter precipitation. There is, however, a
                                                                                                                          the topography
                                                                                                                                   1997      is complex (highly
                                            slight upward trend in precipitation during the summer and                    mountainous regions or coastal areas)
                                            rainy season for Lahore City.                                                          1996 with monsoon or
           200
                                                                                                                          and in regions
                                                                                                                          tropical climates. According to the
                                                                                                                                   1995
                                                                                                                          IPCC’s Fourth Assessment Report:
mm/month

           150
                                                                                                                                  1994
                                                                                                                          “There are substantial inter-model
           100                                                                                                            differences in representing monsoon
                                                                                                                          processes, and a lack of clarity over
                                                                                                                          changes in ENSO [El Niño Southern
            50
                                                                                                                          Oscillation] further contributes to
                                                                                                                          uncertainty about future regional
             0                                                                                                            monsoon and tropical cyclone
                 1861
                 1865
                 1869
                 1873
                 1877
                 1881
                 1885
                 1889
                 1893
                 1897
                 1901
                 1905
                 1909
                 1913
                 1917
                 1921
                 1925
                 1929
                 1933
                 1937
                 1941
                 1945
                 1949
                 1953
                 1957
                 1961
                 1965
                 1969
                 1973
                 1977
                 1981
                 1985
                 1989
                 1993
                 1997
                 2001
                 2005

                                                                                                                          behaviour. Consequently, quantitative
                                                                          Year                                            estimates of projected precipitation
                                                    Total winter (DJFM) precipitation (mm/month)                          change are difficult to obtain” (IPCC
    Source: KNMI (Royal Netherlands Meteorological Institute), available online at http://climexp.knmi.nl                 2007b, sec. 11.4).

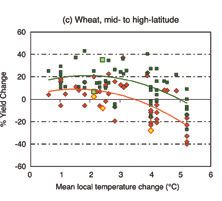
    There is high confidence that the                                      Nevertheless, in any given location,           Coarse spatial resolution of climate
    climate in the coming decades                                          there are uncertainties about                  models. Because of the coarse spatial
    will change rapidly and will not                                       precisely what future climate                  resolution (typically 2.5o x 2.5o) of
    be like the relative stable climate                                    conditions will be experienced, and            the grid used in GCMs, they provide
    of the recent past. In particular,                                     approaches have been developed                 “smoothed” estimates of future
    projected temperature changes                                          by climate scientists to characterize          changes. However, if the topography
    are well characterized, and                                            these, as have approaches to robust            within an individual 2.5o x 2.5o grid
    agreement between the different                                        decision making in the face of these           square is highly variable (as is the case
    climate models is generally good.                                      uncertainties. The key dimensions              for the location of Khimti 1), then the
    Additionally, changes in future                                        of uncertainty are outlined below,             local changes may be higher or lower
    emissions of greenhouse and other                                      along with discussion of how                   than the smoothed estimates. The
    gases that affect the climate can                                      each dimension could be better                 recommended approaches to tackling
    be understood with relatively high                                     understood.                                    this are to generate downscaled
    confidence on the timescales of                                                                                       projections using regional climate
    relevance to the private sector by                                                                                    models or statistical downscaling tools,
    using a range of emissions scenarios                                                                                  driven by multiple GCMs. However,
    in risk assessments.                                                                                                  in areas where the global climate
                                                                                                                          models are not in agreement, there

    Climate Risk and Business | Practical Methods for Assessing Risk                                                                                                  11
is little to be gained by undertaking       Figure 8: Seasonal Yield Cycles in Different Countries Compared to Seasonal
     downscaling. This was deemed to be          Yields at GOPDC, Kwae Plantations, for 1988–97 Years of Harvest
     the case for all three pilot studies.                                                                                           Percentage of annual total yield in each month at Kwae
                                                                                                                                     (averaged across 1988 - 1997 YOH)

     Changes in climatic extremes and                                                                                          20%
     timescales of projections. To evaluate                                                                                    18%
     the full range of risks posed by
                                                                                                                               16%
     climate change to an investment, it

                                                                                       Percent of annual total in each month
     is important to consider changes in                                                                                       14%

     both long-term average and extreme                                                                                        12%

     climatic conditions. However, in                                                                                          10%
     general, there is very little information
                                                                                                                               8%
     available on changes in extremes
     (e.g., 1-in-100-year storm-surge                                                                                          6%

     height, maximum hourly rainfall                                                                                           4%

     intensity), and what is available is                                                                                      2%

     often only for the end of the 21st                                                                                        0%
     century. There are various reasons for                                                                                           JAN FEB MAR APR MAY JUN JULY AUG SEPT OCT NOV DEC
                                                                                                                                                             Month
     this information gap, including a lack
     of data on observed extreme events
                                                                                                                                                              Average tonnes %
     (by nature of their rarity), which          Source: Adapted from Corley and Tinker 2003
     constrains the ability of climatologists
     to understand how they may change           help to develop understanding of the                                                   regions with more uniform climates,
     in the future, as well as limitations in    relationships between climatic factors                                                 such as Malaysia. This annual cycling
     the amount of climate model data            and their impacts on different systems                                                 is reported to have a large influence
     that are stored by meteorological           and can build generic system models.                                                   on yield even in regions that lack
     offices around the world. It is clear       Second, provided that such models                                                      marked seasonal variations in climatic
     that additional investment in research      are made accessible, private-sector                                                    factors, and it also persists in irrigated
     by public-sector organizations could        stakeholders can adapt them to better                                                  conditions. Figure 8 compares the
     be usefully targeted to addressing          represent the specific conditions for                                                  seasonal yield cycles in four oil-
     this important gap.                         their investments.                                                                     palm-producing countries to that
                                                                                                                                        at GOPDC, demonstrating that in
     ASSESSMENTS OF RISK TO                      To appreciate this complexity, consider                                                addition to seasonal variability within
     INVESTMENT PERFORMANCE                      the analyses of the relationships                                                      each country, there is also significant
                                                 between oil palm yield at GOPDC                                                        variation in the yield cycle across
     As noted, evaluating climate change         and the climatic and nonclimatic                                                       countries. This means that in order to
     risks to the performance of the pilot       factors which influence it. In general,                                                fully understand the range of factors
     study projects required understanding       oil palm yield is affected by a range                                                  affecting oil palm yield in any given
     the relationships between                   of nonclimatic factors, including                                                      location, a specific model must be
     climatic factors and the aspects of         palm age, soil type, seed type and                                                     developed for that country.
     performance being considered. In            management practices. Yield is also
     most cases for the pilot studies,           affected by the abundance of oil palm                                                  Complexity is further compounded
     this required knowledge which               pollinators and outbreaks of pests                                                     by the numerous stages in the
     was not already available. Where            and diseases, both of which can be                                                     development of oil palm fruits (from
     possible, within the resource and           influenced by climate. Disentangling                                                   which crude palm oil is extracted), each
     data constraints of the pilot studies,      these influences is a major research                                                   of which is differently vulnerable to
     statistical models were constructed         undertaking, and it appears that no                                                    climatic conditions. Table 3 summarizes
     to represent these relationships.           model currently exists which captures                                                  the stages which determine the final
     However, the development of                 all these factors.                                                                     inflorescence and bunch characteristics
     system models is often fraught with                                                                                                of oil palm, as reported in different
     complexity, and uncertainties about         Furthermore, large seasonal variations                                                 studies. It is clear that there is much
     system response to climatic and             in oil palm yield are expected in                                                      variation in the lengths of oil palm
     nonclimatic factors constrain the           regions such as West Africa, where                                                     development stages reported in the
     robustness of these assessments.            severe dry periods are common.                                                         literature, so attempts to correlate
     There are two stakeholder groups who        However, researchers have reported                                                     observed climate data to oil palm yields
     can help to address these constraints.      that similar, though less extreme,                                                     are difficult to undertake.
     First, publicly funded research can         seasonal variations are also evident in

12                                                                       Climate Risk and Business | Practical Methods for Assessing Risk
ANALYSIS AND                                  TABLE 3: DEVELOPMENT STAGES OF OIL PALM FRUIT COMPONENTS,
RECOMMENDATIONS ON                            ACCORDING TO VARIOUS STUDIES
ADAPTATION ACTIONS
                                                                       Approximate months before harvest
As is clear from the preceding
discussion, undertaking robust risk
assessments for the pilot studies                                      Breure and       Oboh and        Corley and Tinker
was a complex process, and                                             Menendez         Fakorede        2003, various
future improvements will require              Development stage        1990, Malaysia   1990, Nigeria   studies/locations
investment in research at all steps           Inflorescence initiation 38               —               44 (Ivory Coast). Corley
in the risk assessment chain. Until                                                                     also found a range
these uncertainties are better                                                                          of 26–37 months for
resolved, it can be difficult to justify                                                                different clones.
expenditure on physical adaptation            Sex determination        18               30              21–29
actions to clients. For instance,
                                              Inflorescence abortion   11               11              9 –10
design standards for assets aimed at
                                              Flowers per spikelet     19               —               12–15
preventing pollution from facilities
are often based on extreme events             Spikelet number          24               17–24           Within 9 months
(e.g., site drainage systems and mine         Frame weight (stalk      7–9              —               No clear response
tailings dams are designed based              plus spikelet)
on anticipated extreme precipitation          Anthesis and fruit set   6                —               5
amounts), but until there is better
understanding of how the intensity
or frequency of such events will             For some of the systems evaluated
change in the future, it would not           in the pilot studies, the study teams      Undertaking robust
be sensible to propose that a client
upgrade existing infrastructure. There
                                             were able to work with the client to
                                             develop a sound understanding of
                                                                                        risk assessments
are, however, often opportunities            the risks, which provided a good basis     for the pilot studies
to build in resilience against future
climate changes at lower cost when
                                             for decision making on adaptation.
                                             The strongest examples of this relate      was a complex
designing new facilities.                    to risks associated with increases in      process, and future
                                             average temperatures, which affect
                                             power production at Packages and           improvements will
                                             refinery output at GOPDC (as shown
                                             in Table 2 and Figure 5 above).
                                                                                        require investment
                                                                                        in research at all
                                                                                        steps in the risk
                                                                                        assessment chain.

Climate Risk and Business | Practical Methods for Assessing Risk                                                                   13
General results and conclusions

MOST SIGNIFICANT RISKS                       •    Systems are highly sensitive to      Water resources are a key
AND UNCERTAINTIES                                 changes in climatic factors.         concern
                                                  For instance, GOPDC’s refinery
In general, on the timescales of                  and fractionation plants are         A feature of all the pilot studies (in
relevance to private sector investments,          sensitive to small increases in      common with the majority of private
changes in monthly, seasonal, or                  cooling water temperature,           sector investments) is their reliance
annual average climate conditions                 which reduce the effectiveness       on water resources.
are small (on the order of 1oC–2oC                of vacuum-producing systems
temperature increases and +/– 5 to 10             and extend crystallization times.    Khimti 1 hydropower scheme river
percent changes in precipitation). As a           Hence, production rates of           flows. For Khimti 1, clearly, the
result, the pilot study analyses indicate         olein and stearin are reduced.       output of the hydropower scheme
that the most significant risks on these          Variations in temperature from       is dependent on flows in the Khimti
timescales are where:                             day to night already have            Khola River. Owing to uncertainties
                                                  significant impacts on crude         about future changes in rainfall and
•   Existing climatic vulnerabilities             palm oil throughput at the           about modeling the impacts of these
    may be exacerbated and critical               refinery when cooling water          changes on river flows, it was not
    thresholds crossed.                           temperatures exceed the design       possible to determine with confidence
    For instance, for the Khimti 1                threshold of 32oC. Throughput        how climate change will affect flows.
    hydropower scheme, HPL is                     can be 20 percent lower in the       The variations projected for the
    under an obligation to maintain               daytime, when it is hotter. In       2020s, using four climate models and
    dry-weather flows in the Khimti               future, the vacuum systems           three emissions scenarios, are shown
    Khola River above certain levels              are expected to become less          in Figure 9. From the point of view of
    downstream of the Khimti 1                    effective as temperatures rise       power production, changes in flows
    intake. If climate change were                (see Figure 5 earlier), and          in the dry season are the most critical,
    to lead to greater incidence of               crystallization times will extend,   because monsoon flows exceed
    low flows, then the requirement               leading to a reduction in olein      Khimti 1 capacity by a large margin.
    to meet this critical threshold               and stearin output. An extra         In the dry months, the modeling
    could affect the power produced               cooling tower has recently           indicates that flows could change by
    at Khimti 1. In actual fact, the              been installed at GOPDC to           about +/– 10 percent by the 2020s.
    modeling undertaken in the                    serve the refinery. This will        It should be noted that the model
    Khimti 1 pilot study did not                  help to reduce the impact of         outputs become more consistent over
    indicate that the risk of flows               rising temperatures on refinery      time; by the 2050s there is a clearer
    falling below this threshold would            output, though it will not           indication of an increase in dry-season
    be exacerbated in the future.                 completely eliminate it.             flows.

Climate Risk and Business | Practical Methods for Assessing Risk                                                                  15
A feature of all the                     Figure 9: Monthly Projections of Stream Flow at Rasnalu Flow Gauging Station
                                              (close to Khimti 1 intake), under Four GCMs for the 2020s, Using Empirical
     pilot studies (in                        River Flow Models

     common with the
     majority of private                                                             80                                                                                                                                                         15%

                                                                                                                                                                                                                                                       Change in monthly average streamflow (%)
                                              NB Monthly average streamflow (m3/s)
                                                                                     70                                                                                                                                                         10%
     sector investments)                                                             60
                                                                                                                                                                                                                                                5%
     is their reliance on                                                            50
                                                                                                                                                                                                                                                0%
     water resources.                                                                40
                                                                                     30
                                                                                                                                                                                                                                                -5%

                                                                                                                                                                                                                                                -10%
                                                                                     20
     Groundwater at Packages and                                                     10                                                                                                                                                         -15%
     GOPDC. Both Packages and GOPDC                                                   0                                                                                                                                                         -20%
     rely on groundwater for their
                                                                                             Magh
                                                                                          (Jan-Feb)
                                                                                                         Falgun
                                                                                                      (Feb- Mar)
                                                                                                                     Chairta
                                                                                                                   (Mar- Apr)
                                                                                                                                   Baishak
                                                                                                                                (Apr- May)
                                                                                                                                                Jestha
                                                                                                                                             (May-Jun)
                                                                                                                                                            Ashad
                                                                                                                                                         (Jun -Jul)
                                                                                                                                                                       Srawan-
                                                                                                                                                                      (Jul-Aug)
                                                                                                                                                                                    Bhadra-
                                                                                                                                                                                  (Aug- Sep)
                                                                                                                                                                                                  Ashoj-
                                                                                                                                                                                               (Sep-Oct)
                                                                                                                                                                                                               Kartik
                                                                                                                                                                                                           (Oct-Nov)
                                                                                                                                                                                                                           Marg-
                                                                                                                                                                                                                        (Nov Dec)
                                                                                                                                                                                                                                       Poush
                                                                                                                                                                                                                                    (Dec-Jan)
     industrial operations (pulp and
     paper production at Packages, and
     production of crude palm oil and
                                                                                          Ave Observed streamflow                                                        GFDL-CM2.0, 2005 - SRES A2 (10-yr mean) (% change)
     olein and stearin at GOPDC’s mill
                                                                                          GFDL-CM2.0, 2005 - SRES A2 (10-yr mean)
     and refinery). For Packages, growth                                                                                                                                 CGCM3.1(T63), 2005 - SRES B1 (% change)
                                                                                          CGCM3.1(T63),2005 - SRES B1
     of wheat straw, which is one of the                                                  CSIRO-Mk3.5 - SRES A2
                                                                                                                                                                         CSIRO-Mk3.5 - SRES A2 (% change)
     inputs to its pulp and paper mills,                                                  GISS-ER, 2004 - SRES A1B                                                       GISS-ER, 2004 - SRES A1B (% change)
     also relies on groundwater irrigation,
                                              Note: Projections are for Nepalese months, as shown on the x-axis.
     and GOPDC’s oil palm nursery is
     irrigated using groundwater.             Figure 10: Factors Affecting the Way Human Activities Impact Freshwater Resources

     These dependencies mean that
     any changes in the availability of                                                                                                                                                                  Water
                                                                                                         Greenhouse                                          Climate
     groundwater resources could pose                                                                                                                                                                 quantity and
                                                                                                        gas emissions                                        change
                                                                                                                                                                                                        quantity
     significant risks to the investments.
     Yet the pilot studies indicate that
     the vulnerabilities of these resources
     to climatic and nonclimatic factors                                     Population,
                                                                                                                                                                                                                                   Water
                                                                              lifestyle,
     are not currently well understood.                                       economy,
                                                                                                                                                            Land use                                                             resources
     The complex links between climate                                                                                                                                                                                          management
                                                                             technology
     change and other factors influencing
     water supply and demand are
     highlighted in Figure 10.
                                                                                                                                                                                                            Water
                                                                                                                                                                                                           demand
     Groundwater is something of a
     hidden resource, by virtue of its not
                                              Source: Modified from Oki 2005
     being visible. While both Packages
     and GOPDC monitor groundwater
     levels in boreholes, neither company       the aquifers they are using to better                                                                                     emissions scenarios. The results of
     has undertaken a wider assessment          understand the factors that influence                                                                                     this risk assessment are presented
     of the climatic and nonclimatic            their recharge. Based on such                                                                                             in Figure 11. As shown in the
     factors influencing the aquifers that      surveys, models of the aquifers could                                                                                     figure, the majority of the model
     they are using. Improved long-term         be constructed to provide the basis                                                                                       runs indicate a future increase in
     monitoring could include researching       for future resource management.                                                                                           groundwater recharge. Using the
     the relationship between borehole                                                                                                                                    Amritsar groundwater model, 77
     water levels and climatic variables,       To evaluate risks from climate                                                                                            percent of the model results show
     considering time delays between            change for groundwater recharge                                                                                           an increase for the 2020s, and 67
     climatic events and their impacts on       at Packages, the pilot study used                                                                                         percent do for the 2040s. Using
     groundwater levels. The companies          two groundwater models, driven                                                                                            the CATCHMOD model, about 88
     could also consider commissioning          by climate change scenarios from                                                                                          percent of the model projections
     surveys of the catchment areas for         multiple GCMs, under three                                                                                                show an increase in both time

16                                                                                                                        Climate Risk and Business | Practical Methods for Assessing Risk
periods. This is because nearly 75           Figure 11: Frequency of Projected Groundwater Recharge, as Calculated Using
percent of precipitation in the region       Two Groundwater Modeling Methods
falls during the monsoon season,
and this is when most of the natural                                   10

                                              Model result frequency
recharge occurs, through water
                                                                        8
being absorbed into the soil rather
than evaporating. Most of the                                           6
climate models project an increase in                                   4
monsoon-season precipitation.
                                                                        2
While this kind of assessment is                                        0
very useful for characterizing the                                          -40 -20 0     20 40 60 80 100 120 140 160 180 200 220 240 260 280 more
uncertainties in future recharge,                                                       Percent change in recharge (Amritsar) for the 2020s
it is important to note that to
understand fully future risks, changes                                 SRES A1B (13 models)             SRES A2 (13 models)         SRES B2 (13 models)
in groundwater demand by Packages                                       6
                                             Model result frequency
and other users (e.g., for crop
                                                                        5
irrigation) related to climate and
socioeconomic changes need to be                                        4
evaluated.                                                              3
                                                                        2
Low-probability / high-                                                 1
consequence events
                                                                        0
                                                                            -40 -20 0     20 40 60 80 100 120 140 160 180 200 220 240 260 280 more
There are significant unknowns                                                   Percent change in recharge (CATCHMOD) for the 2020s
regarding future changes in the
occurrence of low-probability                                          SRES A1B (13 models)             SRES A2 (13 models)         SRES B2 (13 models)
(extreme) / high-consequence events.
These could represent the highest                                      10
                                              Model result frequency

risks to the pilot study clients, but it                                8
was not possible to evaluate their
                                                                        6
significance. The notable examples of
these from the Khimti 1 and GOPDC                                       4
pilot studies are highlighted in Table 4.
                                                                        2

Further research and monitoring to                                      0
                                                                            -40 -20 0     20 40 60 80 100 120 140 160 180 200 220 240 260 280 more
help evaluate the significance of these
                                                                                        Percent change in recharge (Amritsar) for the 2040s
risks, though challenging, would be
very worthwhile, because when these
                                                                       SRES A1B (13 models)             SRES A2 (13 models)         SRES B2 (13 models)
unlikely events occur, they can have
very large financial consequences.                                     10
                                             Model result frequency

For GOPDC, a single outbreak of
the leaf miner (a pest which causes                                     8
widespread defoliation of oil palms)                                    6
could lead to revenues not earned of
$1.8 million. An outbreak occurred                                      4
at GOPDC’s plantation in 1987,                                          2
and 13,000 tons of oil palm fresh
fruit bunches (from which the palm                                      0
                                                                            -40 -20 0     20 40 60 80 100 120 140 160 180 200 220 240 260 280 more
oil is extracted) were lost. The leaf                                            Percent change in recharge (CATCHMOD) for the 2040s
miner is known to be sensitive to
temperature, rainfall and carbon                                       SRES A1B (13 models)             SRES A2 (13 models)         SRES B2 (13 models)
dioxide concentrations, but there is
little information on these sensitivities,
                                             Note: Projections for the 2020s are shown in the top two figures and for the 2040s in the
and the impacts of climate change on         bottom two figures.
leaf miner incidence have not been
researched in any depth.

Climate Risk and Business | Practical Methods for Assessing Risk                                                                                          17
TEMPERATURE-RELATED                    TABLE 4: LOW-PROBABILITY / HIGH-CONSEQUENCE EVENTS FOR KHIMTI 1
     IMPACTS ON INDUSTRIAL                  AND GOPDC
     PROCESSES CAN BE WELL
                                            Khimti 1                                                          GOPDC
     CHARACTERIZED
                                            Extreme flood event on Khimti Khola and                           Oil palm pest or disease outbreak
     As noted above, climate models are     Tami Koshi rivers                                                 Loss of natural oil palm pollinator
     generally in good agreement about      Landslide blocking Khimti Khola River and
     future increases in temperature.       access road to site
     The impacts of rising temperatures     Glacial lake outburst flood
     on industrial processes at GOPDC
     and Packages were evaluated with       In the case of GOPDC, one financial                                Packages generates power on-site and
     a higher degree of confidence          impact associated with rising                                      sells surplus power to the grid. The
     than other issues, because the         temperatures is the reduction in                                   condensing steam turbine efficiency
     relationships between temperature      olein and stearin production (see                                  at the power plant is slightly reduced
     and process performance are well       Figure 5 above). The relationship                                  by temperature increases, and again,
     understood. In general, industrial     between temperature and                                            the relationship is well understood (see
     equipment that generates heat (e.g.,   production rates was recorded on-                                  Figure 12). This information allows a
     turbines, compressors, motors) is      site by GOPDC’s refinery production                                highly confident projection of a small
     likely to see some efficiency losses   manager and was established with a                                 reduction in Packages’ future income
     due to the higher temperatures         high degree of confidence.                                         from power sales (as shown above in
     expected under climate change.                                                                            Table 2).

     Further research                       Figure 12: Power Output of Packages’ 41 MW Siemens Condensing Steam
     and monitoring                         Turbine with Double Extraction vs. Cooling Water Temperature

     to help evaluate                                           37   Efficiency=75%

     the significance of                                             Power factor=0.85 NB

     these risks, though                                        36

     challenging, would
                                             Power output, MW

                                                                35
     be very worthwhile,
     because when                                               34

     these unlikely
     events occur, they                                         33
                                                                                   Baseline cooling water temperature

     can have very                                              32
     large financial                                             31.8 32.0 32.2 32.4 32.6 32.8 33.0 33.2 33.4 33.6 33.8 34.0

     consequences.                                                                          Cooling water temperature, ºC

18                                                                                Climate Risk and Business | Practical Methods for Assessing Risk
FROM UNCERTAINTY                             Figure 13: Quality of Knowledge of Climate Change Risks to GOPDC
TO RISK

Risk is a function of two dimensions:

                                                                         Good
the probability of a hazard and the
                                                                                 Ambiguity about the risk e.g.          Good knowledge of the risk e.g.
magnitude of its consequence. The
quality of knowledge of each of                                                  • uncertain or unknown impacts         • unchanging climate
these dimensions is a measure of                                                 • no impact models                     • good historical data
how well a risk is understood (see                                               • uncertain how to value               • good impact models
                                                                                   consequences                         • short term prediction
Figure 13).                                                                      • lack of concern

As outlined earlier, information

                                              Knowledge of probability
on future changes in extreme
climatic events is scarce, and there
is uncertainty in all the pilot studies
locations about whether seasonal
average precipitation will decrease or
increase in the future—the quality of                                             Ignorance about the risk e.g.         Impacts well defined but
knowledge about the probability of                                                                                      probability uncertain e.g.
                                                                                  • rapidly changing climate
these changing hazards is poor.                                                   • new/unknown processes               • poor knowledge of likelihood
                                                                                  • complex dependencies, such as         of damage
For some of the issues explored in the                                              non-linearity                       • good impact/process models
pilot studies, there was little evidence                                          • longer term forecast                • well defined impacts if event
                                                                                  • insufficient data                     occurs
about how the system would be                                                     • climate surprises                   • longer term assessment
affected by changes in climate. For
instance, literature is lacking on how
                                                                         Poor

the presence of GOPDC’s natural oil
palm pollinator and the leaf miner
pest are correlated with climatic                                               Poor                                                                      Good
                                                                                                       Knowledge of consequence
factors. Yet, total loss of the pollinator
would have an estimated financial            Source: Willows and Connell 2003
impact for GOPDC of more than
$1 million per annum. A major leaf
miner outbreak could lead to revenues        On the other hand, temperature-                                        The potentially significant financial
not earned of $1.8 million per annum.        related risks to industrial operations at                              consequences outlined above provide
Lack of availability of groundwater at       GOPDC could be quantified with some                                    a strong signal on the areas where
GOPDC would lead to the mill and             precision, because both the probability                                future efforts to reduce uncertainties
refinery being shut down, but the            of the hazard and the magnitude of its                                 should be focused, so that risks can
sensitivity of this resource to climate      consequence were known with a good                                     be better understood and appropriate
change is unknown.                           degree of confidence.                                                  adaptation actions undertaken.

Climate Risk and Business | Practical Methods for Assessing Risk                                                                                                 19
Annex 1: A risk-based approach

Figure 14 illustrates the risk-               Figure 14: Climate Risk Assessment and Management Framework Used in the
uncertainty decision-making                   Pilot Studies
framework which forms the basis
                                                                                      How can we ensure that the
of the pilot study methodology. The                                                   investment continues to deliver
framework was developed by the                                                        successfully on its objectives in the
U.K. Climate Impacts Programme                                                        face of climate change?
(UKCIP) and the U.K. Environment                                                      What are the opportunities from
                                              What is the investment                  climate change for the investment?                                What are the
Agency (Willows and Connell 2003).            aiming to achieve?                                                                                        success criteria for
It sets out eight stages, of which the                                                                                                                  assessing risks and
first six were followed in the studies.                                          1 Identify problem
                                                                                   and objectives
                                                                                                                                                        adaptation
The key questions addressed at each                                                                                                                     options? (Consider
                                                                                                                                                        critical climate-
stage of the process are shown on                                                                              2 Establish decision-
                                                                                                                                                        related thresholds
                                                                                                                 making criteria,
the figure.                                       8 Monitor                                                      receptors, ex posure units and         and sensitivities,
                                                                                                                 risk assessment endpoint s
                                                                                                                                                        legislation, cost,
Stages 5 and 6 were explored                                                                                        3 Assess ri sk
                                                                                                                                                        risk attitude etc.)
in less depth than stages 1–4,                                                                                                                              What are the
because these later stages required                                                                                                                         climate-
knowledge of the costs and benefits            7 Implement                                                                                                  related risks
                                                  decision
of adaptation options, which was                                                                                                                            to success (as
                                                                                                  5 Appraise                            4 Identify          defined in
not readily available.                                                                              options                              options
                                                                                                                                                            Stage 2) using
                                                                                                                                                            best available
                                                                       No                 No                                                                climate data?
In practical terms, the pilot studies
                                                                 Yes
involved:                                                            Pr oblem
                                                                     defined       Yes   Criteria met ?
                                                                    correctly?                            How well do the                            What are the
•   a visit to the project site (except                                                                   adaptation options                         adaptation options
                                                                 6 Make decisio n
                                                                                                          perform against the                        that should be
    in the case of Packages),                                                                                                                        considered to
                                                                                                          success criteria (as
•   meetings with the IFC client,                             What are the ‘best’                         defined in Stage 2)?                       address the risks
    to discuss climatic sensitivities                         adaptation options for                                                                 identified in Stage 3?
                                                              the investment?
    and vulnerabilities, obtain data,
    reports, and so forth,                   Source: Willows and Connell 2003
•   meetings with in-country
    sector experts and climate
    change experts from the public           The specific risk areas considered
    sector, research institutions,           varied from study to study (see Table
    universities, and community              1 above), but in general terms,
    groups,                                  all the studies aimed to provide
•   literature reviews and qualitative       a holistic approach by analyzing
    analysis of impacts, and                 risks to the technical/operational,
•   quantitative assessments of              environmental, social and financial
    impacts, where possible.                 performance of the investments.

Climate Risk and Business | Practical Methods for Assessing Risk                                                                                                               21
You can also read