Clinical Development Success Rates and Contributing Factors 2011-2020
←
→
Page content transcription
If your browser does not render page correctly, please read the page content below

Clinical Development
Success Rates and
Contributing Factors
2011–2020
About BIO
BIO is the world’s largest trade association representing biotechnology companies, academic institutions, state
biotechnology centers, and related organizations across the United States and in more than 30 other nations.
BIO members, from the entrepreneurial to the Fortune 500 multinationals, are involved in the research and
development of innovative healthcare, agricultural, industrial, and environmental biotechnology products.
BIO also produces industry-leading investor and partnering events to strengthen the innovator ecosystem.

About Informa Pharma Intelligence
Biomedtracker, a subscription-based product of Informa Pharma Intelligence, tracks the clinical development
and regulatory history of investigational drugs to assess their Likelihood of Approval (LOA) by the FDA.
Biomedtracker is populated in near real-time with updated information from press releases, corporate
earnings calls, investor and medical meetings, and numerous other sources. These data can be visualized,
analyzed, and interpreted in the specifically designed R&D benchmarking tool Pharmapremia. This provides
an exclusive window into drug development pipelines and paints a fuller, clearer picture of how the industry
is performing. For more information visit www.pharmaintelligence.informa.com.

About QLS Advisors
QLS Advisors LLC is a technology and advisory company based in Cambridge, MA, dedicated to fostering
innovation in the life sciences. QLS employs a unique blend of fundamental and quantitative tools to help
clients manage risk, assess reward, and develop investment and financing strategies for portfolios of
healthcare-related assets. For more information visit www.qlsadvisors.com.

2/ February 2021                                © BIO | QLS Advisors | Informa UK Ltd 2021 (Unauthorized photocopying prohibited.)
Executive Summary
This is both an updated study of clinical drug development success rates from our 2016 report, and an
expansion into the drivers of success with the addition of machine learning modeling to analyze the predictive
factors contributing to drug development. A total of 12,728 clinical and regulatory phase transitions were
recorded and analyzed from 9,704 development programs over the last decade (2011–2020), across 1,779
companies in the Biomedtracker database. Phase transitions occur when a drug candidate advances into
the next phase of development or is suspended by the sponsor. By calculating the number of programs
progressing to the next phase vs the total number progressing and suspended, we assessed the success rate
at each of the four phases of development: Phase I, II, III, and regulatory filing. Having phase-by-phase data
in hand, we then compared groups of diseases, drug modalities, and other attributes to generate the most
comprehensive analysis yet of biopharmaceutical R&D success.

This work was made possible due to the years of clinical program monitoring and data entry by Informa
Pharma Intelligence’s Biomedtracker, which subsequently populates the purpose-built Probability of
Technical Success (PTS) tool, Pharmapremia. BIO has long worked with Biomedtracker to calculate success
rates based on this data. More recently, BIO and Biomedtracker teamed up with QLS Advisors, a team of
expert data scientists who apply machine learning (ML) and artificial intelligence (AI) to clinical trials data
and drug properties to assess the features that contribute the most amount, positively or negatively, to the
probability of approval. The computational analyses of over 200 different drug, trial, indication, and sponsor
metrics that influence clinical success rates were applied in a predictive capacity to produce risk assessments
and evaluations of R&D assets with increased accuracy.

Key Takeaways
• The overall likelihood of approval (LOA) from Phase I for all developmental candidates over 2011–2020 was
   7.9%.
• Phase II development remains the largest hurdle in drug development, with just 28.9% of candidates
   achieving this critical phase transition.
• Of the 14 major disease areas, Hematology therapies had the highest LOA from Phase I (23.9%), representing
   a seven-fold increase over the least successful group, Urology (3.6%).
• Immuno-oncology therapies provide a rare pocket of success in oncology R&D with an overall LOA of 12.4%
   vs 5.3% for all oncology approaches.
• Rare disease therapies were notably successful with an overall LOA of 17.0%.
• Chronic, high prevalence disease therapies were less successful with an overall LOA of 5.9%.
• Biological complexity in drug modalities generally leads to higher LOA, with CAR-T and RNA interference
   achieving the highest LOAs of 17.3% and 13.5%, respectively.
• Development programs with trials employing patient preselection biomarkers have two-fold higher LOAs
   (15.9%), driven by a Phase II success rate of nearly one-in-two.
• The top contributing factors toward phase success are disease indication, target, modality, and drug
   novelty.
• On average, it takes 10.5 years for a Phase I asset to progress to regulatory approval. Disease areas with
   above-average LOAs tend to have the shortest development timelines.

3/ February 2021                                © BIO | QLS Advisors | Informa UK Ltd 2021 (Unauthorized photocopying prohibited.)
Contents
    About BIO												2

    About Informa Pharma Intelligence								2

    About QLS Advisors										2

Executive Summary    										3

Introduction												5

Part 1. Phase Transition Success and Likelihood of Approvals					6

    Phase Transition Success – By Disease Area							7

      Phase I Transition Success Rates								7

      Phase II Transition Success Rates								7

      Phase III Transition Success Rates								8

      NDA/BLA Submission Success Rates								9

    Likelihood of Approval (LOA) – By Disease Area							9

    Oncology and Non-Oncology Diseases								11

    Rare and Chronic High Prevalence Diseases							13

    Drug Classes and Modalities									15

    Patient Preselection Biomarkers									17

Part 2. Predictive Analysis of Clinical Success								19

Part 3. Drug Development Timelines									24

Discussion												26

    Comparison with previous reports on attrition rates						                                                26

    Oncology: largest segment of industry, modest success rates					                                         27

    Challenges for Phase II proof-of-concept drive overall performance				                                   27

    Characteristics of rare disease R&D not found in highly prevalent chronic disease		                      27

    Complexity of modality correlates with higher LOA						                                                  28

    Increasing duration in clinical development typically carries elevated risk				                          29

Methods												30

Appendix		 										33

Contributing Authors											34

                                                         © Informa UK Ltd 2021 (Unauthorized photocopying prohibited.)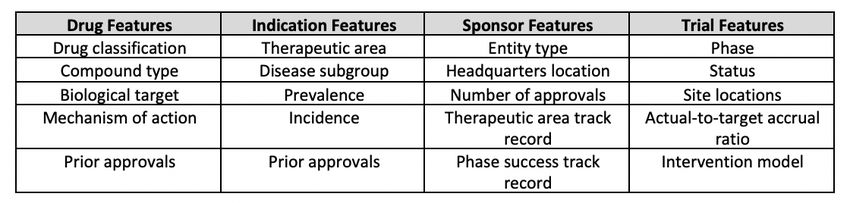
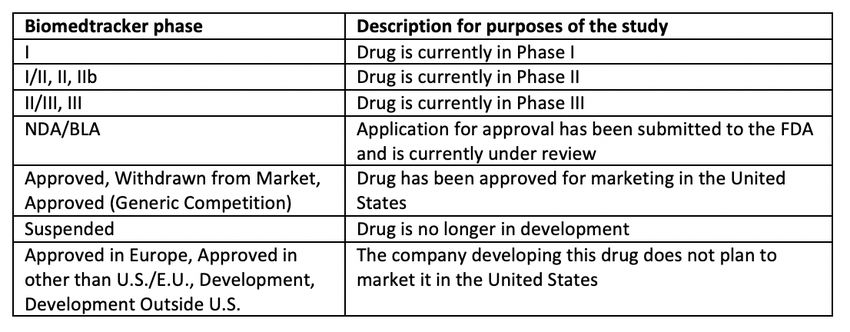
Introduction
This study aimed to measure clinical development success rates, contributing factors to those outcomes, and
timelines of clinical trials. With the goal of providing current benchmarking metrics for drug development,
this study covers the most recent decade of individual drug program phase transitions from January 1,
2011, to November 30, 2020. A phase transition is defined as the movement out of a clinical phase – for
example, advancing from Phase I to Phase II development, or being suspended after completion of Phase I
development.

Three separate analyses were conducted. Part 1 of this report includes clinical development success rates
based on 12,728 transitions in the Biomedtracker database. These transitions occurred in 9,704 clinical drug
development programs over the last decade. Within this broad set of data, we segmented and analyzed
success in drug development across levels of novelty, molecular modalities, and disease indications. As this
study cuts across 1,779 companies, roughly the entire spectrum of biopharma companies was included. This
is illustrated with 15 companies each contributing more than 100 transitions, while 748 smaller biotechs
contributed just one transition each. Only company-sponsored, FDA registration-enabling development
programs were included in this analysis. Investigator-sponsored studies and combinations with other
investigational drugs were excluded. A more detailed description of the data collection, composition, and
analysis methodologies is provided in the “Methods” section.

The second analysis applies big data analytics to uncover the underlying drivers of drug development
success. Despite the successful application of machine learning techniques to libraries of billions of chemical
and biological compounds in order to identify potential drug candidates, most drug developers and financial
analysts still rely on historical observation to derive estimates of the clinical trial success rate when analyzing
pipelines of investigational drugs. QLS Advisors, a technology and advisory company dedicated to fostering
innovation in the life sciences, applies machine-learning techniques to predict the outcomes of randomized
clinical trials. In Part 2 of this report, QLS Advisors explores how investors in the biopharma industry can use
machine learning to characterize the probability of success for regulatory approval of a novel therapy.

An analysis of clinical timelines is included in Part 3. Here we measure the time it takes for drug development
programs at each clinical phase to transition upon success to the next phase.

5/ February 2021                                  © BIO | QLS Advisors | Informa UK Ltd 2021 (Unauthorized photocopying prohibited.)

Part 1. Phase Transition Success and Likelihood of Approvals
Success rates for individual phases of the drug development process were determined by dividing the
number that successfully advanced to the next phase by the total number advanced and suspended. This
“advanced and suspended” number is often referred to as “n” in this report and should be taken into account
when drawing conclusions from the success rate results.

Consistent with previous studies of drug development phase transition success rates, we found Phase II
success rates to be far lower than any other phase.1,2 Phase I and III rates were substantially higher than
Phase II, with Phase I slightly lower than Phase III. The highest success rate of the four development phases
was the New Drug Application (NDA)/ Biologic License Application (BLA) filing phase (Figure 1).

The Phase I transition success rate was 52.0% (n=4,414). As this phase is typically conducted for safety testing
and is not dependent on efficacy for candidates to advance, it is common for this phase to have a higher
success rate among the clinical phases across most categories analyzed in this report. However, Phase I
success rates also may benefit from delayed reporting or omission bias, as some larger companies may not
deem failed Phase I programs as material and thereby not report them in the public domain.

The Phase II transition success rate (28.9%, n=4,933) was substantially lower than Phase I, and the lowest
of the four phases studied. As this is generally the first stage where proof-of-concept is deliberately tested
in human subjects, Phase II consistently has the lowest success rate of all phases. This is also the point
in development where industry must decide whether to pursue large, expensive Phase III studies, or to
terminate development – this may be done for multiple reasons, including commercial viability. The second-
highest phase transition success rate was found in Phase III (57.8%, n=1,928). This is significant as most
company-sponsored Phase III trials are the longest and most expensive trials to conduct.

The probability of FDA approval after submitting an NDA or BLA, taking into account re-submissions, was
90.6% (n=1,453).

                                                                Overall phase transition success rates
                                                                             Probability of Success
                                                      100%                                                                           90.6%
                             Probability of Success

                                                       90%
                                                       80%
                                                       70%                                                 57.8%
                                                       60%      52.0%
                                                       50%
                                                       40%                          28.9%
                                                       30%
                                                       20%
                                                       10%
                                                        0%
                                                             Phase I to II       Phase II to III       Phase III to              NDA/BLA to
                                                                                                        NDA/BLA                   Approval
                      Figure 1: Phase transition success rates from Phase I for all diseases, all modalities. Source: Biomedtracker® and Pharmapremia®, 2020.

1
  Hay M, Thomas D, Craighead JL, Economides C, Rosenthal J (2014). Clinical development success rates for investigational drugs.Nature Biotechnology, 32(1), 40–51. doi: 10.1038/
nbt.2786
2
  Thomas D, Burns J, Audette J, Carroll A, Dow-Hygelund C, Hay M (2016) Clinical Development Success Rates 2006-2015. Available here [Accessed 15 January 2021].

6/ February 2021                                                                   © BIO | QLS Advisors | Informa UK Ltd 2021 (Unauthorized photocopying prohibited.)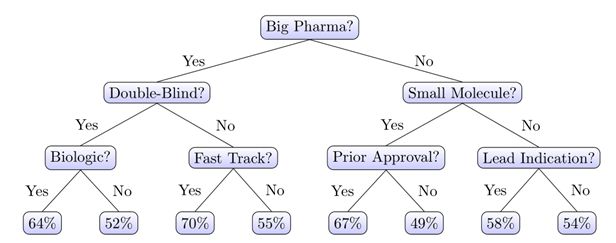
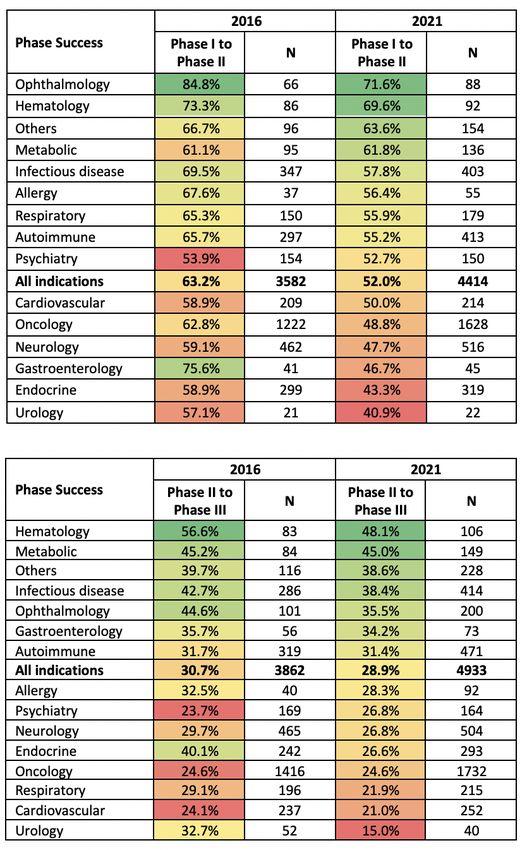
Phase Transition Success – By Disease Area
Major disease areas were segmented according to the convention used by Biomedtracker and categorized
into 21 major diseases and 623 indications for the 2011–2020 timeframe. For reporting at the disease
area level, in Figure 2 we analyzed 14 major groupings: Allergy, Autoimmune, Cardiovascular, Endocrine,
Gastroenterology (non-IBD), Hematology, Infectious disease, Metabolic, Neurology, Oncology, Ophthalmology,
Psychiatry, Respiratory, and Urology. The remaining disease areas were placed into the “Other” category. This
includes Dermatology, Renal, Obstetrics, Rheumatology (for non-autoimmune indications), ENT/Dental, and
Orthopedics. Beneath these major disease areas are 573 indications, which will be analyzed and discussed
in subsequent reports.

                                               Phase transition success rates by disease area

                                                     Phase I                        Phase II                       Phase III                       NDA/BLA
                                                      to II                          to III                      to NDA/BLA                       to Approval
           Phase Success
                                                 n           Phase               n            Phase               n            Phase               n           Phase
                                                              POS                              POS                              POS                             POS
         Hematology                           92             69.6%            106             48.1%             82             76.8%             72            93.1%
         Metabolic                           136             61.8%            149             45.0%             66             63.6%             48            87.5%
         Infectious disease                  403             57.8%            414             38.4%            197             64.0%            156            92.9%
         Others                              154             63.6%            228             38.6%             90             60.0%             69            88.4%
         Ophthalmology                        88             71.6%            200             35.5%             82             51.2%             45            91.1%
         Autoimmune                          413             55.2%            471             31.4%            219             65.3%            202            94.1%
         Allergy                              55             56.4%             92             28.3%             34             64.7%             20            100.0%
         Gastroenterology                     45             46.7%             73             34.2%             35             57.1%             33            90.9%
         All indications                     4414            52.0%            4933            28.9%            1928            57.8%            1453           90.6%
         Respiratory                         179             55.9%            215             21.9%             62             64.5%             45            95.6%
         Psychiatry                          150             52.7%            164             26.8%             71             56.3%             57            91.2%
         Endocrine                           319             43.3%            293             26.6%            151             66.2%            124            86.3%
         Neurology                           516             47.7%            504             26.8%            226             53.1%            165            86.7%
         Oncology                            1628            48.8%            1732            24.6%            495             47.7%            324            92.0%
         Cardiovascular                      214             50.0%            252             21.0%            105             55.2%             80            82.5%
         Urology                              22             40.9%             40             15.0%             13             69.2%             13            84.6%

       Figure 2: Phase transition success rates by disease area. The n value is the total ‘Advanced or Suspended’ transitions of all phases used to calculate LOA. ‘POS’ is
       the probability of successfully advancing to the next phase. The ordering of disease areas is consistent with the overall likelihood of approval from Phase I, which is
       analyzed later in Figure 5. Source: Biomedtracker® and Pharmapremia®, 2020

Phase I Transition Success Rates
Success rates by disease area for Phase I ranged from 40.9% to 71.6%, with the average for all disease
indications coming in at 52.0%. Ophthalmology and Hematology were both well above the average rate,
achieving respective successful Phase I transitions of 71.6% (n=88) and 69.6% (n=92). With the exception of
these two major disease areas, the remainder were all within a reasonable distance from the mean.

Phase II Transition Success Rates
In every disease area, Phase II had the lowest transition success rate of the four phases. As shown in Figure

7/ February 2021                                                               © BIO | QLS Advisors | Informa UK Ltd 2021 (Unauthorized photocopying prohibited.)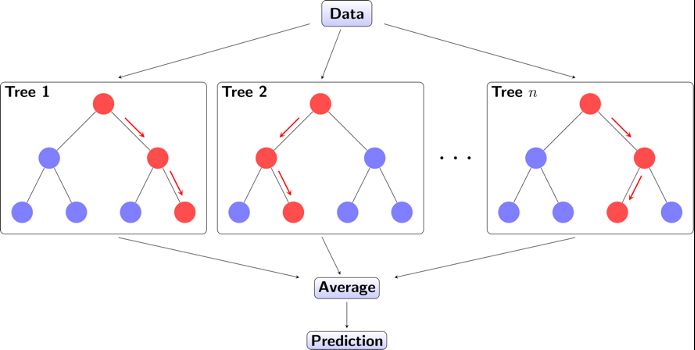
3, Phase II success rates ranged from a high of 48.1% (Hematology, n=106) to a low of 15.0% (Urology, n=40).
This 33% range of disparity between major disease areas at the Phase II transition is the major contributor to
the observed divergences in overall likelihood of approval (LOA), as discussed in the next section. With only
Hematology and Metabolic (45.0%) coming close to achieving a one-in-two success rate, these two disease
areas are also the leaders when calculating the overall LOA from Phase I, as shown later in Figure 5.
Similar to Phase I transition success, the lowest-performing disease groups were Urology, Cardiovascular
(21.0%), and Oncology (24.6%). Relative to its placement for Phase I success rate, the Gastroenterology
category performed better in Phase II (34.2%), above the average for all indications.
Phase II transition success rates by disease area
Probability of Phase II Success
Hematology 48.1%
Metabolic 45.0%
Others 38.6%
Infectious disease 38.4%
Ophthalmology 35.5%
Gastroenterology 34.2%
Autoimmune 31.4%
All indications 28.9%
Allergy 28.3%
Psychiatry 26.8%
Neurology 26.8%
Endocrine 26.6%
Oncology 24.6%
Respiratory 21.9%
Cardiovascular 21.0%
Urology 15.0%
0% 10% 20% 30% 40% 50% 60%
Probability of Success
Figure 3: Phase II transition success rates by disease area. Source: Biomedtracker® and Pharmapremia®, 2020
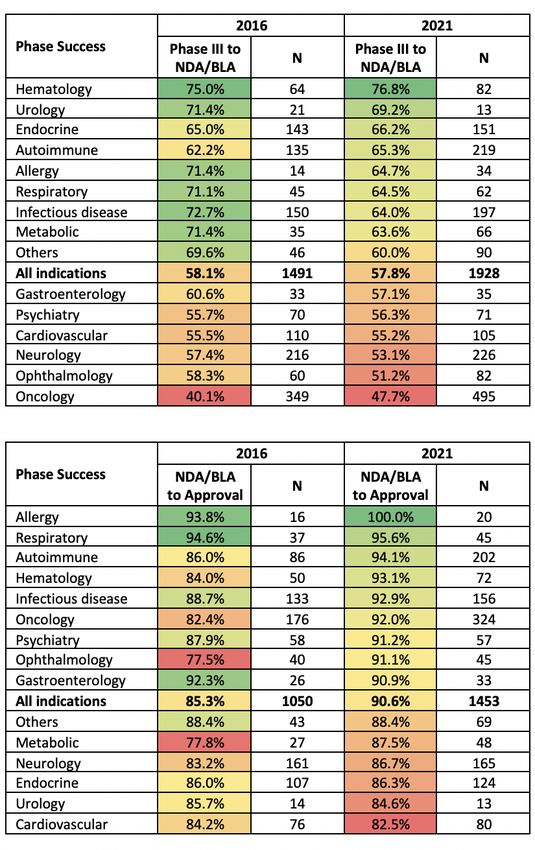
Phase III Transition Success Rates
For Phase III transition success rates, Oncology had the lowest transition success rate (47.5%, n=495). As
seen in Figure 4, the Phase III success rates for the remaining 13 specific disease areas were each above 50%.
Five other disease groups besides Oncology ranked below the average Phase III transition success rate
of 57.8%, including Ophthalmology (51.2%, n=82) which in the earlier phases performed better than the
average across all diseases. Conversely, Urology, which had the lowest transition rates in Phase I and II,
had the second-highest Phase III success rate behind Hematology at 69.2%, albeit with a very low n of 13
transitions. All of the disease groups with below-average Phase III success rates had disease indications with
large patient populations. Later in this report, we will analyze these high prevalence diseases and compare
their success rates to those of therapies for rare diseases.
8/ February 2021 © BIO | QLS Advisors | Informa UK Ltd 2021 (Unauthorized photocopying prohibited.)Phase III transition success rates by disease area
Probability of Phase III Success
Hematology 76.8%
Urology 69.2%
Endocrine 66.2%
Autoimmune 65.3%
Allergy 64.7%
Respiratory 64.5%
Infectious disease 64.0%
Metabolic 63.6%
Others 60.0%
All indications 57.8%
Gastroenterology 57.1%
Psychiatry 56.3%
Cardiovascular 55.2%
Neurology 53.1%
Ophthalmology 51.2%
Oncology 47.7%
0% 10% 20% 30% 40% 50% 60% 70% 80% 90%
Probability of Success
Figure 4: Phase III transition success rates by disease area. Source: Biomedtracker® and Pharmapremia®, 2020
NDA/BLA Submission Success Rates
NDA/BLA transition success rates (approval rates) for the major disease areas ranged from the low end of
82.5% (Cardiovascular) to a high of 100.0% (Allergy). This distribution had the tightest range among the four
phases analyzed in this report. These rates are the result of eventual success, not success on the first review.
In some cases, programs have more than two Complete Response Letters (CRLs) and attempts at approval.
This unlimited allowance of submission attempts pushes the overall success above 90.6% across all diseases,
with only 137 drugs suspended by their sponsors at the regulatory transition over 2011–2020 (thus, 1,316
approved).
Among the clinical development programs analyzed, there was an approximately even split of innovative
drugs and non-originator products that were successful in obtaining regulatory approval. These included
740 innovative drug programs (435 new molecular entities (NMEs), 278 new biologics, and 27 vaccines) and
576 non-originator products (453 non-NMEs and 123 biosimilars). There is a more detailed discussion about
success rates by for drug modality and classification later in the report.
Likelihood of Approval (LOA) – By Disease Area
One of the key measures of success used in this report is the LOA from Phase I. The LOA success rate is
simply a multiplication of success rates from all four phases, a compounded probability calculation. For
example, if each phase had a 50% chance of success, then the LOA from Phase I would be 0.5 x 0.5 x 0.5 x
0.5 = 6.25%.
9/ February 2021 © BIO | QLS Advisors | Informa UK Ltd 2021 (Unauthorized photocopying prohibited.)Multiplying the individual phase probabilities across all disease areas (found in Figure 1), the compounded
probability of progressing from Phase I to U.S. FDA approval reveals that only 7.9% of drug development
programs (n=12,728) successfully make it to market.
As can be seen in Figure 5, there is a wide range of LOAs from Phase I. At the high end, Hematology towers
over the other disease groups at 23.9% (n=352). Hematology therapies had an LOA from Phase I seven times
higher than Urology therapies, which had the lowest Phase I LOA of all the major disease areas (3.6%, n=88).
After Hematology, the next highest LOA from Phase I was Metabolic with 15.5% (n=399). Five other disease
areas were above the overall average of 7.9% (Infectious Disease > Ophthalmology > Autoimmune > Allergy
> Gastroenterology) which ranged from 13.2% down to 8.3%. Falling under the overall LOA of 7.9%, but very
close, were Respiratory (7.5%) and Psychiatry (7.3%). Therapies for five disease categories were well below
the average (Endocrine > Neurology > Oncology > Cardiovascular > Urology). The fact that Oncology and
Neurology have the two largest n values, while also having low LOA values, indicates that these two disease
categories are significant contributors in bringing down the overall industry LOA.
Overall likelihood of approval by disease area
Likelihood of Approval from Phase I
Hematology 23.9%
Metabolic 15.5%
Infectious disease 13.2%
Others 13.0%
Ophthalmology 11.9%
Autoimmune 10.7%
Allergy 10.3%
Gastroenterology 8.3%
All indications 7.9%
Respiratory 7.5%
Psychiatry 7.3%
Endocrine 6.6%
Neurology 5.9%
Oncology 5.3%
Cardiovascular 4.8%
Urology 3.6%
0% 5% 10% 15% 20% 25% 30%
Probability of Success
Figure 5a: Chart of LOA from Phase I, displayed highest to lowest by disease area. Source: Biomedtracker® and Pharmapremia®, 2020
10/ February 2021 © BIO | QLS Advisors | Informa UK Ltd 2021 (Unauthorized photocopying prohibited.)Phase I Phase II Phase III NDA/BLA
Likelihood of to Approval to Approval to Approval to Approval
Approval LOA Phase LOA Phase LOA Phase LOA Phase
n LOA n LOA n LOA n LOA
Hematology 352 23.9% 260 34.4% 154 71.5% 72 93.1%
Metabolic 399 15.5% 263 25.0% 114 55.7% 48 87.5%
Infectious disease 1170 13.2% 767 22.8% 353 59.4% 156 92.9%
Others 541 13.0% 387 20.5% 159 53.0% 69 88.4%
Ophthalmology 415 11.9% 327 16.6% 127 46.7% 45 91.1%
Autoimmune 1305 10.7% 892 19.3% 421 61.4% 202 94.1%
Allergy 201 10.3% 146 18.3% 54 64.7% 20 100.0%
Gastroenterology* 186 8.3% 141 17.8% 68 51.9% 33 90.9%
All indications 12728 7.9% 8314 15.1% 3381 52.4% 1453 90.6%
Respiratory 501 7.5% 322 13.5% 107 61.6% 45 95.6%
Psychiatry 442 7.3% 292 13.8% 128 51.4% 57 91.2%
Endocrine 887 6.6% 568 15.2% 275 57.1% 124 86.3%
Neurology 1411 5.9% 895 12.3% 391 46.0% 165 86.7%
Oncology 4179 5.3% 2551 10.8% 819 43.9% 324 92.0%
Cardiovascular 651 4.8% 437 9.6% 185 45.6% 80 82.5%
Urology 88 3.6% 66 8.8% 26 58.6% 13 84.6%
Figure 5b: Table likelihood of approval by disease area with corresponding n values. The n value is the total ‘Advanced or Suspended’ transitions of all phases used
to calculate LOA. ‘Phase LOA’ is the probability of FDA approval for drugs from this phase of development. Source: Biomedtracker® and Pharmapremia®, 2020
Oncology and Non-Oncology Diseases
Oncology drug development program transitions in the 2011–2020 period accounted for 33% of the 12,728
total transitions. With the third-lowest LOA from Phase I (5.3%, n=4,179), Oncology had an outsized effect
on the overall industry success rate. To further understand this contribution, we compared phase transition
success rates and LOA for non-oncology development programs against oncology development programs
(Figure 6).
The LOA from Phase I across non-oncology indications, 9.3% (n=8,549), was nearly twice that for Oncology
alone, at 5.3% (n=4,179). Comparing individual phase transition success rates in Figure 2, Oncology consistently
had one of the lowest success rates compared to the other 14 disease categories for every developmental
clinical transition. In particular, there were relative differentials of approximately 20% between Oncology and
non-oncology groupings at the Phase II and III stages. One notable exception was the NDA/BLA to approval
success rate. Oncology performed slightly better than non-oncology at the regulatory transition between
NDA/BLA and approval, with a 92.0% (n=324) success rate, as opposed to 90.2% (n=1,129).
11/ February 2021 © BIO | QLS Advisors | Informa UK Ltd 2021 (Unauthorized photocopying prohibited.)Oncology vs. non-oncology phase transition success rates and LOA
Probability of Success: Oncology vs. Others
100% 92.0% 90.2%
90%
Probability of Success
80%
70% 61.3%
60% 53.9%
48.8% 47.7%
50%
40% 31.2%
30% 24.6%
20%
9.3%
10% 5.3%
0%
Phase I to II Phase II to III Phase III to NDA/BLA to Phase I to
NDA/BLA Approval Approval
Oncology Non-oncology
Phase III to NDA/BLA to
Phase I to II Phase II to III
NDA/BLA Approval
Phase Success
Phase Phase Phase Phase
POS n POS n POS n POS n
POS POS POS POS
Oncology 1628 48.8% 1732 24.6% 495 47.7% 324 92.0%
Non-oncology 2786 53.9% 3201 31.2% 1433 61.3% 1129 90.2%
Phase I to Phase II to Phase III to NDA/BLA to
Likelihood of Approval Approval Approval Approval
Approval Phase Phase Phase Phase
LOA n LOA n LOA n LOA n
LOA LOA LOA LOA
Oncology 4179 5.3% 2551 10.8% 819 43.9% 324 92.0%
Non-oncology 8549 9.3% 5763 17.2% 2562 55.3% 1129 90.2%
Figure 6: Oncology vs non-oncology phase transition success rates and LOA. Top: Chart of phase transition success rates and LOA from Phase I for Oncology vs non-
Oncology. Bottom: Table of phase transition success and likelihood of approval by Oncology vs non-Oncology with corresponding n values. The n value is the total
‘Advanced or Suspended’ transitions of all phases used to calculate LOA. ‘POS’ is the probability of successfully advancing to the next phase, whereas ‘Phase LOA’ is
the probability of FDA approval for drugs from this phase of development. Source: Biomedtracker® and Pharmapremia®, 2020
Oncology drugs were further categorized into two main types of cancer: solid tumors and hematologic
cancers. Drugs for solid tumors had more than twice as many transitions in the data set (2,982 vs 1,094), but
a much smaller LOA from Phase I vs hematological cancers (4.6% vs 7.5%).
The 2011–2020 time period witnessed the rise of drugs that harness the immune system to treat the
underlying cancer, spanning both solid and hematologic types. The first successful immuno-oncology (IO)
drugs spawned intense growth in this field over a short period of time, with 679 total phase transitions
included in the Biomedtracker database. The success rates of IO drugs far exceed the traditional oncology
averages, with a Phase I LOA of 12.4%. The notably high Phase II transition rate of 42.0% for IO drugs –
contrasting 24.6% as a whole for oncology – is the main factor underpinning the overall LOA success for the
IO class. These oncology groupings are shown in Figure 7.
12/ February 2021 © BIO | QLS Advisors | Informa UK Ltd 2021 (Unauthorized photocopying prohibited.)Oncology sub-category phase transition success rates and LOA
Phase III to NDA/BLA to
Phase I to II Phase II to III
NDA/BLA Approval
Phase Success
Phase Phase Phase Phase
POS n POS n POS n POS n
POS POS POS POS
Hematologic 425 50.1% 449 27.8% 120 60.0% 100 90.0%
Solid 1145 48.9% 1261 23.4% 364 42.9% 212 92.9%
IO 275 64.0% 244 40.2% 98 49.0% 62 98.4%
Phase I to Phase II to Phase III to NDA/BLA to
Likelihood of Approval Approval Approval Approval
Approval
Phase Phase Phase Phase
LOA n LOA n LOA n LOA n
LOA LOA LOA LOA
Hematologic 1094 7.5% 669 15.0% 220 54.0% 100 90.0%
Solid 2982 4.6% 1837 9.3% 576 39.8% 212 92.9%
IO 679 12.4% 404 19.4% 160 48.2% 62 98.4%
Figure 7: Oncology sub-category phase transition success rates and LOA. The n value is the total ‘Advanced or Suspended’ transitions of all phases used to calculate
LOA. ‘POS’ is the probability of successfully advancing to the next phase, whereas ‘Phase LOA’ is the probability of FDA approval for drugs from this phase of
development. Note: Hematologic and solid tumor types are mutually exclusive categories, while the IO drug class includes transitions from across both categories.
IO drugs for solid tumors had 3x the transitions as IO hematological cancers but have similar success rates. Source: Biomedtracker® and Pharmapremia®, 2020
Rare and Chronic High Prevalence Diseases
Within the Biomedtracker database, rare diseases can be identified based on meeting either or both of the
following standard criteria: affecting fewer than 200,000 people in the US, or prevalence of 1 in 2,000 people
in the EU. As 43% of the Oncology transitions are for rare indications, all Oncology indications were removed
to make this rare disease analysis more concentrated on inborn genetic disorders. For chronic diseases, we
first obtained a list of conditions from the CMS Chronic Conditions Data Warehouse (CCW). We removed any
cancer indications, then identified those diseases with greater than 1 million patients affected in the United
States.
Rare disease vs. highly prevalent chronic disease success rates
Probability of Success: Rare vs Chronic Diseases
100% 93.6% 92.6% 90.6%
Probability of Success
80% 67.4% 60.4% 59.5%
52.0% 57.8%
60% 46.0% 44.6%
40% 28.9%
23.1%
17.0% 7.9%
20% 5.9%
0%
Phase I to II Phase II to III Phase III to NDA/BLA to Phase I to
NDA/BLA Approval Approval
Rare diseases Chronic, high prevalence diseases All indications
Figure 8a: Non-oncology rare disease and highly prevalent chronic disease phase transition success rates and LOA.
Chart of phase transition success rates and LOA from Phase I. Source: Biomedtracker® and Pharmapremia®, 2020
13/ February 2021 © BIO | QLS Advisors | Informa UK Ltd 2021 (Unauthorized photocopying prohibited.)Phase III to NDA/BLA to
Phase I to II Phase II to III
NDA/BLA Approval
Phase Success
Phase Phase Phase Phase
POS n POS n POS n POS n
POS POS POS POS
Rare diseases 380 67.4% 464 44.6% 240 60.4% 172 93.6%
Chronic, high
745 46.0% 737 23.1% 279 59.5% 217 92.6%
prevalence diseases
All diseases 4414 52.0% 4933 28.9% 1928 57.8% 1453 90.6%
Phase I to Phase II to Phase III to NDA/BLA to
Likelihood of Approval Approval Approval Approval
Approval Phase Phase Phase Phase
LOA n LOA n LOA n LOA n
LOA LOA LOA LOA
Rare diseases 1256 17.0% 876 25.2% 412 56.6% 172 93.6%
Chronic, high
1978 5.9% 1233 12.7% 496 55.1% 217 92.6%
prevalence diseases
All diseases 12728 7.9% 8314 15.1% 3381 52.4% 1453 90.6%
Figure 8b: Non-oncology rare disease and highly prevalent chronic disease phase transition success rates and LOA. Table of phase transition success and likelihood
of approval by disease prevalence with corresponding n values. The n value is the total ‘Advanced or Suspended’ transitions of all phases used to calculate LOA.
‘POS’ is the probability of successfully advancing to the next phase, whereas ‘Phase LOA’ is the probability of FDA approval for drugs from this phase of development.
Source: Biomedtracker® and Pharmapremia®, 2020
After identifying programs for non-oncology rare diseases and highly prevalent chronic diseases, we
compared their phase transition success rates and LOA as shown in Figure 8. At 17.0%, the overall LOA from
Phase I for rare diseases (17.0%) was almost three times higher than for chronic, high prevalence diseases
(5.9%). As both of these groups exclude Oncology indications, we can compare these results with those of the
overall non-oncology figures. The 9.3% LOA (n=8,549) value for all non-oncology indications is meaningfully
higher than for chronic, high prevalence diseases, suggesting that these indications are having a negative
impact on overall success rates outside Oncology. Chronic, high prevalence diseases accounted for 16% of
total transitions, with Oncology providing a further 33%. These two groups, having LOAs well below average,
together comprise half of the total dataset, thus negatively affecting the overall industry LOA of 7.9%.
Although excluded from the above analysis, rare disease Oncology indications had a higher LOA than
non-rare Oncology indications (6.8% vs 4.4%), largely driven by the higher overall success for hematologic
malignancies. Blood cancers typically have lower prevalence and are classified as rare diseases.
Success rates for all four transitions were higher for the rare disease group than any of the overall transition
success rates. The largest difference was found in Phase II transition success rates (44.6% for rare disease
vs 28.9% overall). There was also a notable gap between Phase I transition rates (67.4% vs 52.0%), although
success in Phase III and in the NDA/BLA to Approval transitions were broadly comparable.
Conversely, the success rates for transitions in the highly prevalent chronic disease group were lower than
the overall transition success rates in Phase I (46.0% vs 52.0%) and Phase II (23.1% vs 28.9%). The opposite
was seen in Phase III and NDA/BLA transitions, where slightly higher success rates were observed: 59.5% vs
57.8% for Phase III and 92.6% vs 90.6% for NDA/BLA.
14/ February 2021 © BIO | QLS Advisors | Informa UK Ltd 2021 (Unauthorized photocopying prohibited.)Drug Classes and Modalities
Drugs in the dataset were annotated as novel or off-patent, with the novel category including new molecular
entities (NMEs; mainly small molecules), biologics, and vaccines; and the off-patent group comprised of
non-NMEs and biosimilars. As noted in Figure 9, transition success rates for novel drugs confirm that they
face a more difficult pathway to approval than for off-patent products. The overall Phase I LOA for off-
patent therapies (14.7%, n=2,161) was twice as high as that for novel therapies (6.8%, n=10,527).This two-fold
increase in success for non-originator products was driven by higher success rates in all three clinical phase
transitions, with the greatest divergence observed during Phase III (52.9% vs 70.3%).
Within the novel drugs segment, NMEs had a lower probability of approval from Phase I than either biologics
or vaccines. While there was a 5.7% (n=6,803) chance of a Phase I NME gaining approval, the probabilities for
biologics and vaccines were 9.1% (n=3,412) and 9.7% (n=312), respectively. Vaccines in particular have been
100% successful in the NDA/BLA to Approval stage (n=27). In the off-patent category, biosimilars performed
well, with an overall Phase I LOA of 32.3% (n=277).
Phase transition success rates and LOA from Phase I for drugs based on class and novelty
Phase III to NDA/BLA to
Phase I to II Phase II to III
NDA/BLA Approval
Phase Success
Phase Phase Phase Phase
POS n POS n POS n POS n
POS POS POS POS
"Novel" 3933 51.3% 4394 27.9% 1374 52.9% 826 89.6%
NME 2505 50.6% 2924 25.6% 869 50.6% 505 86.1%
Biologic 1301 52.5% 1355 32.4% 462 56.7% 294 94.6%
Vaccine 127 52.0% 115 32.2% 43 58.1% 27 100.0%
"Off-Patent" 455 60.4% 527 37.6% 552 70.3% 627 91.9%
Non-NME 395 57.5% 523 37.5% 471 67.5% 495 91.5%
Biosimilar 60 80.0% 4 50.0% 81 86.4% 132 93.2%
Phase I to Phase II to Phase III to NDA/BLA to
Likelihood of Approval Approval Approval Approval
Approval Phase Phase Phase Phase
LOA n LOA n LOA n LOA n
LOA LOA LOA LOA
"Novel" 10527 6.8% 6594 13.2% 2200 47.4% 826 89.6%
NME 6803 5.7% 4298 11.2% 1374 43.6% 505 86.1%
Biologic 3412 9.1% 2111 17.4% 756 53.6% 294 94.6%
Vaccine 312 9.7% 185 18.7% 70 58.1% 27 100.0%
"Off-Patent" 2161 14.7% 1706 24.3% 1179 64.6% 627 91.9%
Non-NME 1884 13.3% 1489 23.2% 966 61.8% 495 91.5%
Biosimilar 277 32.2% 217 40.3% 213 80.5% 132 93.2%
Figure 9: Phase transition success rates and LOA from Phase I for drugs based on class and novelty. The n value is the total ‘Advanced or Suspended’ transitions of
all phases used to calculate LOA. ‘POS’ is the probability of successfully advancing to the next phase, whereas ‘Phase LOA’ is the probability of FDA approval for drugs
from this phase of development. Source: Biomedtracker® and Pharmapremia®, 2020
15/ February 2021 © BIO | QLS Advisors | Informa UK Ltd 2021 (Unauthorized photocopying prohibited.)Looking a little deeper into drug modality, chimeric antigen receptor T cell (CAR-T) development has seen
the most success among selected novel modalities (Figure 10). At 17.3% (n=67), the Phase I LOA for CAR-T
therapies is more than twice the 7.9% average across all diseases, and more than three times higher than the
5.3% Phase I LOA for all of oncology. Since 2017, three separate CAR-Ts have gained approval, with a total of
four successful BLA transitions. The strong R&D progress in RNA interference (RNAi) therapies is reflected in
the Phase I LOA for this category, second behind CAR-T at 13.5% (n=70). This class includes three approvals as
of December 31, 2020, the first of which came in 2018. Monoclonal antibodies, antibody drug conjugates
(ADCs), and gene therapies also each have over a 10% likelihood of approval at the Phase I stage.
Success rates by modality
Likelihood of Approval: Novel Modalities
CAR-T 17.3%
siRNA/RNAi 13.5%
Monoclonal antibody 12.1%
ADCs 10.8%
Gene therapy 10.0%
Vaccine 9.7%
Protein 9.4%
Peptide 8.0%
Small molecule 7.5%
Antisense 5.2%
0% 5% 10% 15% 20%
Probability of Success
Figure 10a: LOA from Phase I for drugs based on modality. Chart of LOA from Phase I, displayed highest to lowest by drug modality.
16/ February 2021 © BIO | QLS Advisors | Informa UK Ltd 2021 (Unauthorized photocopying prohibited.)Phase III to NDA/BLA to
Phase I to II Phase II to III
NDA/BLA Approval
Phase Success
Phase Phase Phase Phase
POS n POS n POS n POS n
POS POS POS POS
CAR-T 43 44.2% 17 58.8% 3 66.7% 4 100.0%
siRNA/RNAi 40 70.0% 38 28.9% 6 66.7% 3 100.0%
Monoclonal antibody 804 54.7% 740 34.1% 310 68.1% 282 95.4%
ADCs 103 41.7% 53 41.5% 16 62.5% 12 100.0%
Gene therapy 27 51.9% 57 38.6% 10 50.0% 2 100.0%
Vaccine 129 52.7% 117 31.6% 43 58.1% 27 100.0%
Protein 246 51.6% 288 33.0% 149 61.7% 117 89.7%
Peptide 234 53.0% 218 28.4% 100 60.0% 67 88.1%
Small molecule 2308 52.6% 2896 28.0% 1118 56.9% 849 89.5%
Antisense 69 60.9% 70 20.0% 14 64.3% 9 66.7%
Phase I to Phase II to Phase III to NDA/BLA to
Approval Approval Approval Approval
Likelihood of Approval
Phase Phase Phase Phase
LOA n LOA n LOA n LOA n
LOA LOA LOA LOA
CAR-T 67 17.3% 24 39.2% 7 66.7% 4 100.0%
siRNA/RNAi 87 13.5% 47 19.3% 9 66.7% 3 100.0%
Monoclonal antibody 2136 12.1% 1332 22.1% 592 64.9% 282 95.4%
ADCs 184 10.8% 81 25.9% 28 62.5% 12 100.0%
Gene therapy 96 10.0% 69 19.3% 12 50.0% 2 100.0%
Vaccine 316 9.7% 187 18.4% 70 58.1% 27 100.0%
Protein 800 9.4% 554 18.3% 266 55.4% 117 89.7%
Peptide 619 8.0% 385 15.0% 167 52.8% 67 88.1%
Small molecule 7171 7.5% 4863 14.3% 1967 50.9% 849 89.5%
Antisense 162 5.2% 93 8.6% 23 42.9% 9 66.7%
Figure 10b: LOA from Phase I for drugs based on modality. Table of phase transition success and likelihood of approval by modality with corresponding n values. The n
value is the total ‘Advanced or Suspended’ transitions of all phases used to calculate LOA. ‘POS’ is the probability of successfully advancing to the next phase, whereas ‘Phase
LOA’ is the probability of FDA approval for drugs from this phase of development. *n values for vaccine differs slightly from Figure 9 owing to variable classification of cellular
vaccines. Source: Biomedtracker® and Pharmapremia®, 2020
Patient Preselection Biomarkers
A greater understanding of human disease – whether at the molecular or genomic level – ultimately leads to the
investigation of personalized medicine. Indications are increasingly segmented by biomarkers in order to match
patients with the treatments most likely to show the greatest benefit, according to the underlying drug mechanism
and disease pathophysiology. We identified 767 phase transitions out of 12,728 (6%) that incorporated patient
preselection biomarkers in their corresponding clinical trial design. This was accomplished by mapping Informa
Pharma Intelligence’s Biomedtracker and Trialtrove databases, to provide the supplemental level of clinical trial
detail. For a detailed description please refer to the Methods section.
The LOA from Phase I segmented by biomarkers can be found in Figure 11. Drug development programs with
trials employing patient preselection biomarkers have a two-fold higher LOA (15.9%) than those that do not
(7.6%).
17/ February 2021 © BIO | QLS Advisors | Informa UK Ltd 2021 (Unauthorized photocopying prohibited.)Success rates by use of patient preselection biomarkers
Probability of Success: Preselection Biomarkers
100% 96.0%
90.3%
90%
Probability of Success
80%
68.2%
70%
57.1%
60% 52.4% 52.0%
46.3%
50%
40%
28.3%
30%
15.9%
20%
7.6%
10%
0%
Phase I to II Phase II to III Phase III to NDA/BLA to Phase I to
NDA/BLA Approval Approval
Preselection biomarkers No biomarkers
Phase III to NDA/BLA to
Phase I to II Phase II to III
NDA/BLA Approval
Phase Success
Phase Phase Phase Phase
POS n POS n POS n POS n
POS POS POS POS
Preselection biomarkers 414 52.4% 149 46.3% 129 68.2% 75 96.0%
No biomarkers 4000 52.0% 4784 28.3% 1799 57.1% 1378 90.3%
Phase I to Phase II to Phase III to NDA/BLA to
Approval Approval Approval Approval
Likelihood of Approval
Phase Phase Phase Phase
LOA n LOA n LOA n LOA n
LOA LOA LOA LOA
Preselection biomarkers 767 15.9% 353 30.3% 204 65.5% 75 96.0%
No biomarkers 11961 7.6% 7961 14.6% 3177 51.5% 1378 90.3%
Figure 11: Patient preselection biomarker phase transition success rates and LOA. Top: Chart of phase transition success rates and LOA from Phase I. Bottom: Table
of phase transition success and likelihood of approval by biomarker status with corresponding n values. The n value is the total ‘Advanced or Suspended’ transitions
of all phases used to calculate LOA. ‘POS’ is the probability of successfully advancing to the next phase, whereas ‘Phase LOA’ is the probability of FDA approval for
drugs from this phase of development. Source: Biomedtracker®, Pharmapremia®, and Trialtrove®, 2020
The advantage of patient preselection biomarkers varies according to the trial stage. At Phase I, there is no
discernible difference between the two discrete sets, with both biomarker and non-biomarker programs
achieving close to the average success rate of 52.0%. The benefit is clearly greatest at Phase II, where the use
of preselection biomarkers enables 46.3% of programs to advance (n=149), compared to just 28.3% of those
without. A similar advantage, albeit smaller in magnitude, is also observed with Phase III transitions – 68.2%
for biomarker-supported programs vs 57.1% for those without. Success at the NDA/BLA transition is largely
contingent on Phase III trial design and so this benefit carries over from the largest clinical phase.
While this analysis only represents a small subset of the overall data, the degree of difference between
individual phase success rates and overall LOA from Phase I builds confidence in the pursuit of drug
development programs targeted at biomarker-enriched patient populations. Such assets are likely to
advance through clinical development with lower levels of attrition, and should in theory improve patient
outcomes via the advent of increasingly personalized medicine.
18/ February 2021 © BIO | QLS Advisors | Informa UK Ltd 2021 (Unauthorized photocopying prohibited.)Part 2. Predictive Analysis of Clinical Success
In Part 1, we estimated success rates using the drug-indication pathways gathered from the Biomedtracker
database. We can now incorporate additional information, called “features,” for each drug development
program using machine learning methods to produce forward-looking measures—forecasts—of the outcome
of ongoing programs. This type of analysis provides more timely and relevant estimates than standalone
analyses of historical success rates.
Some examples of features included in this predictive analysis are the characteristics of the drug, its indication,
its sponsor, and its clinical trial design. There are more than 200 features used in the QLS forecasts, a sample
of which can be found in Figure 12. In much the same way that linear regression models employ regressors,
or “right-hand-side” variables, to predict the “left-hand-side” or the dependent variable, these features
contain useful signals about drug development that allow the outcomes of drug development programs to
be more accurately predicted than before.
Sample of the 200-plus features driving success rate probabilities
Figure 12: Sample of the 200-plus features extracted from Pharmaprojects, Trialtrove, and Biomedtracker.
The QLS approach uses state of the art machine-learning techniques to analyze clinical trial data. While the
details of the QLS model are proprietary, an example of a commonly used machine-learning algorithm is a
random forest classifier. The random forest classifier is an algorithm that takes the average prediction from
a multitude of yes-no decision trees (i.e., a “forest”) that are applied to the features (see Figure 13).
When training a decision tree, one task is to learn the most informative questions to ask at each branch
point of the tree. For example, the algorithm might ask, “Is the drug sponsor a big pharma company?” If the
answer is “yes,” then the algorithm would move to the “yes” branch of the decision tree and then ask, “Is
the trial double-blind?” On the other hand, if the answer is “no,” then the algorithm would move to the “no”
branch of the decision tree, and ask, “Is the drug a small molecule?” and so on, until enough information
has been collected about the drug-program to make a prediction about its success or failure. By identifying
subtle patterns in a large enough database of historical drug transitions, machine-learning algorithms can
often make remarkably accurate predictions. Additional details on these techniques can be found in the
Methodology section.
Figure 13: A hypothetical representation of a single, simplified decision tree. The percentages at the “leaves” of the tree denote the fraction of training data samples
that are categorized by a given pathway.
19/ February 2021 © BIO | QLS Advisors | Informa UK Ltd 2021 (Unauthorized photocopying prohibited.)Feature Importance
Given the stakes involved in the drug development process, machine learning forecasts must not only be
accurate, but also interpretable to stakeholders charged with the responsibility of making go/no-go decisions.
These decision-makers need to understand why a given forecast differs from the historical average, and
which features were most important in driving the difference or delta with respect to the disease-group
baseline LOA. To increase the transparency of our forecasts, the QLS machine learning algorithm reports the
most important features and their individual contributions to the forecast’s delta.
As an illustration, we decompose our probability of approval (POA) prediction of an oncology drug that
is currently in phase 3 clinical trials into its key components. (Note that we use the term POA for the QLS
machine-learning forecasts to differentiate from the empirical “LOA” presented in Part I.) Figure 14 reports
the top five features that increase this program’s estimated probability of approval from its therapeutic
area historical baseline of 35.0% from phase 3 to approval, to 71.8%. The top positive feature driving this
higher than average probability is its breakthrough therapy designation (+20.6%). This designation is granted
when the FDA has determined that preliminary clinical evidence indicates that the drug may demonstrate
substantial clinical improvement over available therapies. Further positive clinical evidence in phase 2
increases the estimate by an additional +6.4%. Next, because it is a PARP inhibitor (+4.6%) that has been
previously approved for another indication (+3.6%), the POA is augmented by an additional 8.2%. Finally, its
treatment of a solid tumor type (-2.0%) and the net aggregate contribution of other features (-2.8%) penalize
the overall POA score slightly.
Example of probability decomposition
Figure 14: Decomposition of the probability of approval estimate for an anti-cancer drug that is currently in phase 3 clinical trials for prostate cancer. The top five
features that increase this program’s estimated probability of approval from the historical phase 3 to approval baseline in oncology of 35.0% to 71.8% are reported.
Abbreviations: POA=probability of approval; PARP= poly ADP-ribose polymerase.
20/ February 2021 © BIO | QLS Advisors | Informa UK Ltd 2021 (Unauthorized photocopying prohibited.)Although each individual prediction may have unique drivers, we can also extract the most informative
variables across all predictions to gain insight into some of the most common predictors of success. Figure
15 summarizes our results.
Feature importance by phase to approval
Phase I to Approval Phase II to Approval Phase III to Approval NDA/BLA
45%
40%
35%
Feature Importance
30%
25%
20%
15%
10%
5%
0%
Figure 15: The most important features of our random forest classifier across all predictions. Feature importance is normalized to sum to 100%. Note that individual
predictions may have unique drivers specific to a given therapeutic area, trial design, or drug profile that are not listed here. Source: QLS Advisors.
The indication was consistently ranked the top variable across all clinical development phases. Indeed, success
rates vary substantially across indications even within a therapeutic area. For example, in oncology, the overall
phase 1 to approval LOA ranges from a minimum of 1.1% (n=275) for pancreatic cancer to a maximum of 15.2%
(n=33) for alimentary cancers. We also observe that lead indication status, prior approval of a drug for another
indication, and biological target validation all have a significant impact on the probability of approval. In some
cases, developing an already approved drug for a new indication—one that has a controlled manufacturing
process, and has already been shown to be safe in humans—has a greater likelihood of success than a novel
indication. In other cases, the success rates for lead indications may be higher if a sponsor initiates clinical trials
for multiple follow-on indications for which the drug was not originally intended, and many of the initiated
clinical trials for the same drug fail.
Analysis showed that the trial outcome (whether the trial was completed, with its primary endpoints met) has
significant associations with late-stage clinical success. It is easy to imagine that a drug-indication pair whose
trial failed to meet its endpoints has a low probability of success in advancing to approval. For example, as
of December 31, 2020, our algorithm predicts that one specific BLA for Alzheimer’s disease has only a 65%
chance of progressing from regulatory review to approval, even though historically 83% of neurology drugs
have made the transition to approval once they have reached this stage. The observation that the biologic
failed to meet its primary endpoints in phase 3 is the top contributor (-15%) to this adjustment from the
21/ February 2021 © BIO | QLS Advisors | Informa UK Ltd 2021 (Unauthorized photocopying prohibited.)baseline. In contrast, candidates that achieve positive outcomes have a higher probability of success.
The use of patient pre-selection biomarkers in clinical trials has become more common, and it has been
reported that trials using biomarkers are more likely to succeed.3 Consistent with these findings, Figure
15 shows that the use of patient pre-selection biomarkers has an important impact on success rates. For
example, in the past decade, the number of non-targeted therapies in oncology has declined, while the
use of targeted agents and pre-selection biomarkers has risen dramatically. Between 2016 and 2020, 85%
(n=136) of oncology approvals were targeted agents. Moreover, 37% (n=51) involved either pre-selection
against a driver mutation (26%; n=36) or pre-selection using a tumor-specific antigen (11%; n=15).
In Figure 15, drug modality can be seen as another important predictor of success. As an illustrative example,
monoclonal antibodies have had higher phase-1-to-approval success rates (5.9%; n=935) than other
modalities within oncology. Moreover, immunotherapies focused on PD-1 or PD-L1 have been tremendously
successful from phase I (23.9%; n=71). In contrast, other immunotherapies, while numerous, have been
much more likely to result in failure from phase I (1.9%; n=945).
Finally, we find that sponsor track record, quantified by the number of previous successful phase transitions
in a given therapeutic area, is also a useful indicator for clinical program predictions. The positive correlation
between track record and future success is likely associated with operational experience in conducting
clinical trials and navigating the regulatory review process.
Performance
How well does machine learning predict success? A number of criteria have been proposed to measure
machine learning performance, some of them highly complex, but perhaps the most straightforward metric
is to see how many correct and incorrect predictions there are on an out-of-sample data set. We analyzed
the accuracy of our machine learning predictions by first splitting our dataset into a training set (80%) and
an out-of-sample test set that consisted of the most recent 20% of data. Figure 16 summarizes the results
for predictions for drug development programs transitioning through approval. We found that drugs with
higher probability estimates were more likely to be approved. Moreover, the predictions were relatively well
calibrated; when the model predicted a drug-indication pair had a certain probability of approval, the drug
was subsequently approved at approximately the same rate.
3
Wong CH, Siah KW, Lo A (2019). Estimation of clinical trial success rates and related parameters. Biostatistics, 20(2), 273–286. doi: 10.1093/biostatistics/kxx069
22/ February 2021 © BIO | QLS Advisors | Informa UK Ltd 2021 (Unauthorized photocopying prohibited.)Forecasted vs. actual success rates
Phase I to Approval Phase II to Approval
(n=1,739) (n=1,381)
60% 50.3% 70% 62.8%
Observed Frequency
Observed Frequency
50% 60%
40% 50%
40%
30% 21.2% 25.4%
30%
20% 9.5% 20% 14.9%
10% 1.7% 3.7% 10% 2.2% 4.3%
0% 0%
QLS Prediction QLS Prediction
Phase III to Approval NDA/BLA (N=444)
(n=621) 100% 96.6%
98.9%
Observed Frequency
90% 76.6% 80.8% 95%
91.1%
Observed Frequency
80%
70% 61.3%
90% 88.5%
60%
50% 83.1%
85%
40% 28.2% 33.1%
30%
20% 80%
10%
0% 75%
QLS Prediction QLS Prediction
Figure 16: Histogram of machine-learning forecasts of drug development programs transitioning to approval using the most recent 20% of our dataset. Higher
forecasts are associated with higher rates of approval, which indicates positive forecast power. Estimates for each phase are grouped into quintiles.
However, the results also demonstrate that these predictions are by no means perfect. There is considerable
noise in these estimates. In certain cases, our model tends to slightly underestimate the approval rates
in the most recent out-of-sample period. For example, success rates in oncology have been increasing,
concurrently with the emergence of genomic technologies, an improved scientific understanding of cancer
biology and ways to disrupt cancer cells, as well as an evolving regulatory environment that includes a higher
number of accelerated approvals. As we incorporate more data, more features, and the latest scientific and
medical knowledge into the algorithm, these forecasts will improve, which will occur naturally over time as
these methods become more popular. The QLS model is trained on the full dataset, which includes the most
recent development programs and approvals.
23/ February 2021 © BIO | QLS Advisors | Informa UK Ltd 2021 (Unauthorized photocopying prohibited.)Part 3. Drug Development Timelines
In addition to determining whether drugs are advanced or suspended at the end of a phase transition, the
Biomedtracker and Pharmapremia data can also be analyzed to yield time spent at each clinical stage, and
overall drug development timelines. These are valuable metrics as there are considerable opportunity costs
associated with investing in an R&D process that may take up to a decade, and a simple analysis of clinical
trial durations excludes the contribution of internal decision making and strategic execution from the overall
timeline.
Based on 6,151 successful phase transitions over the 2011–2020 period, it took an average of 10.5 years for
a drug to successfully progress from Phase I development to regulatory approval. This includes 2.3 years at
Phase I, 3.6 years at Phase II, 3.3 years at Phase III, and 1.3 years at the regulatory stage.
Phase duration can vary greatly according to numerous factors, such as disease area and indication, best
practices of clinical trial design, and patient availability. Accordingly, Figure 17 evaluates drug development
timelines for the major 14 categorized disease areas.
Disease areas with above-average LOAs tend to be associated with shorter development timelines. Five of
the seven best-performing disease areas by LOA fall beneath the 10.5-year average development duration,
including all four groups with a duration of less than 10 years (Allergy, Metabolic, Infectious disease, and
Ophthalmology). Conversely, the remaining disease areas, with below average LOAs, either have durations
that lie very close to the 10.5-year average duration, or in the case of Urology, Cardiovascular and Neurology,
notably exceed the average.
Phase transition durations by disease area
Phase Transition Durations from Phase I
Allergy 1.5 3.8 2.9 1.1 9.2
Metabolic 2.0 3.2 3.1 1.2 9.5
Infectious disease 2.0 3.5 3.1 1.2 9.7
Ophthalmology 2.1 2.9 3.4 1.3 9.8 Phase I to II
Autoimmune 2.1 3.6 3.2 1.1 10.0
Oncology 2.7 3.7 3.1 0.8 10.3 Phase II to III
Respiratory 2.1 3.5 3.3 1.5 10.4
Psychiatry 2.3 3.4 2.8 1.8 10.4
Phase III to
Others 1.9 3.5 3.2 1.8 10.5 NDA/BLA
All indications 2.3 3.6 3.3 1.3 10.5
Endocrine 1.8 3.4 3.7 1.8 10.7 NDA/BLA to
Approval
Hematology 2.2 3.4 3.6 1.5 10.7
Gastroenterology 1.6 3.9 3.9 1.4 10.8
Neurology 2.1 3.7 3.7 1.6 11.1
Cardiovascular 2.4 3.8 4.2 1.2 11.5
Urology 2.7 5.0 2.9 1.6 12.2
0 3 6 9 12 15
Duration of Phase Transition (Years)
Figure 17a: Phase transition durations from Phase I by disease area. Chart of phase transition duration from Phase I for all diseases. Source: Biomedtracker® and
Pharmapremia®, 2020
24/ February 2021 © BIO | QLS Advisors | Informa UK Ltd 2021 (Unauthorized photocopying prohibited.)You can also read