Colonization, early settlers and development: The case of Latin America - José G. Montalvo and Marta Reynal-Querol July 2020 - UPF
←
→
Page content transcription
If your browser does not render page correctly, please read the page content below
Economic Working Paper
 Series Working Paper No. 1729

 Colonization, early settlers
and development: The case
     of Latin America

     José G. Montalvo and
     Marta Reynal-Querol

           July 2020
Colonization, Early Settlers
and Development:
The Case of Latin America∗
José G. Montalvo
Universitat Pompeu Fabra-ICREA-IPEG and Barcelona GSE
Marta Reynal-Querol
Universitat Pompeu Fabra-ICREA-IPEG and Barcelona GSE
July 4, 2020
Abstract
In this paper, we document the long-run impact of the geographical
heterogeneity in skills among the first settlers to Latin America. To
this end, we compile administrative data on the early settlers in the
Americas between 1492 and 1540 including, among others, name, city of
origin, destination, and occupation. From a methodological perspective,
a focus on the initial period of colonization in Latin America offers
several advantages. First, differences in the geographical distribution of
∗
We are grateful for the comments and suggestions of Antonio Ciccone, Claudio Ferraz,
Ernesto Dal Bo, Ruben Durante, Federico Finnan, Elias Papaioannou, Hillel Rapoport,
Joachim Voth, and David Yanagizawa-Drott. We also thank participants in the Lacea-
Ridge Workshop, that of the International Economic Association, the PEDD International
Conference, and numerous university seminars. We benefited from exceptional research
assistance on the part of Miriam Artiles, Maria del Mar Garcia Roldan, Juan Carlos Muñoz-
Mora, Andreu Reixach, and Felipe Valencia. Financial support from the European Research
Council under the European Community ERC Grant Agreement n.647514, the Spanish
National Science Foundation AEI/FEDER, UE ECO2017-82696-P, and the Government
of Catalonia (ICREA) is gratefully acknowledged. We are also thankful for the financial
support provided by the Spanish Ministry of Economy and Competitiveness, through the
Severo Ochoa Programme for Centres of Excellence in R&D (SEV-2015-0563).
1occupations among the first settlers are likely to be accidental. Second,
a set-up that analyzes an area with a single colonizer (Spain) allows
to hold constant formal institutions and legal origin. Our results show
a relevant effect of the skills of first colonizers on long-run levels of
development of the areas located around the original settlements. We
find evidence of persistence in the form of market orientation and
entrepreneurial spirit.
21 Introduction
Much recent work on comparative development investigates the relevance of
large historical events. There has been a particular interest in colonialism and
its persistent impact on the long-run development of affected countries.1 Yet,
as argued by Michalopoulos & Papaioannou (2020), the colonial experience
looks more like a ”bundle treatment” than a single treatment. With regard
to Africa, for example, the identity of the colonizers is not common to all
the countries. This makes it difficult to disentangle the role of differences
in institutional set up or legal origin from the influence of culture, human
capital, and skills.
This paper analyzes the Spanish colonization of Latin America and, in
particular, the role of heterogeneity in skills among the first settlers. Our
choice of colonization area offers several crucial advantages. First, since
all the countries were originally settled by the same colonial power, the
findings are less subject to the bundle treatment criticism described above.
Additionally, since we analyze the first travellers from Spain to the Americas, it
is reasonable to assume that the geographical distribution of their occupations
was as good as randomly assigned given that the colonizers were settling in
previously unexplored, unknown areas. We show that settlers’ skills were, in
fact, very heterogeneous across locations. Importantly, this initial shock to
the distribution of skills persists over time. Our results show a lasting legacy
1
For a recent review of the literature on the historical roots of economic development
see Nunn (2020)
3of the initial distribution of occupations: areas where the first settlers had
a higher level of skills are currently more developed than those that were
settled by low-skilled settlers. To the best of our knowledge, this is the first
time that information on the skills of the first colonizers to the Americas has
been used for economic research.
Moreover, while previous related research has used statistical analyses (i.e.,
regression discontinuity, difference-in-differences, and instrumental variables)
to disentangle the causal relationships, the characteristics of our data generate
a natural experiment.
Specifically, we take advantage of several particular features of the set-
tlement process from Spain to the New World. First, for many years after
the discovery of the Americas, there existed just one legal point of departure
(Seville), which simplified the task of recording passenger lists. Second, the
Spanish Crown imposed strict restrictions on travel for some groups (e.g.,
Jews, Muslims, and converts). Therefore, those who wanted to travel to the
Americas had to show they did not belong to the banned population. Docu-
ments for this purpose along with passenger lists are preserved in the General
Archive of the Indies (Seville) and, taken together, provide a detailed picture
of the approximately 22,000 settlers in the Americas during the first period
of colonization (1492-1540). Gathering this information required extensive
archival work, the digitalization of long lists of passengers, and many old
maps. The data, which includes information on settlers’ name, city of origin,
destination, and occupation, show that, contrary to common belief, most of
4the travellers were not soldiers. That said, the fundamentals of colonization
imply that conquest and settlement were part of the same process.
Our empirical strategy is based on the fact that the initial colonizers
had no knowledge of the land they intended to conquer. This offers a quasi-
random situation: given that the discovered territory had not previously been
explored, their settling across it was as good as random. Specifically, we show
that the geographical distribution of high- and low-skilled colonizers was very
similar as far as concerns the pre-existing characteristics of the settlement
areas, supporting the exogeneity assumption relative to the location of the
first settlers. In addition, since the entire area was controlled by the same
colonial power, we are able to hold constant both formal institutions and legal
origin. Importantly, this pseudo-experiment shows that locations originally
characterized by a greater proportion of high-skilled settlers today have a
higher level of development than locations colonized by a low-skilled majority.
In particular, we find evidence of persistence in skill-level in the form of
market orientation, infrastructures, and entrepreneurial spirit.2
We also discuss some threats to inference. First, we show that the results
are robust to geographic, climatic, or pre-colonial characteristics, as well
as to controlling for different colonization periods, size of the colonization
cohort, colonizers’ route order, or penetration line. Second, although the legal
origin and institutions of the colonizer, Spain, were the same in all of the
2
Dell (2010) similarly shows that the persistent negative effect of Peru’s mining ”mita”
on current incomes is due to less-developed infrastructure and weaker production in the
market economy in areas without historical hacienda formation.
5areas, we consider whether the original official jurisdictional division, and the
time until their formal promulgation, had a relevant impact on the results.
Our estimations indicate, however, that these jurisdictional divisions have no
effect on the results. We also check that our findings are robust to alternative
measures of skills and sizes of the settlement catchment areas.
Our results contribute to several lines of research. First, there is a growing
literature on the persistent effect of skills and human capital on economic
development3 . However, very few papers explore this issue in Latin America.
Valencia (2019) finds that the higher educational attainment of some Guarani
people, due to the presence of Jesuit missions, persisted 250 years later in
areas of former Jesuit presence. Higher non-cognitive abilities are consistent
with occupational persistence and inter-generational knowledge transmission.4
Rocha et al. (2017) show that an initial shock in the skill composition of
migrants to some municipalities in Brazil in the late 19th and early 20th
century persisted over time, leading to higher long-run income per capita.
We similarly study the long-run effect of the distribution of skilled settlers
to Latin America, but going back to the initial period of colonization. Like
Rocha et al. (2017), who examine a single state in Brazil, we hold constant
5
institutions by assessing an area under the same colonizer. In our case, the
3
See Michalopoulos & Papaioannou (2020) and Michalopoulos & Papaioannou (2017)
for a detailed discussion of this body of work.
4
In the case of Africa, Nunn (2011) also finds a persistent effect of missionary schools
on educational attainment in various countries.
5
In fact, during the initial period there were no local formal institutions. Wantchekon
et al. (2015) find that, even in the absence of prior institutions, human capital has a large
impact on economic development in colonial Dahoney (Benin).
6issue of de jure institutions is arguably not an important caveat. Nonetheless,
we show the robustness of our results to informal institutional arrangements
that may have been at work at such early stage of colonization.
Second, our paper builds on studies that distinguish between different
types of human capital or abilities. Squicciarini & Voigtländer (2015), for
example, find that it is the upper-tail of human capital, and not the average,
which is critical in the transition from stagnation to growth. Meanwhile,
Gennaioli et al. (2013) emphasize the importance of entrepreneurial human
capital in regional development.
Third, our research also relates to work on the effect of long-term popula-
tion history on economic development. To this regard, there is a growing body
of work that studies the impact of changes in the composition of population
and migrations on long-run economic performance (e.g. Spolaore & Wacziarg
(2013) or Droller (2018)). Putterman & Weil (2010) examine the historical
legacy of populations, setting the year 1500 as a reference date to calculate the
share of contemporaneous population in each nation descended from people
of different countries of origin. They find that the history of the ancestor
population matters more than the history of the location. These results
indicate that populations who settled in the Americas bore certain traits that
made economic development more or less likely. Recently, Easterly & Levine
(2016) emphasize the importance of directly measuring colonial European
settlements in the early stages of colonization.
Fourth, our results intersect with a relatively new literature on the very
7long-run impact of culture, occupations, and skills. Several studies have
found that intergenerational mobility actually works much more slowly than
predicted by traditional models. Barone & Mocetti (2016) provide evidence
of persistence in belonging to elite professions after close to six centuries.
Opper & Andersson (2019) find that the entrepreneurial culture of the Ming
Dynasty (1368-1644) persists to the private activities of post-reform China
(1992-2012).6 In this paper, we document the very long-run impact of a
high proportion of skilled professionals through the persistence of pro-market
activities and entrepreneurial preferences.
Finally, as mentioned, much of the related literature focuses on colonial
shocks in Africa. Our paper joins a recent body of work that focuses on
historical colonial experiences in Latin America, such as Valencia (2019).
2 The mechanics of conquest and settlement
The original settlement of Spaniards in the Americas was an organized
endeavor, where private enterprise and legal coverage of the Spanish Crown
generated a sophisticated set of incentives. The Spanish conquest was carried
out by huestes, or expeditions, commonly known as hueste conquistadoras
(conquest expeditions) or hueste indianas (indian expeditions). The huestes
were comprised of a leader (traditionally called a conquistador or conqueror)
6
For a shorter period, Alesina et al. (2020) document how the Chinese Communist
Revolution failed to stop intergenerational transmission. Indeed, the grandchildren of
pre-revolution elites differ in cultural values, being more pro-market and individualistic.
Cultural traits thus seem to overcome even the strongest attempts to subdue them.
8and other individuals who, voluntarily and without payment, joined the
group. Under the leader’s protection, they undertook missions of discovery,
conquest, and settlement. A hueste was a private endeavor; from the outset
the Crown made clear that it would not finance these groups. The expeditions
did, however, have to share the benefits with the Crown, as they operated
under a license granted by the latter to the leader. The Alexandrine Bulls, in
particular the first bull, Inter Caetera, recognized the Castilian Crown’s claim
to any discovered lands not already held by a Christian prince. In practical
terms, this meant that no one could enter the newly discovered land without
authorization from the King of Spain.
The ”Manual of Indian Law” provided the legal guide for Castilian ex-
pansion in America. From the outset, conquest, discovery, and settlement
were all conceived as part of the same process. In fact, the individuals who
made up the huestes were not soldiers, as has sometimes been assumed, but
rather settlers who were originally merchants, doctors, etc. Furthermore, it
was in the interests of the Crown that the already discovered and conquered
territories not be dismantled by the migration of their inhabitants to other
sites. In the words of the time, the land needed to be ennobled, that is,
filled with houses, inhabitants, its natural agricultural, mining, and livestock
resources exploited. Until that occurred, no authorization was granted to
migrate to other lands. Indeed, this explains why the actions of conquest
and settlement were considered to be elements of the same endeavor. To this
regard, Lockhart et al. (1976) provide an exemplary description:
9“Since conquest and settlement were one single ongoing process in Spanish
America, we are a little reluctant to emphasize the distinction between
them....yet only in this way we can illustrate to what an extent the conquerors
were acting like immigrants, businessman and settlers.”
The locations of the settlements had to comply, following the indications
of the Spanish administration, with the rules of Saint Thomas Aquinas, who
listed the ”indispensable” characteristics that a territory should have: access
to potable water, proximity to construction material (wood), nearness to
forests and cultivable land, etc. These recommendations applied to all the
settlements.
Often, the initial resources of these expeditions were recorded in contracts,
or licenses, called capitulaciones. Evidence shows that the contributions made
by the hueste participants were then considered when distributing the booty,
whereby members were rewarded in function of their inputs.
As evangelization was a fundamental objective of Castilian expansion to
the Indies, the huestes did not accept non-Catholics. As a result, Muslims,
Jews, heretics targeted by the Inquisition and their descendants, were excluded
from these expeditions. Similarly prohibited were gypsies, married slaves
without his wife and children, single women without a license, or married
without their husbands. This aspect is very relevant, as these restrictions
were the reason for the Spanish administration’s endeavor to record the name,
origin, accompanying party, etc. of all the initial travellers to the Americas.
To summarize, Spanish colonization of the Americas was mostly a process
10of urban occupation, where settlement and conquest went hand in hand.
The location of the original sites was decided based on a common set of
simple rules. Finally, settlers were not typically soldiers but people of diverse
occupational backgrounds.
3 Data
In this section, we describe the data. A gathering of information on the first
settlers to the Americas is possible thanks both to the fact that there was
just one legal port of departure, and to the existence of restrictions on travel
to the New World. In order to verify whether potential travellers met the
criteria allowing for embarkation, the authorities required various documents,
now preserved in the General Archive of the Indies in Seville.
Until 1668, the sole legal port of departure for ships going to Las Indias
(the ”Indies”) was Seville. Beginning in 1492, the Casa de la Contratación
de las Indias (House of Trade of the Indies; byname House of the Indies)
compiled information on all passengers who travelled from Seville to the Indies
as part of the commercial regulation of the American colonies. These files
are archived in the above-mentioned General Archive of the Indies, where the
original information appears in two types of documents. The first comprises
the so-called informaciones y licencias, or information and licenses, necessary
to prove to the officers of the House of the Indies that they were not prohibited
from travelling. As described in the previous section, Jews, Muslims, converts,
11and those judged by the Inquisition were not permitted; only those of proven
Christian origin could embark. Evidence to this regard included baptismal
and marriage records, containing demographic information not only on the
passenger but their accompanying party (wife and children). The preservation
of such documents provides a rich source of information on these travellers.
The second type of document consists of passengers’ lists, or the Libro de
asientos de pasajeros. These files include the names of the passengers (double
checked upon boarding the ship), the name of the vessel, and its captain. By
merging the names of the passengers who appear in both types of documents,
it is possible to construct registries that include the travellers’ complete name,
status as head of the family, marital status, wife and children travelling with
him/her, town/city/place of origin in Spain, and destination city7 in the
Americas.8
Luis Rubio y Moreno, Deputy Director of the General Archive of the
Indies, began the classification of these documents in 1915, and supervised
work on the entries between 1492 and 1559. This endeavor was subsequently
taken over by Cristobal Bermudez, who compiled all the information into
7
This element was not declared at embarkation but is possible to identify by searching
the documents of the Catalogo de los pasajeros a las indias (Catalogue of passengers to
the Indies).
8
There is a general consensus among scholars of the colonial history of Latin America
that these official lists, during the initial decades of colonization, captured most of the
passengers. In the 18th century, a liberalization policy began to allow trade between
colonies and many other Spanish ports. It is hence possible that an individual might have
embarked on a ship to England and from there to the Spanish colonies aboard an illegal
vessel transporting merchandise; at the time, non-Spanish ships were still prohibited in
Castilian colonies. Captains may also have been occasionally bribed to allow a passenger
to board without being legally registered.
12three volumes.9 Then, Peter Boyd-Bowman, after 30 years of laborious
archival work, complemented the original compilation with his five volumes.
He systematically organized all the data contained in the Catalogo de los
pasajeros a las indias (Catalogue of passengers to the Indies), as well as added
information from many other sources available in the General Archive, in
an effort to enrich the personal information on the passengers, in particular
relative to destination and occupation. With regard to destination, Boyd-
Bowman utilized thousands of documents coming from the Americas (letters,
contracts, payrolls, commercial agreements, royalties, capitulaciones, etc.)
preserved in the General Archive. As he considered only those passengers
who matched with documentation from the Americas, the final list comprises
settlers who arrived in the New World.10 Specifically, the first volume, Boyd-
Bowman (1956), contains information from 1493 to 1519, while the second,
Boyd-Bowman (1964), covers settlers from 1520 to 1540. These first two
volumes thus include the first wave of settlers.11
9
See Bermudez (1940-46). These volumes cover the period of 1509 to 1559. In the
early 1980s, specialists of the General Archive published volumes IV to VII, which cover
the period of 1560 to 1599.
10
Thus explaining why the book is called Primeros pobladores (First settlers) as opposed
to first migrants or passengers.
11
They also include references by the author to the other three volumes, covering the
period of 1541 to 1599. Unfortunately, however, the latter were unpublished manuscripts
that went missing after Peter Boyd-Bowman died in 2010. Although we contacted Boyd-
Bowman’s family (widow, son, and daughter), as well as administrators and colleagues, the
manuscripts remain unfound. In addition, we checked the library of his university, as well
as inquired about a potential donation of the manuscripts, but have been unable to locate
the three missing volumes. Regardless, this does not represent an important shortcoming
as, for methodological reasons, we work only with the settlers in the very first colonization
wave.
13Boyd-Bowman’s work provides a particularly rich source of information
in that he was able to match the names on the passenger list with many
other documents. Through use of more than 500 sources in addition to the
Catalogue, he was able to add valuable data to the original registries. Boyd-
Bowman also cleaned the data of double entries and completed information
on the origin and destination of each settler. Indubitably, his work provides
the best source of information on the origin, destination, occupation, and
other background characteristics of the first settlers to the Americas.
Our final dataset thus contains information, classified by year of departure,
on the name and surname of all the settlers, village of origin in Spain, initial
destination in the Americas, occupation, movements within the Americas
(trips, expeditions, conquests, “cargos, privileges), and year and place of
death. An example of the wealth of information provided for each settler is
illustrated by the following example, taken from Boyd-Bowman’s first volume:
3564. Gómez, Hernán, resident in Tui (province of Pontevedra), wife
Francisca de Rubiales and sons Lucas and Juanico, destination Indies in 1512
(volume I page 59512 ), occupation court clerk, arrived in Santo Domingo in
1512, resident of Yaquimo (Santo Domingo) in 1514.
These detailed descriptions allow to not only geographically locate the
first settlers of the Americas, but to analyze their occupational profiles, and
the potential role of the latter in shaping local economic development. We
12
The volume and page refer to the location of the traveller in the compilation of
Bermudez (1940-46)
14consider only the initial period of settlement (1492-1540) since, during this
period, colonization of the Americas covered the extension of the continent
from northern Mexico to Argentina. Our database includes a total of 21,912
settlers.
After digitalizing and codifying all of this information, and using additional
sources available in the General Archive (in particular, old maps depicting the
positions of the original settlements), we geolocalized the destination-locations
of the settlers. While the names of the cities of origin are easy to match with
their contemporary counterparts, matching the names of some destination
areas with their current locations represents more of a challenge. That said,
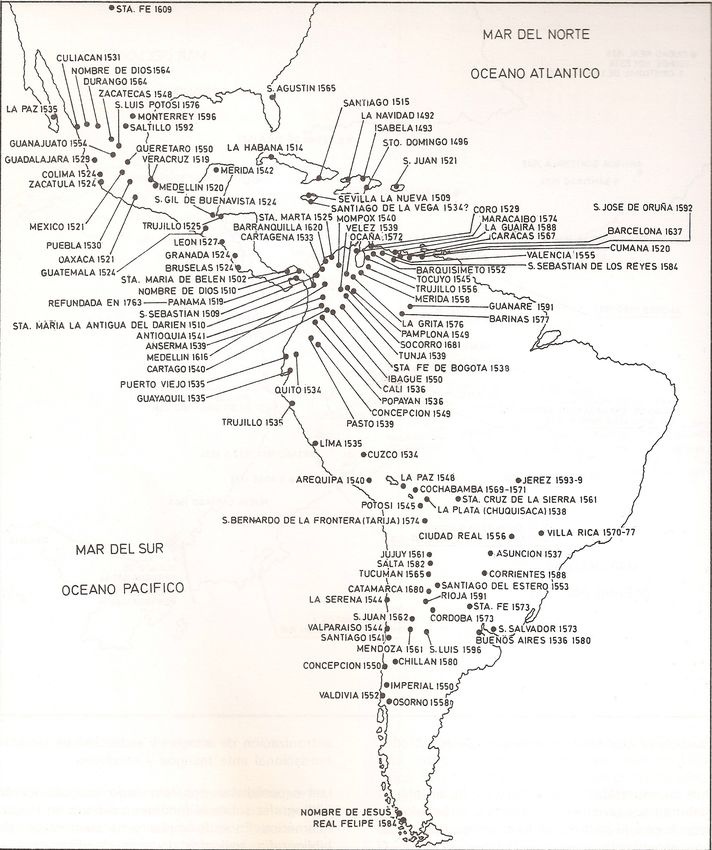
in many cases, the corresponding name is relatively straightforward; Morales
Padron’s (1988) map of settlements in the Americas during the XVI century
(Figure 1) confirms the location of most of these places. For other locations, an
investigation into town name changes was necessary. Ultimately, the number
of settlers for whom we have the precise geolocated destination amounts to
13,692. We denote this sample as PLS (Precise Location Sample).
For other settlers, we have only an area or region. When the destination
refers to an area, we look for the settlement that was active in that particular
year. Most of these cases can be matched using the work of Lopez de Velasco,
cosmographer sent by the Spanish authorities in 1571 to map the Spanish
settlement at that time.13 We consider two approaches to geographically
13
Lopez de Velasco (1573), reprinted in López De Velasco (1894). The author was also
known for constructing instruments to measure longitude using lunar eclipses.
15allocate the colonizers that were assigned to a region. In the first approach,
settlers are assigned to the closest settlement with a similar year of first
colonization. In the second approach, the colonizers of a region are assigned
to the settlement on the same colonization route with the lowest difference
in the year of first colonization. That is, regions are first associated to a
colonization route. Then, among the colonial settlements associated to a
same colonization route, we choose the settlement with the lowest difference
between its first year and the first year of the region. Summarizing, the first
procedure implies matching the destination with the oldest settlement in the
area. The second relies on assigning travelers to the oldest settlement along
the penetration line going through that region.
16Figure 1: Early settlements in the Americas. Source: Morales Padron
(1988)
These criteria allow us to locate the first settlements of Spanish colonizers
to the Americas. Figure 2 depicts the locations of all the settlements identified
for the period 1492-1540, where the size of the bubbles reflects the number of
settlers in the final year of the period.
17Figure 2: Early colonial settlements by number of settlers in 1540. Source:
Own elaboration.
For our study, the occupations of these first settlers is a fundamental
variable. Traditionally, historians have argued that most early settlers in
the Americas were soldiers but, as argued in Section 2, the data suggests
this to be a misconception. To this regard, Lockhart (1968) shows that
early settlers came from a variety of occupational backgrounds.14 Our data
confirm his findings: we find 274 different occupations among the first settlers.
Some examples include: banker (banquero), lawyer (abogado), pharmacist
14
Leon (2007) describes the travellers from Spain as a “small representation of Castilian
society at the end of the XV Century.”
18(boticario), barber (barbero), butcher (carnicero), dentist (dentista), doctor
(doctor médico), nurse, farmer (labrador ), merchant or trader (mercader ),
weaver (tejedor ), servants (siervos), etc.
Initially, we sought to associate occupations with a certain level of edu-
cation, understood as years of instruction or highest degree. This endeavor
was, however, hindered by a lack of relevant historical sources needed for an
accurate categorization. It is, however, possible to classify the occupations
using a set of skills derived from the precise description of jobs at the time.
For the purpose of matching skills to occupations, we follow the criteria of
Ladero Quesada (1980), who analyzes the structure of Spanish society around
1500. We consider as having a relatively high level of human capital those
individuals with occupations requiring skills such being able to read and write,
or necessitating entrepreneurial drive. Therefore, the skilled settlers include
those with occupations such as doctor, lawyer, pharmacist, etc. Unskilled
workers include those with occupations ranging from peasants (jornaleros)
to servants (criados). There exists some evidence of the relative contribu-
tion of skilled versus unskilled workers during this period. For instance,
Lockhart (1968) argues that ”the only Spanish class that contributed really
almost nothing, as a functioning group, to Spanish Peruvian society, were the
peasants.”
Figure 3 depicts each of the destinations according to the proportion of
settlers who were skilled, based on the previous definition. The colors of the
dots on the map show a clear heterogeneity across locations in terms of the
19first settlers’ skills levels.
Figure 3: Share of settlers with skills. Source: Own elaboration.
4 Methodology and basic results
In this section, we discuss identification as well as present the basic results.
Our aim is to determine whether the proportion of skilled settlers among the
early Spanish colonizers can explain differences observed in today’s levels of
development around the original locations. Our identification strategy rests
20on the exogenous nature of the initial Spanish settlements. The territorial
expansion from 1492 to 1540 of the urban centers settled by Spanish colonizers
extended between the 25th parallel north and the 35th parallel south; reaching
from Zacatecas (northern Mexico) to Buenos Aires.
In less than fifty years, colonizers had settled and founded cities across a
very large territory, with considerably diverse geography, and climate. Our
choice of colonial area and time frame is driven by the pseudo-experimental
nature of this period, which allows for a clean identification of the impact
and persistent effect of the skills, or human capital brought by the colonizers
on current levels of development. Crucially, we consider an area under a
single colonial power, allowing to avoid a bundling of institutions and human
capital.15 In addition, we use the period of initial colonization (1492-1540),
when differences in the skills of the colonizers across settlements are more
likely to be exogenous than at later stages. Their location is also likely to be
random and, therefore, exogenous and uncorrelated with the characteristics
of potential economic activity in the place of destination. Indeed, the first
settlers had no idea of whether certain areas offered a comparative economic
advantage, given that the geography of the New World was unknown. As
described above, their only guidance consisted of the recommendations of
Saint Thomas Aquinas on suitable locations for settlements, together with the
King’s prohibition on migrating from a new settlement before it was firmly
15
In the next section, we present the results of a robustness exercise that considers the
potential role of local and informal institutional arrangements.
21established.
Additional evidence similarly points to a lack of knowledge about the
geography and potential advantages of different areas of the Americas. During
the initial phase of colonization, even the capitulaciones contained very
imprecise geographical allocations, to the point that in many cases, the area
granted in fact consisted of a piece of the Pacific Ocean, a non-existent
island, or a high mountain. Garcia-Martinez (1970) argues that conquerors
could be lucky or unlucky in terms of the land allocated to them in the
capitulacion, reflecting just how random the process of initial settlement was.
It was precisely due to such uncertainty about the geography of the New
World that in 1571 the Spanish authorities decided to send Lopez de Velasco,
cosmographer and chronicler, to demarcate and describe the geography of the
settlements(López De Velasco, 1894)16 .
Accordingly, it is also very likely that the geographical distribution of
settlers by skills is exogenous. Our approach takes advantage of this natural
experiment of the original Spanish colonization period, thus avoiding the
elusive search for instruments for current/recent past levels of human capital.
To analyze the contemporary level of development of each area, we con-
struct buffers of 20km around the original settlements17 and consider the
effect of the skills of the original settlers conditional on many other potential
factors that could explain today’s levels of economic development. Indeed,
16
Reprinted from the original version from 1573.
17
In the next section, we show the robustness of the results to buffers of different sizes.
22the original locations do not generally correspond to current administrative
divisions, making it necessary to proxy income per capita in the buffer around
the original settlement. While the main outcome variable is per capita income
for the buffer area around the original settlement, good-quality data on income
per capita is difficult to find at the buffer level. We thus follow Henderson et
al. (2012) and use luminosity at night as a proxy for development. Satellite
night-light data are available from the National Oceanic and Atmospheric
Administration. Chen & Nordhaus (2011) find that luminosity does, in fact,
have informational value for countries, regions, and areas with poor quality or
missing data. Several papers have also found a very high correlation between
luminosity and GDP at the country level. For instance, this type of data has
been used by Michalopoulo & Papaioannou (2013) and Alesina et al. (2016),
among others. We use Oak Ridge National Laboratory’s (ORNL) Landscan
data for population information at each buffer.
The basic specification is:
X
log gdpji = αi + βHCji + γk zkji + ji
where log gdpji is the log of per capita night-light in 2010. The variable HC is
a proxy that measures the skill levels of the first settlers. The basic variable
is the proportion of skilled settlers at the end of the period (1540).
We also consider controls for geography, using distance to the sea, average
23roughness,18 and average elevation, and control for climate using average
precipitation and average temperature (CRU). Finally, we include as control
variables soil quality (% fertile soil), closest distance to a river, and closest
distance to a lake. We calculate averages at each buffer. Finally, we include
area-period fixed affects to complete the list of controls. To calculate the
standard deviations, we cluster at different levels of aggregation (8 by 8
degrees and 10 by 10 degrees). Table 1 summarizes the descriptive statistics
of these variables. The sample includes those settlers who have a precise
destination.19 We identify 123 settlement-locations of the colonizers who
arrived up until 1540. This is consistent with the 189 locations mentioned in
López De Velasco (1894) for the year 1574.
18
Nunn & Puga (2012)
19
The results presented in the tables of the following sections are not affected when
using either the full sample or that of the settlers with a precise location. In the robustness
section, we show that the results are not altered by using the full sample.
24Table 1: Descriptive statistics
mean sd
Dependent variable
Ln night-light 2010 per capita -3.056 0.743
Settlers and skills
Total settlers 111.317 505.599
% skilled settlers 0.684 0.317
Predominance of skilled settlers (>75 %) 0.504 0.502
Approach 1- % skilled settlers 0.674 0.297
Approach 1 Predominance of skilled set- 0.455 0.500
tlers (>75 %)
Approach 2- % skilled settlers 0.671 0.299
Approach 2 Predominance of skilled set- 0.480 0.502
tlers (>75 %)
Geography and climate variables
Log temperature 4.394 0.755
Log precipitation 2.915 0.273
Log distance to river 2.770 0.407
Log distance to lake 5.166 1.206
Log distance to coastline 4.191 1.120
Log ruggedness index 20.608 0.323
% Fertile soil 50.994 30.331
Number of settlements 123 123
Table 2 examines the relationship between geography and climate, and
the proportion of settlers with high skills by location. In column 1, we use
the percentage of settlers with skills in each location.
In column 2, we consider the explanation of a dummy variable that takes
a value of 1 if more than 75% of the settlers are skilled. The two specifications
show that geography and climate cannot explain the location of skilled versus
unskilled settlers. It would therefore seem that the distribution of skilled
versus unskilled settlers was random with respect to weather, geography, and
25soil fertility.
Table 2: Determinants of the distribution of skills of the first colonizers
Dep. Var: % with Skills (all years) Dep. Var: Majority with Skills
(1) (2)
Log. Temperature -0.044 -0.041
[0.039] [0.082]
Log. Precipitation -0.036 0.083
[0.126] [0.226]
Log. Distance to Coastline -0.049 -0.047
[0.037] [0.064]
Log. Ruggedness Index 0.236∗ 0.338
[0.125] [0.216]
Log. Distance to River 0.131 0.038
[0.081] [0.111]
Log. Distance to Lake 0.024 0.073∗
[0.026] [0.041]
% Fertile Soil 0.001 0.000
[0.001] [0.002]
Observations 123 123
R-squared 0.076 0.066
Notes - Robust standard errors in brackets.∗ Significant at 10%, ∗∗ at 5%, and ∗∗∗ at 1%.
Table 3 presents the results on the relationship between the proportion
of skilled early settlers and long-term local development. The explanatory
variable is the percentage of skilled early settlers in 1540. Column 1 shows
that the locations that received a higher percentage of skilled early settlers
are more developed today than those that received a low proportion of
skilled individuals. The estimation is not only statistically significant but
economically very relevant: areas that received only high-skilled settlers
have a 60% higher level of GDP per capita than do areas that received only
low skilled settlers. This result is basically unaffected if we add controls for
geography and climate as in column 2. The results do not change qualitatively
if we add controls for land quality, as measured by the percentage of fertile soil,
26and proximity to potable water, as measured by distance to the closest river or
lake (column 3). These results are consistent with those described above, and
with the findings in Table 2, which show that land characteristics, geography,
and climate, did not determine the location of skilled versus unskilled settlers.
In column 4 we include colonization period fixed effects, which, in fact, also
correspond to particular colonization areas. Finally, columns 5 and 6 of Table
3 show the results of clustering at different geographical levels. In particular,
column 5 uses clustering for cells of 8 by 8 degrees, while column 6 uses cells
of 10 by 10 degrees.20
Table 3: Development and skills of the first colonizers
Dependent Variable: Log. Night-light 2010 per capita
(1) (2) (3) (4) (5) (6)
% with Skills (all years) 0.610∗∗∗ 0.588∗∗ 0.668∗∗∗ 0.633∗∗∗ 0.633∗∗∗ 0.633∗∗∗
[0.230] [0.236] [0.231] [0.227] [0.115] [0.137]
Geographic Variables No Yes Yes Yes Yes Yes
Climate Variables No Yes Yes Yes Yes Yes
Fertile Soil No No Yes Yes Yes Yes
Distance to River No No Yes Yes Yes Yes
Distance to Lake No No Yes Yes Yes Yes
Colonization Period FE No No No Yes Yes Yes
Observations 123 123 123 123 123 123
R-squared 0.068 0.101 0.135 0.172 0.172 0.172
Notes - Robust standard errors in columns 1 to 4. In column 5, robust standard errors clustered at grid cells of 8 degrees × 8 degrees. In column 6, robust
standard errors clustered at grid cells of 10 degrees × 10 degrees. ∗ Significant at 10%, ∗∗ at 5%, and ∗∗∗ at 1%. Geographic variables include: distance to
coastline and ruggedness index. Climate controls: average temperature from 1961-1980 and average precipitation from 1961-1980.
5 Robustness analysis
In this section, we assess the robustness of the findings to using alternative
definitions for the skilled settlers, early institutions, and other controls.
20
We thank Hillel Rapoport for suggesting this clustering scheme. The results are
also robust to clustering at the colonization period (area), which borders are close to old
governaciones, and today’s countries.
275.1 The role of settler density
First, we consider whether the effect of skilled settlers is a reflection of the
size of the settlement. Areas with high settler density could have more skilled
settlers than did areas with low densities. To check that this is not driving
the results, Table 4 includes the log of total colonizers in early years. The
estimation is unaffected by the inclusion of the size of the population that
arrived in each settlement. Further, we assess whether the settlers of the first
location along a penetration route had different characteristics than colonizers
who settled further along on the same penetration route. For example, a
potential story could be that old or ill colonizers could not continue with the
hueste and were, therefore, those who settled in the first locations. In order
to explore whether this could affect our results, we include the order of the
respective settlements along a penetration route in Column 2. The results are
not affected by the inclusion of this new variable. Finally, in the last column
we control for pre-colonial population density, from Maloney & Valencia
(2016), in the baseline specification. The coefficient on the percentage of
skilled settlers is positive, statistically significant, and of similar size relative
to the basic regressions.
28Table 4: Development and skills of the first colonizers.
Robustness I
Dependent variable: Log. 2010 night-light per capita
(1) (2) (3)
% with Skills (all years) 0.620∗∗∗ 0.542∗∗ 0.485∗∗
[0.225] [0.256] [0.210]
Log Total Colonizers Early Years -0.107
[0.094]
Geographic Variables Yes Yes Yes
Climate Variables Yes Yes Yes
Fertile Soil Yes Yes Yes
Distance to River Yes Yes Yes
Distance to Lake Yes Yes Yes
Colonization Period FE Yes Yes Yes
Colonizer Route Order No Yes No
Pre-colonial pop density No No Yes
Observations 123 123 98
R-squared 0.183 0.261 0.309
Notes - Robust standard errors in brackets.∗ Significant at 10%, ∗∗ at 5%, and ∗∗∗ at 1%. Geographic variables include: distance to coastline and ruggedness
index. Climate controls: Average temperature from 1961-1980 and average precipitation from 1961-1980.
5.2 Early institutions
Yet another important issue to consider is whether the effect of early skilled
settlers is confounded by the impact of initial institutions. In our analysis,
the entire area falls under the Spanish Kingdom, where Spanish colonizers
brought with them the same institutions. That said, historical evidence
seems to indicate that there were, in fact, very few formal institutions at
this very early stage of colonization. The only formal institution consisted
of the audiencia, or tribunal of administration and justice. The audiencias
were responsible for ensuring the implementation of law and order and, in
particular, intervening in cases where issues arose involving conquerors. Yet,
audiencias were often far from early settlements; in other cases, an audiencia
had not yet been established at the moment of founding a given settlement.
29In addition to the audiencias, a second source of rules and regulations
existed in the figure of the conqueror. In signing a capitulacion, the conqueror
was recognized as an informal source of law and order, and as such held
most of the power at the colonization stage. Thus, although there existed
some audiencias, conquerors in areas far away from the Audiencias may
have had few constraints on their control. In order to capture this early
institutional framework, we use as proxies several measures of audiencias and
the penetration paths of the conquerors.
Figure 4 depicts the two audiencias established before 1540: Santo
Domingo (established in 1511) and Mexico (established in 1527). The number
of audiencias then increased rapidly after 1540, as shown in Figure 5. This
means that before 1540, the political centers of many settlements were located
quite far away, implying that the conquerors were likely the foremost source
of law and order.
30Figure 4: Audiencias established before 1540
31Figure 5: Audiencias at the end of the XVI Century
The expedition paths followed by the conquerors are known as ”penetration
lines.”21 We geo-digitalized fifty-one expedition paths for the period before
1540, which correspond to 31 conquerors. They are composed of either entire
expedition paths or segments. For each line, we have information about
the starting year, end year, and name of the conqueror. Figure 6 depicts
21
Information on the penetration lines comes from the Atlas del Descubrimiento de
América y Oceanı́a, which uses Montana (1943) as a basic source.
32these penetration lines, showing that, as expected, early settlements are very
close to these paths. Figure 7 provides a closer view of the penetration lines
in Central America before 1540. We associated the location of the various
settlements with their corresponding penetration line, and the conqueror
leading each expedition.
Figure 6: Penetration lines before 1540
33Figure 7: Detail of penetration lines in Central America
In Table 5 we analyze the robustness of the basic results to the inclusion
of different proxies that capture the early institutional framework. In column
1 we include the log of the distance from each settlement to the closest
audiencia, as a control for the latter’s ability to exercise power over each
location. In column 2 we include a dummy that takes a value of 1 if at
the year of first settlement there was no official audiencia (basically those
34settlements before 1512). In column 3 we include the years without an official
audiencia as an alternative measure of a lack of formal institutions. Finally,
in column 4 we include the penetration line of the conqueror as a proxy for
the conqueror-penetration line effect. The results presented in Table 5 show
that taking into account early institutions does not alter the basic finding:
the initial settlements with a high proportion of skilled settlers perform better
in the long run than do those with many unskilled settlers.
Table 5: Development and skills of the first colonizers.
Audiencias and colonizer effect
Dependent variable: Log. 2010 night-light per capita
(1) (2) (3) (4)
% skilled settlers (all years) 0.623∗∗∗ 0.621∗∗∗ 0.643∗∗∗ 0.857∗∗∗
[0.231] [0.212] [0.220] [0.304]
Log Dist. Audiencia before 1540 0.047
[0.047]
Colonial settlements without an -0.713∗∗∗
official Audiencia at foundation
[0.241]
Number of years without an offi- -0.046∗∗
cial Audiciencia
[0.020]
Geographic Variables Yes Yes Yes Yes
Climate Variables Yes Yes Yes Yes
Fertile Soil Yes Yes Yes Yes
Distance to River Yes Yes Yes Yes
Distance to Lake Yes Yes Yes Yes
Colonization Period FE Yes Yes Yes Yes
Colonizer Route FE No No No Yes
Observations 123 123 123 123
R-squared 0.182 0.221 0.197 0.563
Notes - Robust standard errors in brackets.∗ Significant at 10%, ∗∗ at 5%, and ∗∗∗ at 1%. Geographic variables include: distance to coastline and ruggedness
index. Climate controls: average temperature from 1961-1980 and average precipitation from 1961-1980.
355.3 Alternative measures of skills
In Table 6 we analyze the sensitivity of the results to an alternative measure
of skills. We construct a dummy variable to capture locations with a very
high proportion of skilled settlers. Specifically, in column 1 we include a
dummy that takes a value of 1 if the percentage of skilled settlers is larger
than 75%.
In the previous sections, we considered those settlers for whom we know
their exact destination. However, for other settlers, rather than their exact
destination we have only a reference to the region. In the data section,
we discussed potential approaches that might be adopted to incorporate
this information. The first implies matching the destination with the oldest
settlement in the area. The second relies on assigning travelers to the oldest
settlement along the penetration line going through that region. Table 6
presents the results using all the settlers, showing that the estimation is
consistent with the basic findings.
36Table 6: Development and skills of the first colonizers
All settlers
Dependent variable: Log. 2010 night-light per capita
Approach Approach Approach Approach
1 1 2 2
(1) (2) (3) (4) (5)
% with Skills (all years) 0.600∗∗ 0.576∗∗
[0.262] [0.253]
Majority with Skills (>75) (all years) 0.308∗∗ 0.288∗∗ 0.235∗
[0.130] [0.129] [0.131]
Geographic Variables Yes Yes Yes Yes Yes
Climate Variables Yes Yes Yes Yes Yes
Fertile Soil Yes Yes Yes Yes Yes
Distance to River Yes Yes Yes Yes Yes
Distance to Lake Yes Yes Yes Yes Yes
Colonization Period FE Yes Yes Yes Yes Yes
Observations 123 123 123 123 123
R-squared 0.144 0.158 0.139 0.156 0.128
Notes - Robust standard errors in brackets.∗ Significant at 10%, ∗∗ at 5%, and ∗∗∗ at 1%. Geographic variables include: distance to coastline and ruggedness
index. Climate controls: average temperature from 1961-1980 and average precipitation from 1961-1980.
5.4 Size of the relevant area
In this section, we consider the effect of changing the size of the buffers that
define the area of interest. Specifically, we consider 10 km, 20 km, and 30 km
buffers. Since the areas become much larger, situations of overlap can arise
across different buffers. In such cases, we drop the area that was founded
later.
The results in Table 7 confirm the basic results: the proportion of skilled
settlers has a positive effect on long-run development. The estimated coeffi-
cient for the percentage of skilled settlers is very similar to that obtained in
previous tables.
37Table 7: Development and skills of the first colonizers
Alternative sizes for the buffers (non-overlapping)
Dependent variable: Log. 2010 night-light per capita
10km buffer no 20km buffer no 30km buffer no
overlapping overlapping overlapping
(1) (2) (3)
% with Skills (all years) 0.623∗∗ 0.698∗∗∗ 0.641∗∗
[0.240] [0.244] [0.300]
Geographic Variables Yes Yes Yes
Climate Variables Yes Yes Yes
Fertile Soil Yes Yes Yes
Distance to River Yes Yes Yes
Distance to Lake Yes Yes Yes
Colonization Period FE Yes Yes Yes
Observations 117 112 108
R-squared 0.152 0.183 0.145
Notes - Robust standard errors in brackets.∗ Significant at 10%, ∗∗ at 5%, and ∗∗∗ at 1%. Geographic variables include: distance to coastline and ruggedness
index. Climate controls: average temperature from 1961-1980 and average precipitation from 1961-1980.
6 Analyzing the persistence mechanism
The results of the previous sections demonstrate that the areas in Latin
America that received the highest proportions of skilled settlers today have
greater income per capita than places that received large numbers of unskilled
settlers. In this section, we assess several possible drivers behind the persis-
tence mechanism. While the economic literature has documented a notable
persistence of important historical events on comparative development, there
is long-standing debate over the mechanism that explains this persistence.
Much work centers around early institutions, cultural traits, and human capi-
tal. In our case, the early institutions of the Americas are relatively uniform,
being linked to a single colonial power. We also control for the possibility of in-
formal early institutions, namely powerful conquerors far from the audiencias.
38Crucially, the source of the initial shock is the different distribution of skills
of the first settlers. As discussed in Section 2, the latter is not necessarily
the same as the distribution of education, given that matching occupations
of the time and education represents a significant challenge.22 Here, the
occupations considered as high skilled share a common characteristic: they
imply a certain degree of entrepreneurship. Murphy et al. (1991) and Baumol
(1990) likewise consider the central role of entrepreneurship in the process
of economic growth. In line with Baumol (1990), we define entrepreneurs
broadly, as ”persons who are ingenious and creative in finding ways that add
to their own wealth, power, and prestige.”23 Artisans, doctors, etc. must
necessarily invest and accept some risk to develop their activities. By contrast,
the low-skilled group includes laborers, such peasants and servants, who work
for others. Our analysis therefore relies on differences in the supply of local
entrepreneurial skills and assesses their persistence over time. Prior research
shows evidence of the long-term stability of certain attitudes. For instance,
Necker & Voskort (2014) and Dohmen et al. (2012) provide empirical support
for the persistence of attitudes such as the willingness to take risks. There
is also evidence of persistence in occupations over generations.24 . Opper &
22
Occupations have frequently been employed in studies that analyze very long-run
processes. For instance, the intergenerational mobility literature often uses occupational
change as a metric of mobility when conducting comparisons with earlier periods. See
Long & Ferrie (2013) or Barone & Mocetti (2016)
23
This definition is similarly adopted in Opper & Andersson (2019)
24
See, for example, Long & Ferrie (2013). The focus here is less on intergenerational
occupational persistence than on the transmission of the entrepreneurial content of the
occupations. To this regard, recent research by Barone & Mocetti (2016) shows evidence
of persistence of elite professions across many generations.
39Andersson (2019) analyze the long-term stability of entrepreneurial culture
and talent pools using occupational choice in preindustrial China. They find
strong persistence in the regional distribution of entrepreneurial skills, which
correlates with the performance of regions in post-reform China.
In light of such studies, which find persistence driven by the intergenera-
tional transmission of cultural values and attitudes, it seems reasonable to
analyze this factor as the first mechanism. A high level of entrepreneurship
can arguably accelerate the structural transformation of the economy when
the conditions for such change are met.25 One important mechanism is the
structural transformation of agricultural activities towards a market-oriented
sector.
In order to examine the density of agricultural activities, we first compute
the proportion of land within a 20 km buffer of the colonial settlement that
is used as cropland (i.e., territory employed for the cultivation of food) in the
year 2000. This data is based on satellite information compiled by Ramankutty
et al. (2008), available from Columbia University’s Center for International
Earth Science Information Network (CIESIN).26
Second, we also compute the proportion of land within a 20 km buffer
25
In the same spirit, Opper & Andersson (2019) finds that the regional distribution of a
measure of entrepreneurship during the Ming and Qing Dynasties explains the differential
economic growth of regions in China in the post-reform period (1992-2012).
26
Ramankutty, N., A.T. Evan, C. Monfreda, and J.A. Foley. 2010. Global Agricultural
Lands: Croplands, 2000. Palisades, NY: NASA Socioeconomic Data and Applications
Center (SEDAC). http://dx.doi.org/10.7927/H4C8276G. Ramankutty, N., A.T. Evan,
C. Monfreda, and J.A. Foley. 2008. Farming the Planet: 1. Geographic Distribution of
Global Agricultural Lands in the Year 2000. Global Biogeochemical Cycles 22 (1): GB1003.
http://dx.doi.org/10.1029/2007GB002952
40from the colonial settlement that is suitable for agriculture. We use the
index of land suitability for cultivation by Ramankutty et al. (2002), which
is based on temperature and soil conditions and distributed by the Center
for Sustainability and the Global Environment (SAGE), at the University of
Wisconsin-Madison.27
Using this information, we compute the proportion of land used as cropland
over the land that is suitable for cultivation (proportion of cropland/proportion
of land suitable for cultivation). Note that the data is only available for 118
out of 123 buffers.
The results in column 1 of Table 8 suggest a positive relationship between
the above ratio and the level of entrepreneurship of the first colonizers.
Table 8: Mechanisms - Eff. cropped land and infrastructure
Eff Cropped Land Roads Per Capita
% skilled settlers (all years) 0.125∗∗ 0.007∗∗
[0.060] [0.003]
Geographic Variables Yes Yes
Climate Variables Yes Yes
Fertile Soil Yes Yes
Distance to River Yes Yes
Distance to Lake Yes Yes
Colonization Period FE Yes Yes
Observations 118 123
R-squared 0.201 0.110
Notes - Robust standard errors in brackets.∗ Significant at 10%, ∗∗ at 5%, and ∗∗∗ at 1%. Geographic variables include: distance to coastline and ruggedness
index. Climate controls: average temperature from 1961-1980 and average precipitation from 1961-1980. The dependent variables are: cropped land over
land suitable for cultivation within a 20 km buffer from the colonial settlement; and road length (in km) per capita within a 20 km buffer from the colonial
settlement.
We assess market orientation by examining the existing infrastructures, in
27
Ramankutty, N., J.A. Foley , J. Norman, and K. McSweeney. 2002. The global
distribution of cultivable lands: current patterns and sensitivity to possible climate change.
Global Ecology and Biogeography 11 (5), 377-392. https://doi.org/10.1046/j.1466
-822x.2002.00294.x
41You can also read