Commercial Market Insights - June 2021 National Association of REALTORS Research Group - National Association of ...

Page created by Angel Sutton
 
CONTINUE READING
Commercial Market Insights - June 2021 National Association of REALTORS Research Group - National Association of ...
Commercial Market Insights
June 2021

National Association of REALTORS® Research
Group
Commercial Market Insights - June 2021 National Association of REALTORS Research Group - National Association of ...
Contents
The commercial real estate market continues to climb out      Page
from the economic fallout of the COVID-19 pandemic.           3      Economic Conditions
Commercial real estate acquisitions during January through
May 2021 rose 1% compared to one year ago as investors        5      Overview
acquired multifamily properties, hotels, and seniors
housing.                                                      7      Multifamily
However, acquisitions of office, retail brick-and-mortars,    8      Office
and even industrial properties fell below their levels one
year ago. Investors continue to shy away from office          9      Industrial
acquisitions, with about half of tech workers still working
from home and as businesses continue to assess their          10     Retail
workstyle policies. Investor interest for retail properties
remains tepid as e-commerce sales continue to make            11     Hotel
inroads into the brick-and-mortar retail sales market.

Commercial real estate prices continued to firm up on a
broad level, with prices now just 1% below year-ago levels,
after falling by as much as 10% one year ago. Cap rates
have continued to compress downwards by about a
percentage point from one year ago, with the lowest cap
rate in multifamily property acquisitions.

NAR Research anticipates that commercial transactions will
continue to improve in 2021 and even more strongly in
2022, with the population practically vaccinated by the end
of summer 2021, as more businesses increase their
operating capacity, travel resumes, more workers start
heading back to the office, and consumers spend some of
their savings on leisure and recreation and personal
services.

Enjoy reading the latest issue!

 www.nar.realtor/research-and-statistics
                                                          1
Economic Conditions
14.1 million payroll generated from May 2020-April 2021
with 8.2 million jobs to recover

The economy continues to recover and jobs are coming                           14.7 Million Payroll Jobs Created With 7.6 Million
back, although at a modest pace compared to the third                                Lost Jobs to Recover as of May 2021
quarter surge. As of May 2021, the economy has gained
14.7 million jobs, or 75% of the 22.4 million jobs lost                                155                            152.5
during March and April 2020. There are 7.6 million                                     150
nonfarm payroll jobs still to be recovered.                                            145                                                    144.3

                                                                         In millions
                                                                                       140
About 33% of the 7.6 million jobs to still recover are in                              135
                                                                                       130
leisure and hospitality, followed by the government sector                                                             130.2
                                                                                       125
(local), health care and social assistance, professional and                           120
businesses services, and manufacturing, which each have                                115
lost over 500,000 jobs. Only the finance and insurance

                                                                                               Sep/2019

                                                                                               Sep/2020
                                                                                               Nov/2019

                                                                                               Nov/2020
                                                                                                 Jul/2019

                                                                                                 Jul/2020
                                                                                                Jan/2019

                                                                                                Jan/2020

                                                                                                Jan/2021
                                                                                               May/2019

                                                                                               May/2020

                                                                                               May/2021
                                                                                               Mar/2019

                                                                                               Mar/2020

                                                                                               Mar/2021
industry had job gains.

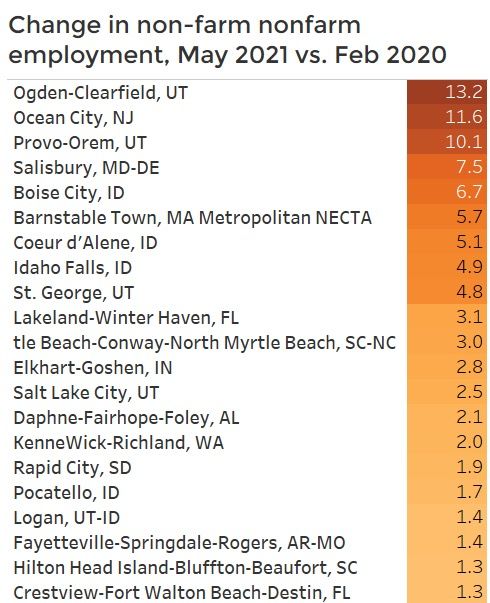
While jobs are coming back, only 10% of metro areas
have more jobs as of May 2021 compared to February
                                                                                               Source: BLS Establishment Survey
2020.

                                                                         Nonfarm Payroll Jobs Lost since February 2020 as of
                                                                                             May 2021

                                                               -2,538                                     Leisure & Hos pitality
                                                                        -1,167                            Govern ment
                                                                                 -765                     Health Care & Social Ass is tance
                                                                                  -708                    Profes sional & Business Services
                                                                                       -509               Man ufacturing
                                                                                       -411               Retail Trade
                                                                                        -353              Other Services
                                                                                        -293              Educational Services
                                                                                        -225              Con struction
                                                                                        -211              Wholesale Trade
                                                                                         -193             Information Services
                                                                                         -100             Tran sportation & W arehousing
                                                                                             -97          Real Estate, Rental & Leasing
                                                                                             -76          Min ing and Loggin g
                                                                                               -7         Utilities
                                                                                                    23   Finance and Insu rance

                                                                   Source: BLS Establishment Survey

                                                               5
Economic Conditions

r
17% of the workforce still working from home

Workers are slowly trickling back to the office. As of April,
16.6% of workers teleworked, down from a peak of 35%, but
still about thrice the 5.7% share in 2019. Among computer and
                                                                                                    Percent of Employed Who Teleworked
                                                                                                                               Workers 16 years old and over
                                                                                                                               Computer and mathematical

mathematical workers, 55% are teleworking, about five-fold
from the 12% share in 2019. The fraction is likely to continue                                                                                                                                                                                55
to decline as more people get vaccinated by the end of
summer, but it seems more likely that a fraction of workers will
work from home compared to before the pandemic with
                                                                                                                                                                                                                                              16.6
companies providing a flexible working environment as one
way to attract workers.

                                                                                                                                                                                                Feb-21
                                                                         2019
                                                                                  20-May

                                                                                                                                                            1-Nov
                                                                                                                                     1-Sep
                                                                                                                                                 1-Oct
                                                                                                                      1-Aug

                                                                                                                                                                                    Jan-21
                                                                                              20-Jun
                                                                                                          20-Jul

                                                                                                                                                                                                                                   May-21
                                                                                                                                                                        1-Dec

                                                                                                                                                                                                            Mar-21
                                                                                                                                                                                                                        Apr-21
56% of small businesses operating at higher capacity as of
June 19, 2021

As the economy continues to recover, a businesses are starting         Source: BLS COVID-19 Supplemental Survey
to operate at higher capacity. As of the week of June 19, 56%
of small businesses were operating at higher capacity                                        Percent of Small Businesses Operating at
compared to one year ago as COVID-19 cases started to                                       Higher Capacity Compared to One Year Ago
accelerate.                                                             60.0
                                                                        55.0                                                                                                                                                                        56.0
Inflation surged to 5% in May due to uptick in energy and               50.0
transportation prices                                                   45.0
                                                                        40.0                   38.9
The inflation rate (all items) surged to 5% in May 2021 due to          35.0
rising energy and transportation prices, with people starting to        30.0
                                                                                     12/Sep/2020W
                                                                                     26/Sep/2020W

                                                                                     20/Feb/2021W

                                                                                     12/Jun/2021W
                                                                                    21/Nov/2020W
                                                                                    05/Dec/2020W
                                                                                    19/Dec/2020W
                                                                                     10/Oct/2020W

                                                                                     02/Jan/2021W

                                                                                     03/Apr/2021W
                                                                                     17/Apr/2021W
                                                                                    29/May/2021W
                                                                                    06/Mar/2021W
                                                                                    20/Mar/2021W
                                                                                    15/Aug/2020W
                                                                                    29/Aug/2020W

go travel. Energy commodities (fuel) rose 54.5%, used cars and
trucks rose 29.7%, motor vehicle insurance rose 17%, and
airline fare rose 24%. Core inflation rate, which strips out
prices of food and energy, also rose to 3.8%.

The Federal Open Market Committee has maintained that the                    Source: US Census Bureau Small Business Pulse Survey
uptick in inflation is due to transitory factors, due to a
temporary surge in spending, and has kept the federal funds
                                                                                               Inflation is Rising as Spending Recovers
rate to a range of 0 to 25 basis points. It has adopted an
average inflation target of 2% so inflation can run a higher than
2% in the coming months given the low inflation rate in the                                            Headline inflation                                                                    24-month rolling
past year. Over a 2-year rolling window, the average inflation         6.0
rate (headline) averaged 1.6%.                                         5.0                                                                                                                                                                          5.0
                                                                       4.0
                                                                       3.0
                                                                       2.0
                                                                                                                                                                                                                                             1.6
                                                                       1.0
                                                                       0.0
                                                                                                                          Sep/2019

                                                                                                                                                                                             Sep/2020
                                                                                                                                      Nov/2019

                                                                                                                                                                                                        Nov/2020
                                                                                                               Jul/2019

                                                                                                                                                                                  Jul/2020
                                                                              Jan/2019

                                                                                                                                                 Jan/2020

                                                                                                                                                                                                                   Jan/2021
                                                                                                    May/2019

                                                                                                                                                                       May/2020

                                                                                                                                                                                                                                         May/2021
                                                                                         Mar/2019

                                                                                                                                                            Mar/2020

                                                                                                                                                                                                                              Mar/2021

                                                                                   US Census Bureau
                                                                   3
Commercial Market Overview
Commercial sales transactions during Jan-May 2021 rose 1%                            Commercial Acquisitions of Hotel Properties or
from year-ago level                                                                           Portfolios $2.5M or over
                                                                               $7
Commercial real estate acquisitions are continuing to recover

                                                                    Billions
                                                                               $6
even if slowly due to a weak office market and a surprising
                                                                               $5
decline in acquisitions for industrial properties. During
January—May 2021, acquisitions were up year a modest 1%                        $4
compared to year-ago levels.                                                   $3
                                                                               $2
The apartment market is emerging as this year’s strongest asset                $1                                                                                                                                                                                      $1.0
class. The dollar volume of apartment transactions from                         $-
January-May 2021 rose 24% and this accounts for the largest

                                                                                          '19Jul

                                                                                          '20Jul
                                                                                       '19Nov

                                                                                       '20Nov
                                                                                        '19Sep

                                                                                        '20Sep
                                                                                      '19Mar

                                                                                      '20Mar

                                                                                      '21Mar
                                                                                      '19May

                                                                                      '20May

                                                                                      '21May
                                                                                         '19Jan

                                                                                         '20Jan

                                                                                         '21Jan
deal volume, at $62.9 billion. Acquisitions for hotel and seniors
housing and health care also increased but the deal volumes
are small, each at below $10 billion. Investors have been                                            Full-service                                                       Limited service                                                                   All
acquiring some hotels for conversion into multifamily housing
                                                                               Source: Real Capital Analytics
as documented in NAR’s Case Studies on Repurposing Vacant
Hotels/Motels into Multifamily Housing.
                                                                                                                                                                                                   YTD '21
However, year-to-date, acquisitions of office, retail, and                                                                                                                       Vol ($b)                                  YOY                            Cap Rate
industrial properties were down from one year ago. Investors                      Office                                                                                          33.9                                    -15%                             6.5%
continue to shy away from office acquisitions as working from                                                                                                                           15.9                                   -7%                               6.5%
                                                                                  Retail
home appears to be emerging as part of the new office
workstyle. Investor interest for retail properties remains tepid                  Industrial                                                                                            35.4                              -14%                                   5.9%
as e-commerce sales continue to make inroads into the brick-                      Hotel                                                                                                     9.1                                72%                               8.5%
and-mortar retail sales market. Surprisingly, acquisitions of                                                                                                                           62.9                                   24%                               5.0%
                                                                                  Apartment
industrial properties declined, but this could be a reflection of
                                                                                  Snr Hsg & Care                                                                                            5.6                                19%                               5.5%
industrial property owners wanting to hold on to their current
portfolio rather than a lack of investor interest for acquiring                   Dev Site                                                                                                  7.0                           -20%
industrial assets.                                                                Total                                                                                             169.9                                       1%
                                                                               Real Capital Analytics
Commercial real estate prices, just down 1%% since January
2020
                                                                                     Percent Change in Commercial Property Prices
Commercial real estate prices continue to firm up. As of May                                         vs. Jan 2020
2021, the Green Street Commercial Price Index, an appraisal-             0.0%
                                                                                                                                                                                                                                                                      -0.6%
based index of high-quality properties held by REITs, is now just       -2 .0%
1% below the pre-pandemic level in January 2020. The index              -4 .0%
fell by as much as 10% year-over-year in the second quarter of          -6 .0%
2020. The Core Properties Index, comprised of multifamily,              -8 .0%
office, industrial, retail properties, is down by just 0.6% from      -1 0.0%
January 2020.                                                         -1 2.0%
                                                                                                                                                                                                       Dec/202 0
                                                                                                                        May/202 0

                                                                                                                                                                                                                                                                 May/202 1
                                                                                                 Mar/ 2020

                                                                                                                                                                                                                                          Mar/ 2021
                                                                                                                                                                                Oct/2 020

                                                                                                                                                                                                                   Jan /2021
                                                                                                                                               Jul/2020
                                                                                                                                                          Aug/2020
                                                                                                             Apr/2020

                                                                                                                                                                                                                                                      Apr/2021
                                                                                                                                                                                            Nov/2020
                                                                                      Feb/2020

                                                                                                                                                                     Sep/2020

                                                                                                                                                                                                                               Feb/2021
                                                                                                                                    Jun/2020

                                                                                                                                               GreenStreet All Property Index

                                                                                                                                               GreenStreet Core Property Index

                                                                2
Commercial Market Overview
         Cap rates continue to compress
                                                                                                                                                                                    Cap Rates Less 10-Year T-Bond Rate
         As prices continue to firm up, cap rates continue to
                                                                                                                                                        9.0%
         compress. Acquisitions for apartment properties had the
                                                                                                                                                        8.0%
         lowest risk spread (cap rate less 10-year T-note) at 3.4%                                                                                      7.0%                                                                                                                                 6.8%
         (4.6% one year ago), followed by industrial acquisitions,                                                                                      6.0%
         at 4.2% (5.4% one year ago). Hotel acquisitions had the                                                                                        5.0%                                                                                                                                 4.9%
         highest risk spread at 6.8% (8% one year ago). For office                                                                                      4.0%                                                                                                                                 4.2%
         acquisitions, the risk-adjusted cap rate was 4.9% (5.8%                                                                                        3.0%                                                                                                                                 3.4%
         one year ago). The risk-adjusted cap rates for retail                                                                                          2.0%
         properties has also declined to 4.9% (5.9% one year ago).                                                                                      1.0%
                                                                                                                                                        0.0%
         As of May, the 10-year T-bond (risk-free rate) was 1.62%.

                                                                                                                                                                        Jun-03

                                                                                                                                                                                                                                                                                    Jun-20
                                                                                                                                                                                                   Sep-07
                                                                                                                                                                                                            Feb-09
                                                                                                                                                                                                                     Jul-10
                                                                                                                                                                                 Nov-04

                                                                                                                                                                                                                                                Oct-14
                                                                                                                                                                                                                              Dec-11
                                                                                                                                                               Jan-02

                                                                                                                                                                                                                                                                           Jan-19
                                                                                                                                                                                                                                       May-13

                                                                                                                                                                                                                                                         Mar-16
                                                                                                                                                                                                                                                                  Aug-17
                                                                                                                                                                                          Apr-06
         Industrial and self-storage REITs have highest returns

         The total return on REITs invested in various types of                                                                                                     Apartment                                            Industrial                                           Retail
         assets has turned from negative in 2020 to as of May                                                                                                       Offi ce                                              Hotel
         2021, except for office REITs which continue to show a
         total return of - 7% compared to January 2020 and
         healthcare with a total return of -4.4%. The highest total                                                                                       Real Capital Analytics
         returns (price and dividend) as of May 2021 relative to
         January 2020 were in self-storage (37%), industrial (26%),
         and infrastructure (20%).
                                                                                                                                                                             Total Return (%) of Equity REITS as of May 2021
         CMBS delinquency rates continue to decline                                                                                                                                    Compared to January 2020
                                                                                                                                                          50.0%
         As the economy continues to recover, delinquency rates                                                                                           40.0%
                                                                                                                                                                                                                                                                                             36.5%
         continue to fall to 6.2% in May 2021. The highest loan                                                                                           30.0%
                                                                                                                                                                                                                                                                                             26.2%
         delinquencies are In lodging, at 14.2%, and the lowest was                                                                                       20.0%                                                                                                                              20.1%
                                                                                                                                                          10.0%
         industrial, at less than 1%.                                                                                                                                                                                                                                                        4.4%
                                                                                                                                                           0.0%
                                                                                                                                                         -10.0%                                                                                                                              -6.8%
                                                                                                                                                         -20.0%
                                                                                                                                                         -30.0%
                                                                                                                                                         -40.0%
                                                                                                                                                         -50.0%
                                                                                                                                                         -60.0%
                                                                                                                                                                                                        Jun-20
                                                                                                                                                                           Feb-20

                                                                                                                                                                                                                                                                    Feb-21
                                                                                                                                                                                                                                       Oct-20

                                                                                                                                                                                                                                                    Dec-20
                                                                                                                                                                                                                       Aug-20
                                                                                                                                                                                          Apr-20

                                                                                                                                                                                                                                                                                    Apr-21

               CMBS Marked as 30 Days + Delinquent as of
                             May 2021
                       All                                            Industrial                                          Lodgi ng                                                  office                                                       industrial
                       Mult ifamily                                   Offi ce                                             Retail                                                    retail                                                       apt
30
                                                                                                                                                                                    lodging                                                      healthcare
25
                                                                                                                                                                                    self-storage                                                 Infrastructure
20
15                                                                                                                                          14.22
10                                                                                                                                          10.66         Source: Nareit
                                                                                                                                            6.16
 5                                                                                                                                          2.12
 0                                                                                                                                           1.92
                                                                                                                                            0.79
                                         Sep-19

                                                                                               Sep-20
                                Jul-19

                                                                                      Jul-20
                                                  Nov-19

                                                                                                        Nov-20
     Jan-19

                                                           Jan-20

                                                                                                                 Jan-21
                       May-19

                                                                             May-20

                                                                                                                                   May-21
              Mar-19

                                                                    Mar-20

                                                                                                                          Mar-21

                                                                                                                                                    3
       Source: Trepp
Multifamily
Multifamily acquisitions for low-rises outpace mid/high-rises

  Acquisitions for multifamily properties of $2.5 million rose                           Apartment Sales Transactions Volume of $2.5M
  24% in the first four months of the year from one year ago.                                        or Over (in Billion $)
                                                                                                 Garden              Mid/highrise       All
  Acquisitions of garden or low-rises (less than four flours) rose
                                                                                $35
  at a stronger pace of 28% to $44 billion, while acquisitions for

                                                                     Billions
                                                                                $30
  mid-rises rose 14% to $19 billion. Garden or low-rises are
                                                                                $25
  usually in the suburbs, so this indicates a stronger demand for
                                                                                $20
  multifamily housing in the suburbs than in the central
                                                                                $15
  business districts. The share of garden or low-rises has been
                                                                                $10
  rising since 2012, to 79% of the total number of property
                                                                                 $5
  acquisitions as of May 2021.
                                                                                 $0

                                                                                          '19Jul

                                                                                          '20Jul
                                                                                       '19Nov

                                                                                       '20Nov
                                                                                        '19Sep

                                                                                        '20Sep
                                                                                      '19Mar

                                                                                      '20Mar

                                                                                      '21Mar
                                                                                      '19May

                                                                                      '20May

                                                                                      '21May
                                                                                         '19Jan

                                                                                         '20Jan

                                                                                         '21Jan
  However, mid-rises are still fetching a lower cap rate (higher
  prices) than garden/low-rises. Cap rates have fallen for both
  garden and mid/high-rises since the beginning of the year but
  were essentially unchanged in May from April.

  Los Angeles, Dallas, Phoenix, Atlanta, and Chicago were the                         Share of Garden/Low-rise Apartment Sales to
  markets with the most sales transactions year-to-date through                                  Total Apartment Sales
  May 2021.
                                                                     0.95
                                                                      0.9
                                                                     0.85
                                                                      0.8                                                                       79%
                                                                     0.75
       Most Active Multifamily Markets by Number                      0.7
         of Property Acquisitions Year-to-date
                   through May 2021
                                                                     0.65
                                                                      0.6
                                                                                  '02Oct

                                                                                  '09Oct

                                                                                  '16Oct
                                                                                  '06Apr

                                                                                  '20Apr
                                                                                   '04Jul

                                                                                   '11Jul

                                                                                   '18Jul
                                                                                   13Apr
                                                                                  '01Jan

                                                                                  '08Jan

     Los Angeles                                     219                          '15Jan
           Dallas                           141
         Phoenix                           131
          Atlanta                    102
         Chicago                73
        Houston                 70
          Denver               66
                                                                                                  Cap Rates Less 10-Year Bond
       San Diego              61                                     6.0%
  Miami/Dade Co              56                                      5.0%
          Boston            54
     Minneapol is                                                    4.0%
                            53                                                                                                                  3.5%
   NYC Boroughs             52                                       3.0%                                                                       3.1%
      Manhattan             51                                       2.0%
           No NJ           48
                                                                     1.0%
           Austi n         48
          Tampa            46                                    5   0.0%
                                                                                     '05Jul

                                                                                     '12Jul

                                                                                     '19Jul
                                                                                  '07Nov

                                                                                  '14Nov
                                                                                   '06Sep

                                                                                   '20Sep
                                                                                    13Sep
                                                                                 '03Mar

                                                                                 '10Mar

                                                                                 '17Mar
                                                                                 '04May

                                                                                 '11May

                                                                                 '18May
                                                                                    '02Jan

                                                                                    '09Jan

                                                                                    '16Jan

        Portland           45
          Seattle         42
       Charlotte          40
     San Antonio          40                                                                   Garden/Low-rise                  Mid/high-rise

                                                                            Source of data: Real Capital Analytics
Office
Investor demand remains weak with sales down in both CBD and suburban
markets
With businesses still strategizing on their work- from-home                          Office Sales Transactions of $2.5M or Over as of
policies, acquisitions of office real estate properties or                                        May 2021 (in Billion $)
portfolios of $2.5 million or over during January-May 2021
were 15% below the level one year ago.                                   20.0                              Office - CBD                                  Office - Sub                                  All
                                                                         18.0
Year-to-date, acquisitions declined in both the central business         16.0
                                                                         14.0
district areas (-18%) and in suburban areas (-15%). CBD areas
                                                                         12.0
have accounted for 13% of the number of property acquisitions            10.0
compared to about 15% prior to the pandemic.                              8.0
                                                                          6.0
Cap rates are trending downwards, even if sales remain soft,              4.0
                                                                          2.0
signifying that investors are still cherry-picking. Cap rates             0.0
averaged 4% for CBD acquisitions and 5.1% for acquisitions in

                                                                                         '19Mar

                                                                                                                                                '20Mar

                                                                                                                                                                                                        '21Mar
                                                                                                  '19May

                                                                                                                                                         '20May

                                                                                                                                                                                                                 '21May
                                                                                                           '19Ju l
                                                                                                                     '19Sep

                                                                                                                                                                  '20Ju l
                                                                                                                                                                            '20Sep
                                                                                                                              '19Nov

                                                                                                                                                                                     '20Nov
                                                                                '19Jan

                                                                                                                                       '20Jan

                                                                                                                                                                                              '21Jan
suburban markets, with rates essentially unchanged in May
from April.

Los Angeles, Dallas, Atlanta, Boston, and Seattle had the most
office property investor deals year-to-date through May 2021.
                                                                                         Share of CBD Office Property Sales to Total
The only gateway city in the top 5 is Boston where the demand
                                                                                                           Sales
for office space is being driven by life sciences companies.
                                                                          30%
                                                                          25%
                                                                          20%
                                                                          15%
                                                                                                                                                                                                                      13%
             Most Active Office Markets by Number of                      10%
            Property Acquisitions Year-to-date through                      5%
                            May 2021
                                                                            0%

                                                                                   '15Mar
                                                                                     '02Jun

                                                                                     '19Jun
                                                                                  '12May
                                                                                      '09Jul
                                                                                    '06Sep
                                                                                    '08Feb

                                                                                      13Oct
                                                                                   '03Nov

                                                                                   '20Nov
                                                                                     '01Jan

                                                                                     '18Jan
                                                                                    '10Dec

                                                                                   '16Aug
                                                                                    '05Apr

        Los Angeles                                             81
                Dallas                                     61
               Atlanta                                    58
               Boston                                    56
               Seattle                                  54
              Phoenix                                  51
             San Jose
                                                                                         Cap Rates Less 10-Year Bond Rate
                                                  41
           San Diego                           35
                No NJ                          34                                                                              CBD                          Suburban
               Denver                         32                         7.0%
             Houston                         30                          6.0%
       Sal t Lake City                       30
             Broward                                                     5.0%                                                                                                                                       5.1%
                                            28
     Miami/Dade Co                          27                           4.0%                                                                                                                                       4.0%
         Manhattan                         26                            3.0%
               Tampa                       25
                                                                         2.0%
                Austi n                   24
          Orange Co                       24                             1.0%
        Phil adelphia                     23                             0.0%
              East Bay                    23
                                                                                  '06Sep

                                                                                  '20Sep
                                                                                    '05Jul

                                                                                    '12Jul
                                                                                   13Sep

                                                                                    '19Jul
                                                                                 '07Nov

                                                                                 '14Nov
                                                                                '03Mar

                                                                                '10Mar

                                                                                '17Mar
                                                                                '04May

                                                                                '11May

                                                                                '18May
                                                                                   '02Jan

                                                                                   '09Jan

                                                                                   '16Jan

 Source of data: Real Capital Analytics
                                                                     7
Industrial
Exceeding pre-pandemic activity

Acquisitions of industrial properties of $2.5 million or over rose                Industrial Sales Transactions of $2.5M or Over
70% in May 2021 and totaled $5.3 billion, as acquisitions                                  as of May 2021 (in Billions $)
increased for both flex (55%) and warehouse (76%).                     $30
                                                                       $25
The industrial sector is operating above pre-pandemic levels           $20
and remains in high demand amongst investors as warehouses             $15
continue to be the focal point of deal activity capturing 77% of
                                                                       $10
all industrial deal volume in May.
                                                                        $5
The average cap rate among industrial acquisitions remains              $-

                                                                                               Sep-03

                                                                                                                          Sep-07

                                                                                                                                                     Sep-11

                                                                                                                                                                                   Sep-15

                                                                                                                                                                                                                 Sep-19
essentially unchanged year-to-date at 5.9% as warehouse cap

                                                                             Jan-01

                                                                                                        Jan-05

                                                                                                                                   Jan-09

                                                                                                                                                                Jan-13

                                                                                                                                                                                             Jan-17

                                                                                                                                                                                                                           Jan-21
                                                                                      May-02

                                                                                                                 May-06

                                                                                                                                            May-10

                                                                                                                                                                         May-14

                                                                                                                                                                                                       May-18
rates remain unmoved at 5.8%. Conversely, flex space cap
rates marginally decreased to 6.0% which means flex prices are
tightening up.                                                                                  Flex Vol ume                                                     Warehouse Volume
                                                                       Source: NAR analysis of RCA data
Industrial average price per square foot increased in May
across industrial property transactions with the warehouse
avg. psf increasing $8 from the prior month towards $108 in                                              Industrial Property Cap Rates
May and flex space increasing from $148 to $162.
                                                                        0.15
YTD through May 2021, the most active markets with respect
to industrial property acquisitions were Los Angeles (34),               0.1
Atlanta (33), Boston (29), Chicago (23) and Orange Co. (22).

                                                                        0.05

                                                                             0
                                                                                                                     Sep-06
                                                                                                                               Feb-08
                                                                                          Jun-02

                                                                                                                                                                                                                Jun-19
                                                                                                                                        Jul-09
                                                                                                   Nov-03

                                                                                                                                                                                                                          Nov-20
                                                                                                                                                 Dec-10

                                                                                                                                                                        Oct-13
                                                                                 Jan-01

                                                                                                                                                                                                      Jan-18
                                                                                                            Apr-05

                                                                                                                                                              May-12

                                                                                                                                                                                  Mar-15
                                                                                                                                                                                            Aug-16
     Most Active Industrial Markets by Number of Property
                                                                                               Flex Avg. Cap Rate                                                           Warehouse Avg
              Acquisitions YTD through May 2021
                                                                                                                                                                            Cap Rate
          East Bay            8
      Indianapolis            8
            Denver             9
            Detroit            9
                                                                                  Share of Industrial Warehouse Acquisitions to
      Minneapol is              10                                                              Total Acquisitions
         Las Vegas                12                                   100.0%
         Charlotte                 13
             No NJ                  14                                  80.0%
    Inland Empire                    15
           Phoenix                    16                                60.0%
          Houston                       18
         San Diego                       19                             40.0%
            Seattle                       20
          San Jose                                                      20.0%
                                          20
             Dallas                       20
                                                                         0.0%
        Orange Co                           22
                                                                                               Jun-02

                                                                                                                                                                                                                Jun-19
                                                                                                                          Sep-06
                                                                                                                                   Feb-08
                                                                                                                                            Jul-09
                                                                                                        Nov-03

                                                                                                                                                                                                                          Nov-20
                                                                                                                                                     Dec-10

                                                                                                                                                                         Oct-13
                                                                                                                 Apr-05
                                                                                      Jan-01

                                                                                                                                                                                                      Jan-18
                                                                                                                                                               May-12

                                                                                                                                                                                  Mar-15
                                                                                                                                                                                            Aug-16

           Chicago                           23
            Boston                                     29
            Atlanta                                         33
       Los Angeles                                           34
                                                                   9
Retail
YOY deal volume positive for 3rd consecutive month in May at 76%

Acquisitions of industrial properties of $2.5 million or over rose              Retail Sales Transactions of $2.5M or Over as of
76% in May 2021, as acquisitions for centers increased                                       May 2021 (in Billions $)
significantly (180%) and decreased for shops (-4%).                   $25
                                                                      $20
The majority of retail acquisitions—69% — was for center
                                                                      $15
space. While May’s share marks the 5th month of centers
having the majority of sales over the past 1 ½ years, investors       $10
preference has not shift back to pre-pandemic trends quite             $5
yet. Although transactions for this retail subtype rose 180%           $-
year-over-year in May and had $2 billion in deal activity, a

                                                                                                                   Sep-06
                                                                                                                             Feb-08
                                                                                     Jun-02

                                                                                                                                                                                                          Jun-19
                                                                                               Nov-03

                                                                                                                                                                                                                   Nov-20
                                                                                                                                      Jul-09
                                                                                                                                                 Dec-10

                                                                                                                                                                     Oct-13
                                                                            Jan-01

                                                                                                                                                                                                 Jan-18
                                                                                                                                                           May-12
                                                                                                         Apr-05

                                                                                                                                                                              Mar-15
                                                                                                                                                                                       Aug-16
large portion of the obstacle for transaction activity originates
from the sale of shopping centers as May deal volume is still
below pre-pandemic levels.                                                                      Shops Volume                                                              Centers Volume
                                                                      Source: NAR analysis of RCA data
The dramatic figures for not only centers but for retail in
general are not what they appear to be as they continue to
illustrate the difficult conditions of the past year.                                                        Retail Property Cap Rates

The average cap rate among shop and center acquisitions                 0.1
remain essentially unchanged at 6.1% and 7.3% respectively             0.08
with all retail average cap rates holding steady at 6.5%.
                                                                       0.06
YTD through May 2021, the most active markets with respect             0.04
to retail property acquisitions were Dallas (42), Atlanta (32),
                                                                       0.02
Phoenix (32), Los Angeles (25) and Houston (23).
                                                                            0
                                                                                                                       Sep-06
                                                                                                                                Feb-08
                                                                                         Jun-02

                                                                                                                                                                                                              Jun-19
                                                                                                  Nov-03

                                                                                                                                                                                                                       Nov-20
                                                                                                                                             Jul-09
                                                                                                                                                       Dec-10

                                                                                                                                                                          Oct-13
                                                                                Jan-01

                                                                                                                                                                                                     Jan-18
                                                                                                             Apr-05

                                                                                                                                                                 May-12

                                                                                                                                                                                   Mar-15
                                                                                                                                                                                            Aug-16
                                                                                               Shops Avg. Cap Rate                                                                     Centers Avg
                                                                                                                                                                                       Cap Rate

           Most Active Retail Markets by Number of Property                           Share of Retail Center Acquisitions to Total
                 Acquisitions YTD through May 2021                                                    Acquisitions
       Broward            8
      San Diego            9                                          120.0%
          Austi n          9
 Inland Empire                                                        100.0%
                            10
         Denver             10                                         80.0%
   Minneapol is             10
         Seattle             11                                        60.0%
         Tampa               11
Miami/Dade Co                11                                        40.0%
         Boston              11                                        20.0%
      Las Vegas               12
      Charlotte               12                                        0.0%
Palm Beach Co                  13
                                                                                                                           Sep-06
                                                                                                                                    Feb-08
                                                                                              Jun-02

                                                                                                                                                                                                              Jun-19
                                                                                                                                              Jul-09
                                                                                                        Nov-03

                                                                                                                                                                                                                       Nov-20
                                                                                                                                                                          Oct-13
                                                                                                                                                        Dec-10
                                                                                     Jan-01

                                                                                                                                                                                                     Jan-18
                                                                                                                                                                 May-12

                                                                                                                                                                                   Mar-15
                                                                                                                                                                                            Aug-16
                                                                                                                  Apr-05

     Orange Co                      17
        Chicago                          21
       Houston                             23
    Los Angeles                              25
        Phoenix                                     32
         Atlanta                                    32
          Dallas                                              42 10
Hotel
Strong investor demand for hotels, especially full-service hotels

 Acquisitions of hotel properties of $2.5 million or over rose                            Commercial Acquisitions of Hotel Properties or
 72% in the first five months of 2021, as acquisitions                                             Portfolios $2.5M or over
 increased for both full-service (113%) and limited-service
                                                                                     $8
 hotels (40%).

                                                                          Billions
                                                                                     $6
 Full-service hotels may be more attractive to investors
 because they offer more revenue segments (convention                                $4
 facilities, spas, restaurants/bars) and are likely to do well
 once personal and business travel picks up. On the other                            $2
                                                                                                                                                 $1.5
 hand, limited service hotels are attractive for investors                                                                                       $0.6
                                                                                     $-
 seeking to convert these hotels for multifamily housing as

                                                                                              '19Jul

                                                                                              '20Jul
                                                                                           '19Nov

                                                                                           '20Nov
                                                                                            '19Sep

                                                                                            '20Sep
                                                                                          '19Mar

                                                                                          '20Mar

                                                                                          '21Mar
                                                                                          '19May

                                                                                          '20May

                                                                                          '21May
                                                                                             '19Jan

                                                                                             '20Jan

                                                                                             '21Jan
 documented in NAR’s Case Studies on Repurposing Vacant
 Hotels/Motels into Multifamily Housing.
                                                                                                 Full-service           Limited service        All
  The share of full-service hotels to total
 Cap rates spiked up during the height of the pandemic but
 are falling again, especially for full-service hotels. The
 average cap rate among full-service hotel has fallen to 5.3%
                                                                                           Share of acquisitions of full-service hotels to
 as of May 2021, while the average cap rate among limited-
                                                                                                 total hotel property acquisitions
 service acquisitions was 7.1%
                                                                              100%
 Dallas, Houston, Los Angeles, Phoenix and Orange County                       90%
 had the most hotel acquisition deals year-to-date through                     80%
                                                                               70%
 May 2021.
                                                                               60%
                                                                               50%
                                                                               40%
                                                                               30%
                                                                                                                                                     21%
                                                                               20%
                                                                               10%
      Most Active Hotel Markets by Number of Property                           0%
        Acquisitions Year-to-date through May 2021
                                                                                          '07Nov

                                                                                          '18Nov
                                                                                           '05Feb

                                                                                           '09Sep

                                                                                           '16Feb

                                                                                           '20Sep
                                                                                            '12Jun
                                                                                             '11Jul
                                                                                          '10Aug
                                                                                           '08Oct

                                                                                           '19Oct
                                                                                          '15Mar
                                                                                           '14Apr
                                                                                          13May
                                                                                           '06Dec

                                                                                           '17Dec
                                                                                            '06Jan

                                                                                            '17Jan
             Dallas                                                  26
          Houston                                               23
       Los Angeles                                         18
                                                                                                   Cap Rate Less 10-Year Bond Rate
           Phoenix                                    16
        Orange Co                                14                           10.0%
   Miami/Dade Co                            11
           Orlando                                                               8.0%
                                            11                                                                                                  7.1%
      San Antonio                           11                                   6.0%
      Sacramento                            11                                                                                                  5.3%
           Chicago                         10                                    4.0%
            Tampa                          10                                    2.0%
    Inland Empire                          10
            Seattle                        10                                    0.0%
             Austin
                                                                                           '16Nov
                                                                                            '07Feb

                                                                                            '14Sep

                                                                                            '20Feb
                                                                                            '11Jun
                                                                                              '12Jul

                                                                                            '15Oct
                                                                                          '10May

                                                                                             13Aug

                                       9
                                                                                            '09Apr

                                                                                           '17Dec
                                                                                          '08Mar

                                                                                          '21Mar
                                                                                             '06Jan

                                                                                             '19Jan

          Portland                     9
          San Jose                     9
      DC VA burbs                  8                                                                     Full-service        Limited service
            Boston                 8
            Atlanta                8
            Denver                 8                                          Source of data: Real Capital Analytics
COMMERCIAL MONTHLY INSIGHTS REPORT
June 2021

LAWRENCE YUN, PhD
Chief Economist & Senior Vice President for Research

GAY CORORATON
Senior Economist & Director of Housing and Commercial Research

BRANDON HARDIN
Research Economist

MEREDITH DUNN
Research Manager

Download report at https://www.nar.realtor/commercial-market-insights

Download other NAR Commercial reports at Commercial Research

©2021 National Association of REALTORS®
All Rights Reserved. May not be reprinted in whole or in part without permission of the National Association of REALTORS®.

For question about this report or reprint information, contact data@realtors.org.
The National Association of REALTORS® is America’s largest trade association, representing more than
1.4 million members, including NAR’s institutes, societies and councils, involved in all aspects of the
real estate industry. NAR membership includes brokers, salespeople, property managers, appraisers,
counselors and others engaged in both residential and commercial real estate. The term REALTOR® is a
registered collective membership mark that identifies a real estate professional who is a member of
the National Association of REALTORS® and subscribes to its strict Code of Ethics. Working for
America's property owners, the National Association provides a facility for professional development,
research and exchange of information among its members and to the public and government for the
purpose of preserving the free enterprise system and the right to own real property.

NATIONAL ASSOCIATION OF REALTORS®
RESEARCH GROUP

The Mission of the NATIONAL ASSOCIATION OF REALTORS® Research Group is to produce timely, data-
driven market analysis and authoritative business intelligence to serve members, and inform
consumers, policymakers and the media in a professional and accessible manner.

To find out about other products from NAR’s Research Group, visit
www.nar.realtor/research-and-statistics

500 New Jersey Avenue, NW
Washington, DC 20001
202.383.1000
You can also read