COMMERCIAL REAL ESTATE REPORT - ISSUE #026 2021 - Lehigh Valley ...

Page created by Ellen Hogan
 
CONTINUE READING
COMMERCIAL REAL ESTATE REPORT - ISSUE #026 2021 - Lehigh Valley ...
COMMERCIAL
REAL ESTATE REPORT
ISSUE #026

             Q22021
COMMERCIAL REAL ESTATE REPORT - ISSUE #026 2021 - Lehigh Valley ...
One of the core principles of the Lehigh Valley Economic Development Corporation (LVEDC)
    is to serve as the leading source of economic data and market intelligence on Lehigh Valley’s
    economic assets and resources to serve our economic strategies, marketing efforts, and the
    needs of our stakeholders. To that end, LVEDC prepares a series of quarterly reports about the
    real estate climate in Lehigh Valley. This report focuses on the region’s office, industrial, and flex
    markets.

     CURRENT CONDITIONS

    The Lehigh Valley is the fastest-growing region in Pennsylvania for the population between
    ages 18 and 34. Lehigh County ranked No. 1 of all the state’s 67 counties in population
    growth among that demographic, and Northampton County ranked No. 4.

    Industrial and economic growth remains strong                         As vaccination rates increase, Lehigh Valley
    in the region. The Lehigh Valley Economic                             employers have begun releasing guidance
    Development Corporation (LVEDC) is tracking                           and policies to employees about the return to
    an active pipeline of 32 companies considering                        the office. Reopening plans have varied across
    a move to or expansion in the region as of the                        the region, with some offices planning full or
    end of Q2 2021, 21 of which are manufacturing                         phased reopenings, and others approving
    companies.                                                            hybrid schedules. LVEDC surveyed regional
                                                                          companies in July about their plans to return to
    Demand for smaller-footprint industrial space                         their offices. This report details the information
    remains high. Industrial buildings in the range                       that companies like Olympus, B. Braun, ADP,
    of 20,000 SF to 80,000 SF have the lowest                             and others shared with us.
    vacancy rate in the Lehigh Valley, but the
    least amount of inventory under construction.                         The Lehigh Valley office market currently
    Regional vacancy rates for that size range                            comprises 27.7 million square feet of inventory;
    are 2.5%, compared to 7.9% for 80,000 SF                              excluding medical or owner-occupied space,
    to 300,000 SF, and 5.2% for 300,000 SF to                             the total rentable office space is 16.9 million
    500,000 SF.                                                           square feet.

    The Lehigh Valley has a total of 135 million                          This report also includes notable commercial
    square feet of industrial inventory as of Q2                          real estate sales and leases from the second
    2021, with an overall vacancy rate of 4.8%.                           quarter of 2021. This includes the Rockefeller
                                                                          Group’s sale of 951 Willowbrook Road in Allen
    In terms of office space, the Lehigh Valley                           Township for $201.5 million, the largest sale
    is still the most affordable option for Class A                       price for a single industrial building over the
    space among nearby regions in Pennsylvania                            last five years in the Lehigh Valley.
    and New Jersey. The Lehigh Valley’s direct
    asking rent for Class A is $23.68 per square
    foot, compared to $32.94 in Plymouth Meeting/
    Blue Bell, and $49.13 in University City in
    Philadelphia.

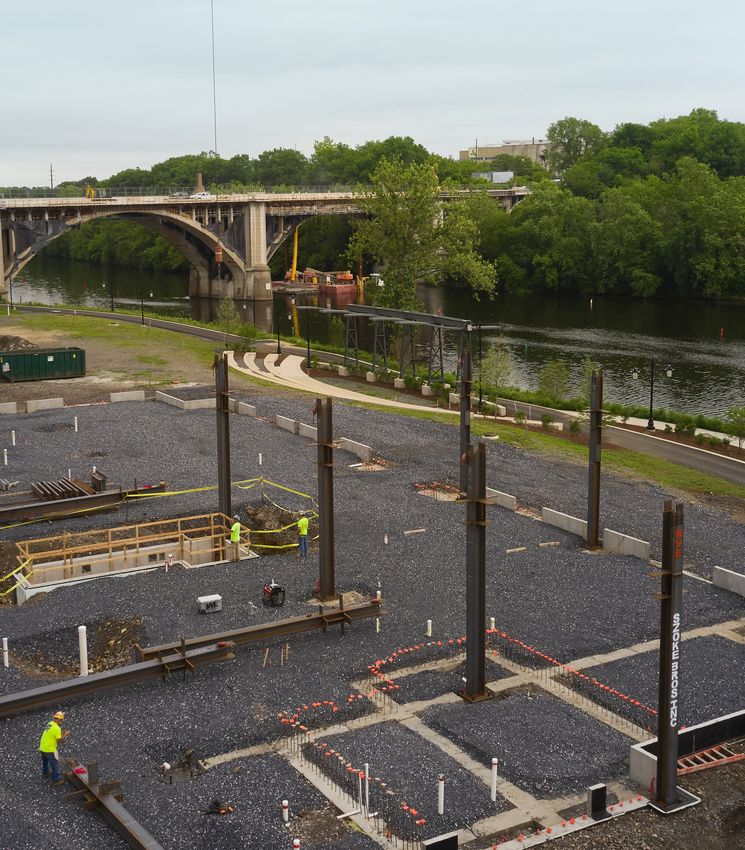
    Cover photograph courtesy of Jaindl Enterprises.Jaindl Enterprises in the second quarter began raising steel for its six-story office
    building, the first project in the larger Waterfront development along Allentown’s stretch of the Lehigh River.

2    COMMERCIAL REAL ESTATE REPORT • Q2 2021
Lehigh Valley
SNAPSHOT: INDUSTRIAL SPACE

MARKET SUMMARY
There is nearly 7 million square feet of
industrial space under construction.

                         135M                                        4M                            $6.97                                7M
                   Total Space (SF)              Q2 Net Absorption (SF)            Average Asking Rent (NNN)     Total Under Construction (SF)

                          4.8%                                   5.3M                             15.2%                            5.08M
                     Total Vacancy              2021 Net Absorption (SF)           Rent Change Since Q2 2020              2021 Deliveries (SF)

  SUPPLY & DEMAND (SF)                                                                            INDUSTRIAL FOOTPRINTS

                                                                               4M
                                                                                                               Total Inventory
                                                                      2.7M                               135 Million SF
                                                       2.4M

                                             1.5M                                                                        Space Under
                                                              1.3M                                 Size of
    913K              932K   1M                                                                                        Construction as
                                      811K                                                         Building
                                                                                                                        % of Inventory

                                                                                                   20K-80K                             2%

           -1.2M                                                                                   80K-300K                          2.5%
     Q2 2020           Q3 2020         Q4 2020          Q1 2021        Q2 2021
                                                                                                   300K-500K                       13.8%
   SQUARE FEET           Deliveries   Absorption

                                                                                                   Over 500K                         6.6%

                                                                                                    Smaller footprint buildings have
  ASKING RATE (PER SF)                                                                              the lowest vacancy rate but the
                                                                                                    least amount of inventory under
                                                                           $7.63                    construction.

                                        $7.22            $7.19
                        $7.07
                                        $6.60            $6.61         $6.97
      $6.48             $6.51
                                                                                                   Industrial space
      $6.40             $6.40           $6.40            $6.40                                     under construction
                                                                       $6.25
                                                                                                   in the Lehigh Valley
      $6.05
     Q2 2020           Q3 2020         Q4 2020          Q1 2021        Q2 2021
                                                                                                   at the end of Q2
                                                                                                   was equal to
     Combined           20K to 80K      >300,000 SF
                                                                                                   5.2% of
                                                                                                   existing
    Asking rates for buildings between 20,000 and 80,000
    square feet has risen faster in the last 12 months than the
                                                                                                   industrial
    overall rates per square foot for industrial buildings.                                        space.

Sources: CoStar, LVEDC Research

                                                                                    COMMERCIAL REAL ESTATE REPORT • Q2 2021                      3
Lehigh Valley
    SNAPSHOT: OFFICE SPACE

    MARKET SUMMARY
    The market summary includes total office space.

                             27.7M                                 -23.2K                    $16.31                             794.4K
                       Total Space (SF)              Q2 Net Absorption (SF)   Average Asking Rent (NNN)      Total Under Construction (SF)

                               9.4%                              -206.8K                        0.8%                                    0
                           Total Vacancy           2021 Net Absorption (SF)   Rent Change Since Q2 2020               YTD Deliveries (SF)

                         Rentable Office Space                                                16.9M                             $16.66
                         Excluding Owner-Occupied and Medical                            Total Space (SF)      Average Asking Rent (NNN)

                                                                 10.7%
      VACANCY RATE (PER SF)                                                   UNDER CONSTRUCTION (SF)

       13.0%                                                                                   Owner Occupied           Rentable
                                                    12.1%          12.0%
       12.0%                                                                   Q2 2020             736,984                  0
                                        10.8%
       11.0%                10.4%
               9.90%                                                           Q3 2020             632,884                  0
       10.0%                                         9.30%         9.40%
                                           8.60%                               Q4 2020             632,884                  0
        9.0%
                            8.20%
        8.0% 7.60%                                                             Q1 2021             794,432              161,548
        7.0%
                                                                               Q2 2021             794,432              161,548
           Q2 2020         Q3 2020     Q4 2020      Q1 2021      Q2 2021

          Total Office      Office w/o Medical, Owner-Occupied
                                                                                Office construction is driven by the owner-
                                                                                occupied Air Products new campus in Upper
        Vacancy rates for office space have                                     Macungie Township and a rentable office
        increased since the spring of 2020 as
                                                                                building in the Waterfront project in Allentown.
        more office workers shifted to remote work.

      CLASS A OFFICE SPACE                                                     The Return to the Office:
                                                                               A key indicator for the Lehigh Valley office market
       Location                                       Price Per SF
                                                                               will be the return of remote workers to offices. LVEDC
       Lehigh Valley                                      $23.68               spoke with several office-based companies in July
       Central Bucks County                               $26.16               about plans to return to the office. Companies are
       King of Prussia                                    $28.12               monitoring CDC and state guidance, and their plans
                                                                               are subject to change. Of the companies we spoke
       Route 78 (NJ)                                      $30.52
                                                                               with, ADP began a phased return to the office in
       Plymouth Meeting / Blue Bell                       $32.94               June, IotaComm returned with a hybrid model in
       Radnor with Hudson Waterfront (NJ)                 $45.48               July, Netizen continues a hybrid model for office and
       University City in Philadelphia                    $49.13               remote work, and B Braun and Olympus are planning
                                                                               returns with a hybrid model in September. LVEDC
        Lehigh Valley has the lowest asking rent for                           will continue to monitor and analyze trends and
        Class A office space among nearby regions,                             space requirements for office-based Lehigh Valley
        according to a recent JLL report.                                      companies.

    Sources: CoStar, LVEDC Research

4      COMMERCIAL REAL ESTATE REPORT • Q2 2021
BROKER PERSPECTIVE
                                              “The Lehigh Valley has continued to
                                              outpace the majority of the nation in
                                              industrial absorption. The expansion of
                                              the industrial market has been energized
                                              by the Lehigh Valley’s location, excellent
                                              labor and overall quality of life. We
                                              see these trends continuing for the
                                              foreseeable future.”

                                              William Wolf
                                              Executive Vice President
                                              CBRE Advisory & Transaction Services

PROSPECT PIPELINE

                                                                                               Of the 32 industrial prospects, 27
             The Lehigh                                                                    indicated how much space they needed:
          Valley Economic
            Development                                                                    Total Square Footage
          Corporation had                                                                                                  3,400,305
                                                                                           Requested
         an active pipeline
          of 32 companies                                                                  Average Square Footage
                                               11                     21                   Requested
                                                                                                                            125,937
        considering a move
         to or expansion in                                                                Median Square Footage
       Lehigh Valley as of the                                                                                               75,000
                                                                                           Requested
          end of Q2 2021.
                                                                                           Number of Prospects
                                                                                                                                  2
        *Of the 11 non-manufacturing                                                       Requesting 500,000+ SF
             prospects, nine were          Number of Manufacturing Prospects
                 distribution.             Number of Non-Manufacturing Prospects*          Number of Prospects
                                                                                                                                 25
                                                                                           Requesting 200,000 SF or less

 Source: LVEDC Research. *Not all prospects identify a square footage requirement.

                                                                                     COMMERCIAL REAL ESTATE REPORT • Q2 2021           5
BROKER PERSPECTIVE
    “Office leasing and office sales activity in the Lehigh Valley remains sluggish. On a positive note, larger employers
    such as Olympus, B. Braun and ADP are returning to the office, many of them offering hybrid work schedules for
    their employees. Next up for completion of office environments is the new Air Products Corporate Headquarters
    in Upper Macungie and the construction of the first office building on the Waterfront in the City of Allentown.”

    Cindy McDonnell Feinberg, CCIM, Feinberg Real Estate Advisors, LLC

      Q2 2021 COMMERCIAL REAL ESTATE TRANSACTIONS

        NOTABLE SALES
                                                                                                 SALE
         PROPERTY                 BUYER                     SELLER                               PRICE           MUNICIPALITY             CLASS
         951 Willowbrook         Centerpoint
                                                            Rockefeller Group                $201,500,000         Allen Township          Industrial
         Road                    Willowbrook LLC
                                 Lineage PA Re 2            Orefield Cold Storage Dist
         3824 Route 309                                                                       $33,750,000         North Whitehall         Industrial
                                 LLC                        Cent Inc
         2645 Mitchell           Lineage PA Re 2
                                                            Ocsii Inc                         $23,750,000             Allentown           Industrial
         Avenue                  LLC
         6355 Farm Bureau        Riverbend Allentown                                                              Upper Macungie
                                                            Jamble Enterprises                $11,700,000                                 Industrial
         Road                    Properties I LLC                                                                    Township
         2601 Baglyos                                                                                                Bethlehem
                                 Hamco Realty LLC           J2 Properties LLC                  $5,200,000                                 Industrial
         Circle                                                                                                      Township
         601 E. Highland         Schaedler Yesco
                                                            Joseph A. Zipley                   $2,125,000             Allentown           Industrial
         Street                  Distribution Inc
                                                            Francesca Associates
         850 13th Avenue         850 13 LLC                                                    $1,750,000            Bethlehem            Industrial
                                                            LLC
         4937 Hanoverville                                                                                           Bethlehem
                                 LVTC LI Owner LLC          Joseph M. Pokojni Jr.              $1,725,558                                 Industrial
         Road                                                                                                        Township

        NOTABLE LEASES
                                                       LANDLORD
         PROPERTY                       SF           REPRESENTATIVE                      TENANT                MUNICIPALITY               CLASS
                                                    Lee & Associates of
         7378 Airport Rd             450,000                                        Smart Warehouse          East Allen Township          Industrial
                                                  Eastern Pennsylvania LLC
         Feather Way                 294,240                  CBRE                                                 Bethlehem              Industrial
         8615 Congdon Hill                                                          Sun Opta Grains &          Lower Macungie
                                     271,374                  CBRE                                                                        Industrial
         Drive                                                                           Foods                    Township
         9747 Commerce                              Lee & Associates of                                           Weisenberg
                                     211,134                                                                                              Industrial
         Circle                                   Eastern Pennsylvania LLC                                         Township
         2325 Newlin Mills                          Lee & Associates of
                                     163,338                                                                   Palmer Township            Industrial
         Road                                     Eastern Pennsylvania LLC
         600 Brighton Street         160,000                  CBRE                    Yellow Supply               Fountain Hill           Industrial

         2685 Opus Way               139,000                   JLL                                           Bethlehem Township           Industrial
                                                                                                                South Whitehall
         1436 Eck Road               125,000              Gelcor Realty                                                                   Industrial
                                                                                                                  Township

    Sources: Lehigh and Northampton County Real Estate Tax Records, LVEDC Research, CoStar
    *CoStar, a leading source of real estate news, reported that investors spent more than $500 billion in seven markets around Philadelphia,
    and Lehigh Valley accounted for a third of those transactions.

6              COMMERCIAL REAL ESTATE REPORT • Q2 2021
“President Joe Biden recently kicked off his Made in America program with a visit to the Mack Trucks assembly
plant in Lower Macungie Township. It was very appropriate that he chose the Lehigh Valley to highlight this
important initiative. Not only does the region have a long and rich history of manufacturing, but it also remains
the cornerstone of our economy. Manufacturing is in the region’s DNA with about 700 manufacturers and 33,000
workers making everything from guitars to medical devices to Mack Trucks. The Lehigh Valley proves every day
that America still makes things.”
Don Cunningham
President & CEO, Lehigh Valley Economic Development Corporation (LVEDC)

  LEHIGH VALLEY DEMOGRAPHICS

                                               687,508
       LEHIGH VALLEY
       POPULATION
                                                                            Two of only 23 Pennsylvania counties that
                                                                            have increased in population since 2010.                   6.2%
          POPULATION CHANGE (2010-2020)
          Lehigh County*

                                  2020         374,557                                                DOMESTIC             INTERNATIONAL
                 7.2%             2010         349,508
                                                                   BIRTHS
                                                                  41,993
                                                                                      DEATHS
                                                                                   33,966
                                                                                                      MIGRATION
                                                                                                          -5,516
                                                                                                                               MIGRATION
                                                                                                                                   18,420
          Northampton County

                                  2020         312,951
                 5.1%
                                                                                                      DOMESTIC             INTERNATIONAL
                                                                   BIRTHS             DEATHS          MIGRATION                MIGRATION
                                  2010         297,704            28,541           29,789                  3,389                     6,058

          POPULATION AGES 18-34                                        RELOCATIONS (% CHANGE 2019-2020)
                                                                        MOVES WITHIN                      PHILADELPHIA
                                  2020         149,069                                           -8%                                    -2%
               10.7%
                                                                        THE LV                            METRO REGION

                                  2010         134,616                  NEW YORK
                                                                                               13.7%
                                                                                                          EAST STROUDSBURG
                                                                                                                                       0.2%
                                                                        METRO REGION                      METRO REGION

*Lehigh County ranks in the top 1% of all U.S. counties for migration from international locations, according to SelectUSA, a program of the
U.S. Department of Commerce. Sources: 2020 U.S. Census, U.S. Census Bureau Population Estimates Program and CBRE Research.

                                                                      TRACKING LEHIGH VALLEY’S RECOVERY
     The Lehigh Valley’s growing population
     is attractive to companies looking to                                                                          June 2021        June 2020
     re-shore operations or shorten supply
                                                                          Unemployment Rate                            6.7%            14.3%
     chains in an affordable location in the
     heart of the Northeast market.                                       Employment                                  361,000         334,100
                                                                             Manufacturing                            39,200           37,400
                                                                             Logistics                                34,000           31,300
                                                                             Retail                                   37,700           35,600
                                                                             Professional/Business Services           46,500           45,700
                                                                             Health Care/Social Assistance            63,500           61,200
                                                                             Leisure/Hospitality                      35,000           22,400

Sources: Pennsylvania Department of Labor and Industry, U.S. Bureau of Labor Statistics.
Employment figures are for the Metropolitan Statistical Area, which includes the Lehigh Valley plus Carbon and Warren counties.

                                                                                      COMMERCIAL REAL ESTATE REPORT • Q2 2021                    7
LVEDC Commercial Real Estate Report designed by Michelle Chrin.
                                                                                              ©2021 Lehigh Valley Economic Development Corporation. All Rights Reserved. 08.2021
Our Mission
The mission of Lehigh Valley Economic
Development Corporation is to market the
economic assets of the Lehigh Valley and to
create partnerships to lead the recruitment,
growth, and retention of employers.

Our Vision
Our vision is of a diverse Lehigh Valley
economy that provides economic growth
and opportunity for people of all skills and
education and strengthens all our cities,
boroughs, and townships.

Our Priorities
• Market the economic assets of
  the Lehigh Valley
• Recruit companies in targeted
  economic sectors
• Support the growth and retention
  of new and existing employers
• Promote and coordinate a skilled
  and prepared workforce
• Provide intelligence and data
  on the Lehigh Valley economy
• Expand public and private LVEDC
  investment and build partnerships
  for economic growth

                                               2158 Avenue C, Suite 200 Bethlehem, PA 18017
                                                 Phone: 610-266-6775 • Fax: 610-266-7623
                                                                      www.lehighvalley.org
Lehigh Valley
Come here. Start here. Grow here.
You can also read