Community Characteristics Analysis of Eukaryotic Microplankton via ITS Gene Metabarcoding Based on Environmental DNA in Lower Reaches of Qiantang ...
←
→
Page content transcription
If your browser does not render page correctly, please read the page content below
Open Journal of Animal Sciences, 2021, 11, 105-124
                                                                                             https://www.scirp.org/journal/ojas
                                                                                                        ISSN Online: 2161-7627
                                                                                                          ISSN Print: 2161-7597

Community Characteristics Analysis of
Eukaryotic Microplankton via ITS Gene
Metabarcoding Based on Environmental
DNA in Lower Reaches of Qiantang
River, China

Aiju Zhang1, Jun Wang1, Yabin Hao1, Shanshi Xiao1, Wei Luo1, Ganxiang Wang2, Zhiming Zhou1
1
 Agriculture Ministry Key Laboratory of Healthy Freshwater Aquaculture, Key Laboratory of Freshwater Aquaculture Genetic and
Breeding of Zhejiang Province, Zhejiang Research Center of East China Sea Fishery Research Institute, Zhejiang Institute of
Freshwater Fisheries, Huzhou, China
2
 Pinghu Fisheries Technology Promotion Center, Pinghu, China

How to cite this paper: Zhang, A.J., Wang,    Abstract
J., Hao, Y.B., Xiao, S.S., Luo, W., Wang,
G.X. and Zhou, Z.M. (2021) Community          Eukaryotic microplankton plays an important role in water biotic community
Characteristics Analysis of Eukaryotic        and in maintaining the stability of water ecosystems. Environmental DNA
Microplankton via ITS Gene Metabarcod-        metabarcoding provides the opportunity to integrate traditional and emerg-
ing Based on Environmental DNA in Low-
er Reaches of Qiantang River, China. Open
                                              ing approaches to discover more new species, and develop molecular biotic
Journal of Animal Sciences, 11, 105-124.      indices that can be more rapidly, frequently, and robustly used in water qual-
https://doi.org/10.4236/ojas.2021.112009      ity assessments. In order to examine assemblages of eukaryotic microplank-
                                              ton in lower reaches of Qiantang River, ITS gene metabarcoding technology
Received: January 13, 2021
                                              based on environmental DNA was carried out. As a result, various species of
Accepted: March 30, 2021
Published: April 2, 2021                      phytoplankton, fungi and zooplankton were annotated on. More phylum,
                                              classes and specieses of eukaryotic phytoplankton and zooplankton were
Copyright © 2021 by author(s) and             found after compared communities taxa based on metabarcoding with that
Scientific Research Publishing Inc.
                                              obtained from morphological examination. Nevertheless, Chlorophyceae was
This work is licensed under the Creative
Commons Attribution International             the most common assemblage both identified by using these two methods,
License (CC BY 4.0).                          also Mesocyclops leuckarti and Acanthocyclops bicuspidatus were both found
http://creativecommons.org/licenses/by/4.0/   to be the dominant species of Cyclopoida in the river. Additionally, the reads
               Open Access                    proportions of phytoplankton and zooplankton at the three freshwater sam-
                                              pling sites (Tonglu, Fuyang and Wenyan) decreased as temperature drop.
                                              Meanwhile, twenty classes of fungi were annotated on, of which the commu-
                                              nity characteristic was first researched in the river. There were significant
                                              spatial differences in values of Chao1 index for eukaryotic microplankton.
                                              Cluster analysis and Non-metric multidimensional scaling ordination further

DOI: 10.4236/ojas.2021.112009 Apr. 2, 2021                      105                            Open Journal of Animal Sciences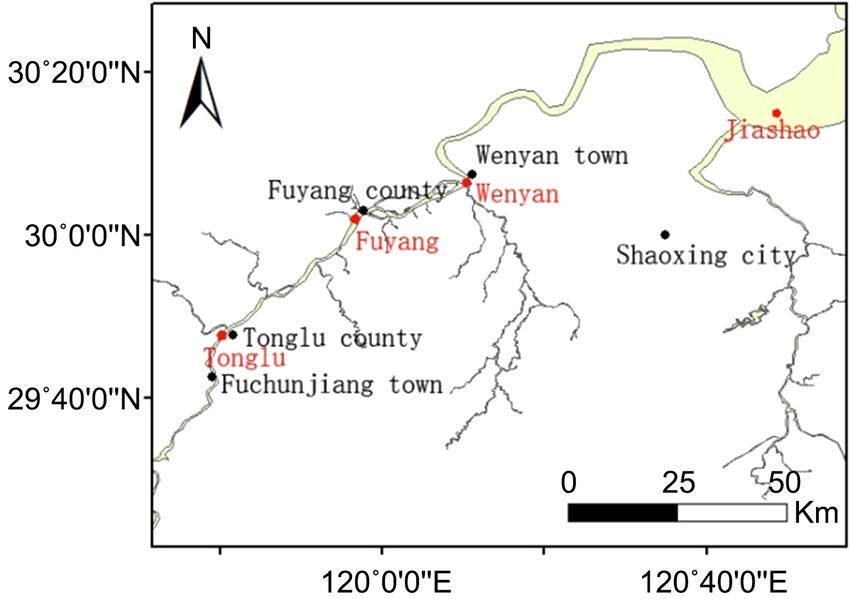
A. J. Zhang et al.

                                  confirmed that the community composition of eukaryotic microplankton at
                                  class level for Jiashao-September sample had the most dissimilarity with the
                                  others.

                                  Keywords
                                  Microplankton, eDNA, Metabarcoding, ITS, Diversity, Qiantang River

                                1. Introduction
                                Eukaryotic microplankton is a group of plankton with particle sizes less than
                                20-µm [1]. It plays an important role in water biotic community and in main-
                                taining the stability of water ecosystems due to its important link in energy flow
                                and material circulation [1]. As the basis of the food chain, analyzing its meta-
                                community structure is very important to assess the status and development
                                tendency of an ecosystem [2].
                                  Traditional practices for biological surveys of inland waters usually center on
                                a common set of ecological indicators or indices/measurements of biodiversity
                                [3], requiring many preparations, such as morphological taxonomic expertise,
                                intact specimens and adequate time [4] [5]. Environmental DNA (eDNA) meta-
                                barcoding provides the opportunity to integrate traditional and emerging ap-
                                proaches to discover more new species [6] [7], and develop molecular biotic in-
                                dices that can be more rapidly, frequently, and robustly used in water quality as-
                                sessments [6] [8] [9]. So far, metabarcoding technology has been widely used for
                                biodiversity monitoring in biological and environmental samples [10] [11] [12]
                                [13]. Despite some limitations (each marker region might import some biases
                                and the blast sequence database is incomplete), the practices of metabarcod-
                                ing-based analysis for estimating diversity and relative abundance of taxonomic
                                groups in aquatic systems will likely increase as technology improved [14].
                                  Now, marker genes used for the analysis of plankton communities via eDNA
                                metabarcoding often focuses on ribosomal DNA (rDNA), ribulose bisphosphate
                                carboxylase large subunit gene (rbc L) and cytochrome C oxidase subunit gene 1
                                (cox1) [8] [15] [16] [17] [18]. Among these, the internal transcribed spacer
                                (ITS), as one gene fragment of rDNA, has been widely used due to its fast evolu-
                                tion and high specificity [17], and its relevant metabarcoding practices for the
                                purpose of monitoring diversity of eukaryon communities mainly focused on
                                soil, plant and marine systems [19] [20] [21] [22].
                                  Here, an ITS metabarcoding assessing assemblages of eukaryotic microplank-
                                ton were conducted. Specifically, ITS gene sequence analysis was performed on
                                surface water samples collected from four sites in Qiantang River lower reaches
                                (Zhejiang, China), an important freshwater fishing water used for drinking,
                                electricity generation, flood control and recreation, in order to analyze the
                                community diversity of eukaryotic microplankton in the section, to assess the

DOI: 10.4236/ojas.2021.112009                        106                              Open Journal of Animal Sciences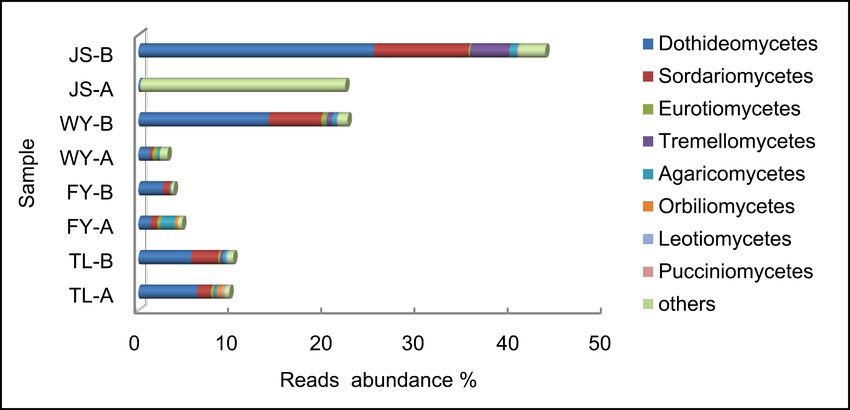
A. J. Zhang et al.
utility of this approach for monitoring diversity of freshwater eukaryotic micro-
plankton community. As a whole, this study provided a theoretical basis for fur-
ther study on the function of eukaryotic microplankton in freshwater ecosystems.
2. Materials and Methods
2.1. Water Sample Collection and Physic Chemical Analysis
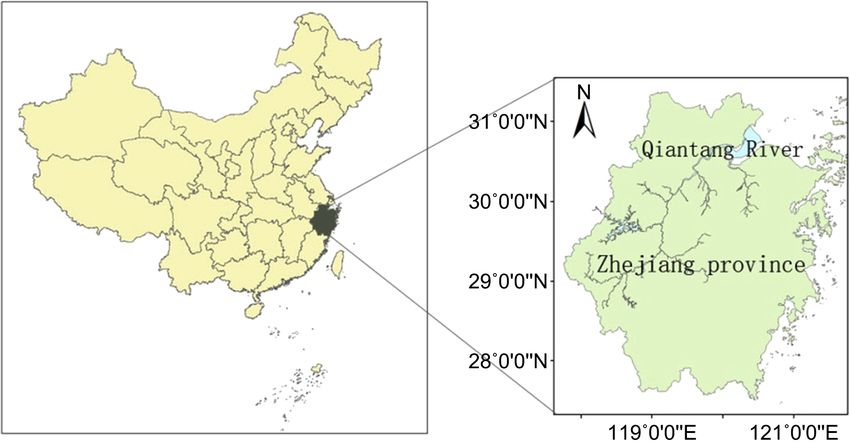
A total of eight water samples were collected in September and November 2019,
at four separate sampling sites in Qiantang River lower reaches, including Ton-
glu, Fuyang, Wenyan and Jiashao sites, hereafter referred to as TL, FY, WY and
JS separately (Figure 1). All sampling, filtering, and other equipments were ste-
rilized before use.
2 L of surface water was collected at a set time by boat from each site. Simul-
taneously, five environmental variables, such as transparency, salinity, water
temperature (WT), pH and dissolved oxygen (DO), were measured in situ by
using a secchi disk and a portable water quality detector (Hach, USA). For each
(a)
(b)
Figure 1. Map shows the study site. (a) The location of Qiantang River in Zhejiang prov-
ince of China; (b) Sampling sites in Qiantang River lower reaches. The red dot represents
the water sampling site, the black dot represents the local government seat.
DOI: 10.4236/ojas.2021.112009 107 Open Journal of Animal Sciences
A. J. Zhang et al.

                                water sample, a 1.5 L water subsample was used to test six environmental va-
                                riables immediately after transported to the laboratory within 24 hours at 4˚C,
                                including Chemical oxygen demand (COD), Chlorophyll a (Chla), total nitrogen
                                (TN), total phosphorus (TP), ammonium (NH4-N) and nitrate-nitrite (NO3-N),
                                the recording of which were following the scheme of [23]. All environmental va-
                                riables were measured in triplicate.

                                2.2. DNA Sample Processing and High-Throughput Sequencing
                                     (HTS)
                                For each water sample, a residual 500-mL water subsample was then filtered
                                through a 0.22-μm cellulose acetate filter paper using a peristaltic pump in the
                                field. Then, each paper was placed inside a commercial sterile centrifuge tube
                                and stored in a container filled with liquid nitrogen until subsequent manipula-
                                tions were performed. DNA was extracted from filters using EZNA water DNA
                                kit (Omega, USA) following the manufacturer’s protocol. The concentration and
                                purity of DNA were determined using NanoDrop 2000c spectrophotometer
                                (Thermo, USA), then followed by multiplex PCR using the universal primers for
                                ITS belonging to eukaryotic mitochondrial DNA fragments, ITS-F (5'-GTGA
                                ATCATCGARTC-3), ITS-R (5'-TCCTCCGCTTATTGAT-3') [22]. Each eDNA
                                sample was subjected to PCRs in triplicate [17.35 μL dH2O, 2.5 μL 10 × PCR
                                buffer, 0.15 μL 5 U/μL Thermo scientific Taq DNA polymerase, 2 μL dNTPs mix
                                (2.5 mM), 1 μL of each primer (10 mM), and 1 μL sample eDNA in a total vo-
                                lume of 25 μL]. PCR cycling parameters were as follows: 96˚C for 3 min, fol-
                                lowed by 35 cycles of 96˚C for 30 s, 50˚C for 30 s, and 72˚C for 90 s, with a final
                                elongation step at 72˚C continued for 7 min. Negative control was conducted
                                simultaneously. After subjecting the PCR products to 1% polyacrylamide gels
                                (see Figure S1), the quantified, size-selected libraries were constructed and con-
                                tinuously diluted to a concentration suitable for sequencing. The libraries were
                                finally sequenced on the Illumina MiSeq 2000 platform by following the manu-
                                facturer’s protocols step by step.

                                2.3. Phytoplankton Samples Collection and Treatment
                                Phytoplankton samples were also simultaneously collected at the four sites. For
                                phytoplankton counts, 1.0 L of water samples were sampled each time and pre-
                                served with 1% Lugol’s iodine solution. Phytoplankton samples were concen-
                                trated to a final volume of 30 ml after sedimentation for 48 h. Thereafter, the
                                taxa were verified and counted under 200× and 400× magnifications for at least
                                500 specimens [23]. The data were made to compare with that collected from
                                ITS gene metabarcoding method.

                                2.4. Bioinformatics and Sequencing Data Upload
                                The raw sequencing FASTQ file was transformed to a FASTA file by the Fastx
                                toolkit V0.0.1 [24]. Clean reads were gained after trimming the low quality se-

DOI: 10.4236/ojas.2021.112009                        108                             Open Journal of Animal Sciences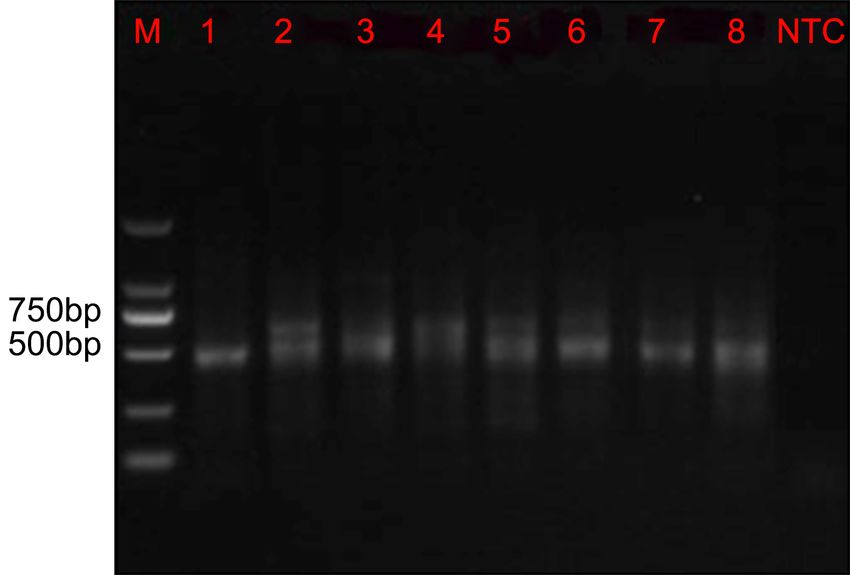
A. J. Zhang et al.

                                quences and PCR chimeras by using Fqtrim V0.9.4
                                (http://ccb.jhu.edu/software/fqtrim/) and Vsearch 2.3.4 [25]. Vsearch 2.3.4 soft-
                                ware continued to be utilized to cluster Operational taxonomic units (OTUs)
                                at 97% cutoff of sequence similarity. Representative sequences of OUTs were
                                assign to taxonomic groups against the NCBI Genbank by using Blast+ 2.6.0
                                at 80% cutoff of identity thresholds with over 80% matches and expect values
                                less than 1e−5. The Sequencing data have been uploaded to NCBI Sequence
                                Read Archive database, with accession numbers vary from SRR10800795 to
                                SRR10800802.

                                2.5. Date Analysis
                                Three α-diversity indices, including Chao1 estimators, Simpson index, and
                                Shannon index, were calculated based on data obtained by metabarcoding mon-
                                itoring. Additionally, Cluster analysis taken by group average method and
                                Non-metric multidimensional scaling (NMDS) was employed to cluster samples
                                in Primer 5.0 environment [26], of which species data were first transformed
                                according to [27]. Additionally, basic data processing, drawing and statistical
                                analyses (e.g. one-way ANOVA) were conducted using Excel 2007 and SPSS 16.0
                                software.

                                3. Results
                                3.1. Environmental Characterization
                                The results of environmental variables are showed in Table 1. WT showed sig-
                                nificant differences between months. TN showed significant negative association
                                with transparency at p < 0.05, with COD at p < 0.01, and significant positive as-
                                sociation with TP at p < 0.01. In addition, NH4-N showed a significant positive
                                association with TP and WT at p < 0.05. The values of TN: TP mass ratios were
                                all higher than 7 in all sampling sites, indicating the research area was generally
                                P-limited at the experimental period.

                                3.2. Sequencing Analysis
                                ITS gene metabarcoding yielded 67,469 - 129,150 raw reads, of which 55,687 -
                                112,832 clean reads were obtained after optimization, resulting in effective data
                                rates varying from 64.1% to 88.8% (Table 2). The sequences clustered into a to-
                                tal of 5795 OTUs, varying from 706 to 1911 at an average of 1245 (Table 2).
                                Meanwhile, the rarefaction curves of each sample all showed the observed spe-
                                cies number flatted out as sequence increasing, indicating the amount of se-
                                quencing data at the 97% similarity threshold was sufficient to satisfy the as-
                                sessment of species diversity.

                                3.3. Community Structure Composition
                                In total, Phytoplankton, fungi, zooplankton and other eukaryotes were anno-
                                tated on after Blast. Five classes of eukaryotic phytoplankton were annotated on,

DOI: 10.4236/ojas.2021.112009                        109                             Open Journal of Animal Sciences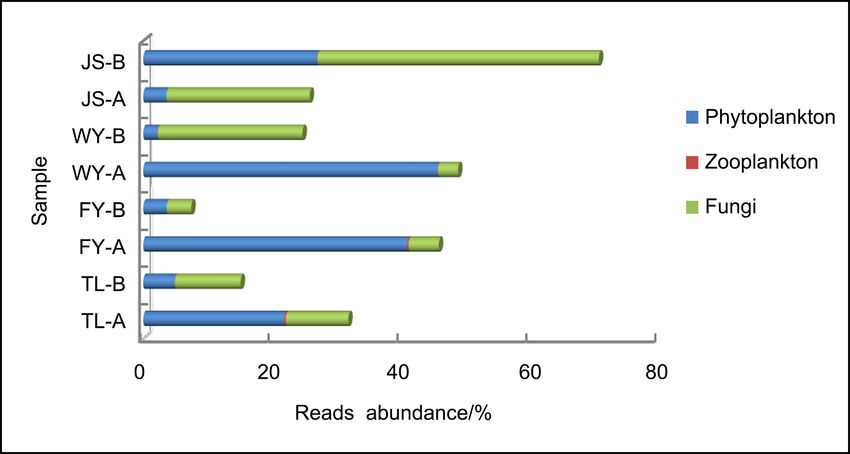
A. J. Zhang et al.

Table 1. Values of the eleven environmental variables from sampling sites.

                                          In situ                                                                   In lab
  Sample        DO                                                Transparency        Chl a       COD        TP           TN        NH4-N         NO3-N
                              pH        WT(˚C)       Salinity
               (mg/L)                                                 (cm)           (μg/L)      (mg/L)    (mg/L)        (mg/L)     (mg/L)        (mg/L)

   TL-A          6.66        7.28         24.8          −             170             1.77       17.00      0.05             2.11    0.33          1.25

   TL-B          7.21        7.38         18.0          −             300             0.40       14.00      0.06             1.73    0.11          1.51

   FY-A          6.53        7.37         26.3          −              75             3.21       15.00      0.05             1.93    0.32          1.26

   FY-B          7.83        7.35         18.3          −             250             0.95       14.00      0.06             1.51    0.12          1.32

   WY-A          8.20        7.29         27.5          −              65             6.97       17.00      0.06             2.00    0.32          1.36

   WY-B          8.25        7.48         18.7          −             110             5.52        8.00      0.04             1.88    0.42          1.28

    JS-A         7.29        7.79         30.3          +                 5           3.82        2.02      0.28             3.77    0.89          1.68

    JS-B         9.33        7.95         18.5          +              10             2.94        2.76      0.29             3.46    0.12          2.89

A: the “September” sample; B: the “November” sample. Hereinafter inclusive; +: salinity measured; −: no salinity measured.

Table 2. Temporal and spatial variation of indices based on ITS gene metabarcoding data.

                                                     Sep.          Nov.           Sep.         Nov.        Sep.         Nov.         Sep.          Nov.
                  Description
                                                             TL                           FY                       WY                        JS

             Number of raw reads                    86,859         87,871      72,481          83,729     67,469        73,525      68,724        129,150

            Number of clean reads                   55,687         75,178      60,425          73,516     55,784        65,278      59,221        112,832

            effective data rate (%)                  64.1           85.6          83.4          87.8       82.7          88.8        86.2          87.4

              Number of OTUs                        1911           1370          1485           978       1641          1130         706           744

  Reads abundance for phytoplankton (%)              21.8           4.9           40.9          3.7        45.7          2.2         3.6           27.0

    Reads abundance for zooplankton (%)              0.3            0.1             0.3         0.0        0.1           0.1         0.0            0.1

       Reads abundance for fungi (%)                 9.7            10.2            4.7         3.8        3.1           22.4        22.2          43.7

 Reads abundance for other eukaryotes (%)            0.7            0.1             0.1         0.0        0.2           0.1         0.0            0.2

    Reads abundance for unclassified (%)             89.3           89.6          94.9          96.2       96.6          77.4        77.8           56

   Shannon index based on metabarcoding              7.7            5.1             7.0         4.6        7.6           6.0         3.3            6.1

   Simpson index based on metabarcoding              1.0            0.9             1.0         0.8        1.0           0.9         0.7            1.0

    Chao1 index based on metabarcoding              2063.2        1,494.1        1666.4        1077.2     1813.8        1288.3      810.0          684.9

Sep.: September; Nov.: November.

                                                 in which Chlorophyceae, Trebouxiophyceae and Cryptophyceae had more reads
                                                 abundance (Figure 2(a)). Genera Chlamydomonas, Micractinium, Chlorella,
                                                 Crucigenia, Cryptomonas, Actinastrum, Gonium, Dictyosphaerium and Com-
                                                 pactochlorella were the common phytoplankton, most of which belong to phy-
                                                 lum Chlorophyta, except Cryptomonas which belongs to phylum Cryptophyta.
                                                 Meanwhile, three classes of zooplankton, including Ciliatea (Protozoa), Maxil-
                                                 lopoda (Arthropoda) and Hydrozoa (Cnidaria), were annotated on, and the first
                                                 two classes were the common zooplankton assemblages (Figure 2(b)). Further-

DOI: 10.4236/ojas.2021.112009                                                 110                                     Open Journal of Animal Sciences
A. J. Zhang et al.

                                more, twenty classes of fungi were annotated on, Dothideomycetes, Sordari-
                                omycetes, Eurotiomycetes and Tremellomycetes were the common classes
                                (Figure 2(c)). However, the common classes of fungi in JS-A sample were oth-
                                ers, such as Malasseziomycetes, Agaricostilbomycetes, Ustilaginomycetes and
                                Wallemiomycetes.

                                                                          (a)

                                                                          (b)

                                                                          (c)

                                Figure 2. Reads abundance of eukaryotic microplankton (phytoplankton (a), zooplank-
                                ton (b) and fungi (c)) based on ITS gene metabarcoding in eight samples at class level.

DOI: 10.4236/ojas.2021.112009                         111                              Open Journal of Animal Sciences
A. J. Zhang et al.

                                3.4. Seasonal Dynamics of Communities
                                Overall, the total reads of ITS annotated on eukaryotic microplankton in Sep-
                                tember was higher than that in November. The dominant assemblage in TL, FY
                                and WY sites in September was phytoplankton, contributing 21.8%, 40.9% and
                                45.7% of the total reads respectively, followed by fungi (9.7%, 4.70% and 3.1%,
                                respectively) and zooplankton (0.3%, 0.3% and 0.1%, respectively), however, the
                                result in JS site was different, in which fungi was dominant (Table 2; Figure 3).
                                Nevertheless, fungi changed to be the dominant in November in all four sam-
                                pling sits with 10.2% of total reads in TL, 3.8% in FY, 22.4% in WY and 43.7% in
                                JS site, and phytoplankton became to be the secondary assemblages simulta-
                                neously (Table 2; Figure 3). Combined with water temperature and salinity
                                condition, the reads proportions of phytoplankton and zooplankton in the three
                                freshwater sampling sites (TL, FY and WY) decreased as temperature drop,
                                while fungi increased in majority of sites except FY. The reads abundance of
                                phytoplankton and zooplankton at the estuarine site, JS, were fewer than the
                                contemporaneous reads of three freshwater sites, and the reads of fungi were al-
                                so opposite.

                                3.5. Diversity Analysis of Eukaryotic Microplankton
                                Significant spatial differences in values of Chao1 index were deduced (p < 0.05).
                                However, Shannon and Simpson indexes showed no significant spatio-temporal
                                differences. Generally, the three indexes in September at the freshwater sampling
                                sites were all higher than that in November, which was a little different from that
                                in JS sites (Table 2).
                                  Eight samples were divided into two clusters at the 20% level, cluster for JS-A
                                and cluster for the other seven samples, indicating that the microplankton class
                                composition of JS-A had the least similar with that of the other samples (Figure
                                4(a)), which was also verified by using NMDS ordination method (Figure 4(b)).

                                Figure 3. Reads abundance vibration of eukaryotic microplankton based on ITS gene
                                metabarcoding in eight samples.

DOI: 10.4236/ojas.2021.112009                            112                         Open Journal of Animal Sciences
A. J. Zhang et al.
(a)
(b)
Figure 4. Cluster analysis of microplankton community on eight sampling sites based on
metabarcoding monitoring. (a) Cluster analysis taken by group average method; (b)
Non-metric multidimensional scaling ordination based on Bray-Curtis similarity of mi-
croplankton class composition.
3.6. Data of High-Throughput Sequencing (HTS) and Morphology
Comparison
We compared the communities of phytoplankton and zooplankton taxa with
results obtained from morphological analysis in order to determine potential bi-
ases of the primer set used in our study. Species of three phylum and five classes
of eukaryotic phytoplankton were annotated by metabarcoding method, which
was different from that identified by microscopic examination. Also, more than
104 phytoplankton species were identified by metabarcoding (193 species vs. 89
species) (Table 3). Chlorophyceae was the most common assemblage, which was
consistent with the finding via morphology, accounting for 12.93% - 79.45% of
the total eukaryotic phytoplankton reads, among which Chlamydomonas rein-
hardtii was dominant, contributing 1.22% of the total reads. Meanwhile, genera
with higher reads proportion, such as Chlamydomonas, Chlorella, Crucigenia,
Cryptomonas, Actinastrum, Gonium and Dictyosphaerium, were widespread in
freshwater of Zhejiang province [27] [28] and were also dominant genera that
identified via morphology (Table S1).
DOI: 10.4236/ojas.2021.112009 113 Open Journal of Animal SciencesA. J. Zhang et al.
Table 3. Comparison analysis of eukaryotic phytoplankton data based on metabarcoding
technology and morphological examination.
Description Metabarcoding monitoring Morphological monitoring
Number of phylum 3 5
Chlorophyta, Bacillariophyta,
Chlorophyta, Bacillariophyta
Phylum list Cryptophyta, Euglenophyta
and Cryptophyta
and Dinoflagellate
Number of classes 5 6
Pedinophyceae, Chlorophyceae, Chlorophyceae, Centricae, Pennatae,
Classes list Trebouxiophyceae, Centricae Cryptophyceae, uglenophyceae
and Cryptophyceae and Dinophyceae
Number of genus 99 50
Number of species 193 89
For the zooplankton, the comparisons were made with data reported by [29]
and [30]. As a widely distributed taxa in Qiantang River, Cyclopoida was identi-
fied in this study, and the dominant species of Cyclopoida annotated on were
Mesocyclops leuckarti and Acanthocyclops bicuspidatus, which was consistent
with the discovery of [29]. However, as another dominant assemblage [30], roti-
fers were not annotated here.
4. Disscussion
4.1. The Feasibility of Microplankton Community Analysis Based
on ITS Gene Metabarcoding
In this study, we selected ITS with fast evolution and high specificity as the am-
plicon to describe the community structure and its dynamics of eukaryotic mi-
croplankton in Qiantang River lower reaches. Here, the community characteris-
tics of fungi in the Qiantang River were first researched, it’s found that Dothi-
deomycetes, Sordariomycetes, Eurotiomycetes and Tremellomycetes were the
most common groups, which were different from that in the Yellow Sea con-
cluded by using the same amplicon [22].
After compared the communities of phytoplankton and zooplankton taxa
with results obtained from metabarcoding and morphological analysis, we re-
vealed the same most common assemblage, and discovered 104 more species via
metabarcoding. Compared with previous studies [28], it’s speculated that the
phytoplankton community had changed somewhat since then, but some domi-
nant specieses maintained unchanged, genera Chlamydomonas and Crypto-
phyllum were still common dominant groups. Meanwhlie, Anthoathecata, a
zooplankton taxa that hasn’t been identified by microscopic examination, was
annotated on JS samples. Anthoathecata is an order of class Hydrozoa and dis-
tributes on the east and south coast of China. Here, JS sites are located in the
estuary area of Qiantang River, indicating a possibility that species of Anthoa-
DOI: 10.4236/ojas.2021.112009 114 Open Journal of Animal SciencesA. J. Zhang et al.
thecata distribution. However, rotifers were not detected by metabarcoding. The
predatory relationship between species may be a considerable reason. Generally,
the DNA of the prey does not get separated out during the blast, especially if the
prey items belong to the same genus as the predator. In addition, the preference
of primer and differences in rRNA gene copy numbers may also explain some of
these differences.
Overall, these findings demonstrated that metabarcoding could yield compa-
rable results to conventional methods for several abundant eukaryotic taxa, but
that each method has different limitations as far as accurately describing the eu-
karyotic composition in this river.
4.2. Community Diversity Characteristic of Eukaryotic
Microplankton
Here, geographically, the sampling sites from top to bottom are, in order, Ton-
glu, Fuyang, Wenyan and Jiashao. There is no hydraulic dam between the four
sampling sits, and all of them are in the tidal reach of the river, resulting in a rel-
atively frequent water exchange caused by the flow of tide. Compared with other
sites, JS is near estuarine region and more affected by seawater. Correlation
analysis showed that there were significant spatial differences in values of Chao1
index (p < 0.05), indicating the species richness had obvious dissimilarity be-
tween sampling sites. Cluster analysis and NMDS ordination further confirmed
the microplankton class composition of JS-A had the most dissimilarity with
that of the other samples, the content of salinity might be one of the reasons
[31]. Studies have shown that some spatial differences in eukaryotic plankton
α-diversity is more the result of selection by local environmental conditions than
dispersal [32], the feasibility of α-diversity based on ITS rRNA gene metabar-
coding might be a useful indicator for discriminating ecological condition.
5. Conclusion
Our data were generated using a primer set that targets the ITS region of ribo-
somal RNA gene, a region that has been widely used in biodiversity assessments
in phytoplankton, fungi, zooplankton, etc. As a result, various species of phy-
toplankton, fungi and zooplankton were annotated. We identified several groups
of eukaryotic phytoplankton and zooplankton that were not described by mor-
phological analysis, and increased research on fungi in Qiantang River that nev-
er had been studied before. Chlorophyceae was the most common assemblage
both identified by using ITS gene metabarcoding and morphological examina-
tion methods, also Mesocyclops leuckarti and Acanthocyclops bicuspidatus were
both found to be the dominant species of Cyclopoida in the river. The reads
proportions of phytoplankton and zooplankton at the three freshwater sampling
sites (Tonglu, Fuyang and Wenyan) decreased as temperature drop. In addition,
there were significant spatial differences in values of Chao1 index for eukaryotic
microplankton. Finally, it’s confirmed that the Metabarcoding-based approach
DOI: 10.4236/ojas.2021.112009 115 Open Journal of Animal SciencesA. J. Zhang et al.
herein described can be used in analyzing community characteristics of eukaryo-
tic microplankton to some extent and will significantly be complete as technol-
ogy improved.
Acknowledgements
We would like to thank the sequencing staff of LC-BIO for their help in
high-throughput sequencing. This research was provided by Zhejiang Science
and Technology Project (No. 2019C02047) to Zhiming Zhou.
Conflict of Interest
The authors declare no conflicts of interest regarding the publication of this pa-
per.
References
[1] Si Sieburth, J.M., Smetacek, V. and Lenz, J. (1978) Pelagic Ecosystem Structure: He-
terotrophic Compartments of the Plankton and Their Relationship to Plankton Size
Fractions. Limnology and Oceanography, 23, 1256-1263.
https://doi.org/10.4319/lo.1978.23.6.1256
[2] Lovejoy, C., Massana, R. and Pedrós-Alió, C. (2006) Diversity and Distribution of
Marine Microbial Eukaryotes in the Arctic Ocean and Adjacent Seas. Applied and
Environmental Microbiology, 72, 3085-3095.
https://doi.org/10.1128/AEM.72.5.3085-3095.2006
[3] Jørgensen, S.E., Xu, L. and Costanza, R. (2016) Handbook of Ecological Indicators
for Assessment of Ecosystem Health. 2nd Edition, CRC Press, New York, 464 p.
https://doi.org/10.1201/EBK1439809365
[4] Chan, A., Chiang, L.P., Hapuarachchi, H.C., Tan, C.H., Pang, S.C., Lee, R., Lee, K.S.,
Ng, L.C. and Lam-Phua, S.G. (2014) DNA Barcoding: Complementing Morpholog-
ical Identification of Mosquito Species in Singapore. Parasites and Vectors, 7, 569.
https://doi.org/10.1186/s13071-014-0569-4
[5] Ko, H.L., Wang, Y.T., Chiu, T.S., Lee, M.A., Leu, M.Y., Chang, K.Z., Chen, W.Y.
and Shao, K.T. (2013) Evaluating the Accuracy of Morphological Identification of
Larval Fishes by Applying DNA Barcoding. PLoS ONE, 8, e53451.
https://doi.org/10.1371/journal.pone.0053451
[6] Pawlowski, J., Lejzerowicz, F., Apotheloz-Perret-Gentil, L., Visco, J. and Esling, P.
(2016) Protist Metabarcoding and Environmental Biomonitoring: Time for Change.
European Journal of Protistology, 55, 12-25.
https://doi.org/10.1016/j.ejop.2016.02.003
[7] Trebitz, A.S., Hoffman, J.C., Darling, J.A., Pilgrim, E.M., Kelly, J.R., Brown, E.A.,
Chadderton, W.L., Egan, S.P., Grey, E.K., Hashsham, S.A., Klymus, K.E., Mahon,
A.R., Ram, J.L., Schultz, M.T., Stepien, C.A. and Schardt, J.C. (2017) Early Detection
Monitoring for Aquatic Non-Indigenous Species: Optimizing Surveillance, Incor-
porating Advanced Technologies, and Identifying Research Needs. Journal of Envi-
ronmental Management, 202, 299-310.
https://doi.org/10.1016/j.jenvman.2017.07.045
[8] Bell, T.A.S., Emel, S.K., Felföldi, T., Vasas, G., Fields, M.W. and Peyton, B.M. (2018)
Microbial Community Changes during a Toxic Cyanobacterial Bloom in an Alka-
line Hungarian Lake. Antonie van Leeuwenhoek, 111, 2425-2440.
DOI: 10.4236/ojas.2021.112009 116 Open Journal of Animal SciencesA. J. Zhang et al.
https://doi.org/10.1007/s10482-018-1132-7
[9] Keck, F., Vasselon, V., Tapolczai, K., Rimet, F. and Bouchez, A. (2017) Freshwater
Biomonitoring in the Information Age. Frontiers in Ecology and the Environment,
15, 266-274. https://doi.org/10.1002/fee.1490
[10] Banerji, A., Bagley, M., Elk, M., Pilgrim, E., Martinson, J. and Santo Domingo, J.
(2018) Spatial and Temporal Dynamics of a Freshwater Eukaryotic Plankton
Community Revealed via 18s rRNA Gene Metabarcoding. Hydrobiologia, 818,
71-86. https://doi.org/10.1007/s10750-018-3593-0
[11] Cannon, M.V., Bogale, H., Rutt, L., Humphrys, M., Korpe, P., Duggal, P., Ravel, J.
and Serre, D. (2018) A High-Throughput Sequencing Assay to Comprehensively
Detect and Characterise Unicellular Eukaryotes and Helminths from Biological and
Environmental Samples. Microbiome, 6, 195.
https://doi.org/10.1186/s40168-018-0581-6
[12] Matyugina, E., Belkova, N., Borzenko, S., Lukyanov, P., Kabilov, M., Baturina, O.,
Martynova-Van Kley, A., Nalian, A. and Ptitsyn, A. (2018) Structure and Diversity
Dynamics of Microbial Communities at Day and Night: Investigation of Meromic-
tic Lake Doroninskoe, Transbaikalia, Russia. Journal of Oceanology and Limnology,
36, 80-94. https://doi.org/10.1007/s00343-018-7332-1
[13] Wang, X.H., Wang, S.H. and Zhao, H. (2019) Unraveling Microbial Community
Diversity and Succession of Chinese Sichuan Sausages during Spontaneous Fer-
mentation by High-Throughput Sequencing. Journal of Food Science and Technol-
ogy-Mysore, 56, 3254-3263. https://doi.org/10.1007/s13197-019-03781-y
[14] Stoddard, S.F., Smith, B.J., Hein, R., Roller, B.R.K. and Schmidt, T.M. (2014) rrnDB:
Improved Tools for Interpreting rRNA Gene Abundance in Bacteria and Archaea
and a New Foundation for Future Development. Nucleic Acids Research, 43,
593-598. https://doi.org/10.1093/nar/gku1201
[15] Capo, E., Domaizon, I., Maier, D., Debroas, D. and Bigler, C. (2017) To What Ex-
tent Is the DNA of Microbial Eukaryotes Modified during Burying into Lake Sedi-
ments? A Repeat-Coring Approach on Annually Laminated Sediments. Journal of
Paleolimnology, 58, 479-495. https://doi.org/10.1007/s10933-017-0005-9
[16] Qiao, L., Yu, J., Li, Y., Guo, H.B., Zhen, Y., Zhang, L.I., Mi, T.Z., Bao, Z.M. and Xu,
X.C. (2019) Amplicon-Based Illumina Sequencing and Quantitative PCR Reveals
Nanoplankton Diversity and Biomass in Surface Water of Qinhuangdao Coastal
Area, China. Journal of Ocean University of China, 18, 962-976.
https://doi.org/10.1007/s11802-019-3774-0
[17] Saunders, G.W. and Kucera, H. (2010) An Evaluation of rbc L, tuf A, UPA, LSU and
ITS as DNA Barcode Markers for the Marine Green Macroalgae. Cryptogamie Al-
gologie, 31, 487-528.
[18] Song, L., Wu, J., Du, J., Li, N., Song, G.J., Wang, K., Sun, M. and Wang, P. (2019)
The Characteristics and Distribution of Eukaryotic Phytoplankton Community in
Liaodong Bay, China. Ocean Science Journal, 54, 183-203.
https://doi.org/10.1007/s12601-019-0007-9
[19] Geml, J., Gravendeel, B., van der Gaag, K.J., Neilen, M., Lammers, Y., Raes, N., Se-
menova, T.A., de Knijff, P. and Noordeloos, M.E. (2014) The Contribution of DNA
Metabarcoding to Fungal Conservation: Diversity Assessment, Habitat Partitioning
and Mapping Red-Listed Fungi in Protected Coastal Salix Repens Communities in
the Netherlands. PLoS ONE, 9, e99852.
https://doi.org/10.1371/journal.pone.0099852
[20] Li, Y.L., Dong, J., Wang, B., Sun, M., Wang, A.Y. and Wang, W.B. (2016) Molecular
DOI: 10.4236/ojas.2021.112009 117 Open Journal of Animal SciencesA. J. Zhang et al.
Identification and Detection of Cyanea nozakii by Partial Sequencing of 18S rDNA
and Its-5.8S. Oceanologia Et Limnologia Sinica, 47, 158-165.
[21] Zhang, T. and Yao, Y.F. (2015) Endophytic Fungal Communities Associated with
Vascular Plants in the High Arctic Zone Are Highly Diverse and Host-Plant Specif-
ic. PLoS ONE, 10, e0130051. https://doi.org/10.1371/journal.pone.0130051
[22] Zhang, L., Lin, J.N., Zhang, Y., Wang, S.P. and Zhang, X.J. (2018) Eukaryotic Mi-
croplankton Community Diversity and Characteristics of Regional Distribution in
the Yellow Sea by ITS High-Throughput Sequencing. Environmental Science, 39,
400-411.
[23] Lv, H., Yang, J., Liu, L.M., Yu, X.Q., Zheng, Y. and Chiang, P.C. (2014) Tempera-
ture and Nutrients Are Significant Drivers of Seasonal Shift in Phytoplankton
Community from a Drinking Water Reservoir, Subtropical China. Environmental
Science and Pollution Research, 21, 5917-5928.
https://doi.org/10.1007/s11356-014-2534-3
[24] Cock, P.J., Antao, T., Chang, J.T., Chapman, B.A., Cox, C.J., Dalke, A., Friedberg, I.,
Hamelryck, T., Kauff, F. and Wilczynski, B. (2009) Biopython: Freely Available Py-
thon Tools for Computational Molecular Biology and Bioinformatics. Bioinformat-
ics, 25, 1422-1423. https://doi.org/10.1093/bioinformatics/btp163
[25] Edgar, R.C. (2010) Search and Clustering Orders of Magnitude Faster than BLAST.
Bioinformatics, 26, 2460-2461. https://doi.org/10.1093/bioinformatics/btq461
[26] Clarke, K.R. and Warwick, R.M. (2001) Changes in Marine Communities: An Ap-
proach to Statistical Analysis and Interpretation. Mount Sinai Journal of Medicine
New York, 40, 689-692.
[27] Zhang, A.J., Liu, J.D., Yang, Y.J., Guo, A.H. and Zhao, Z.Y. (2016) The Analysis of
the Community Characteristics of Macrozoobenthos in Enhancement and Releasing
Zone of Qiantang River, Tonglu Section. Acta Agriculturae Zhejiangensis, 28,
1323-1331.
[28] Xia, W.C., Xie, L.N., Tong, Y.Y. and Ma, X.N. (1989) Investigation on Resources of
Main Economic Fish and Food Organism in the Qiantang River Lower Reaches.
Reservoir Fisheries, 2, 32-35.
[29] Yu, J., Yu, H.Y. and Yao, J.L. (2010) Distribution and Seasonal Changes of Crusta-
cean Plankton in Qiantang River Basin. Notification of Marine Lakes, 4, 61-71.
[30] Guo, A.H., Yuan, J.L., Zhang, A.J., Hao, Y.B., Liu, J.D. and Gu, Z.M. (2019) The
Spatial and Temporal Pattern of Rotifer Community in Fuchun Section of Qiantang
River and Its Relationship with Environmental Factors. Jiangsu Agricultural
Science, 47, 243-247.
[31] Cui, S.K., He, J.F., He, P.M., Zhang, F., Lin, L. and Ma, Y.X. (2014) Adaptation of
Phytoplankton Communities to Light and Salinity Variation in Kongsfjorden
(Spitsbergen), Arctic. Chinese Journal of Polar Research, 26, 230-237.
[32] Havel, J.E. and Shurin, J.B. (2004) Mechanisms, Effects, and Scales of Dispersal in
Freshwater Zooplankton. Limnology and Oceanography, 49, 1229-1238.
https://doi.org/10.4319/lo.2004.49.4_part_2.1229
DOI: 10.4236/ojas.2021.112009 118 Open Journal of Animal SciencesA. J. Zhang et al.
Supplementary Information
Supplementary information accompanies this paper at:
https://doi.org/10.4236/ojas.2021.111009
Additional file 1: Figure S1. Results of eight water DNA samples amplified
by the ITS primer. Table S1. Species of eukaryotic phytoplankton indentified by
using ITS gene metabarcoding technology and morphological examination.
Figure S1. Results of eight water DNA samples amplified by the ITS primer. Lane M:
Takara DL2000 DNA Maker; Lane 1 to 8: PCR products of JS-A, WY-A, FY-A, TL-A,
JS-B, WY-B, FY-B and TL-B; Lane NTC: Negative control.
Table S1. Species of eukaryotic phytoplankton indentified by using ITS gene metabarcoding technology and morphological method.
Metabarcoding monitoring Morphological monitoring
Number
Classes Species Classes Species
1 Chlorophyta Pedinomonas sp. Chlorophyta Cosmarium sp.
2 Acutodesmus bajacalifornicus Cosmarium abbreviatum
3 Acutodesmus deserticola Cosmarium circulare
4 Acutodesmus sp. KNUA038 Cosmarium leave
5 Coelastrella rubescens Cosmarium absoletum
6 Coelastrella vacuolata Euastrum dubium
7 Coelastrella sp. Penium Cruciferum
8 Coronastrum ellipsoideum Closterium sp.
9 Nephrochlamys subsolitaria Pleodorina sp.
10 Planktosphaeria gelatinosa Tetraedron minimum
11 Desmodesmus armatus Tetraspora sp.
12 Desmodesmus asymmetricus Raphidonema sp.
13 Desmodesmus bicellularis Chlamydomonas sp.
14 Desmodesmus brasiliensis Platymonas elliptica
15 Desmodesmus communis Coelastrum microporum
16 Desmodesmus costato-granulatus Eudorina sp.
DOI: 10.4236/ojas.2021.112009 119 Open Journal of Animal SciencesA. J. Zhang et al.
Continued
17 Desmodesmus denticulatus Pandorina sp.
18 Desmodesmus insignis Schroederia spiralis
19 Desmodesmus intermedius Chlorella sp.
20 Desmodesmus maximus Actinastrum sp.
21 Desmodesmus opoliensis Ankistrodesmus angustus
22 Desmodesmus pannonicus Ankistrodesmus convolutus
23 Desmodesmus perdix Ankistrodesmus falcatus
24 Desmodesmus pirkollei Ankistrodesmus falcatus var.mirabilis
25 Desmodesmus santosii Oocystis lacustris
26 Desmodesmus sp. Pediastrum simplex
27 Hariotina reticulata Pediastrum tetras
28 Pectinodesmus pectinatus Crucigenia quadrata
29 Pectinodesmus regularis Crucigenia apiculata
30 Sphaeroplea robusta Scenedesmus sp.
31 Rotundella rotunda Scenedesmus bijuga
32 Monoraphidium griffithii Scenedesmus quadricauda
33 Tetradesmus acuminatus Bacillariophyta Cyclotella sp.
34 Tetradesmus bernardii Cyclotella meneghiniana
35 Tetradesmus distendus Cyclotella aslerocastata
36 Tetradesmus incrassatulus Melosira granulata
37 Tetradesmus nygaardii Melosira granulate
38 Tetradesmus obliquus Melosira granulata var. angustissima
39 Tetradesmus reginae Melosira varians
40 Verrucodesmus parvus Coscinodiscus sp.
41 Neochloris conjuncta Coscinodiscus subtilis
42 Neochloris vigensis Coscinodiscus oculusiridis
43 Neochloris sp. AY2 Skeletonema costatum
44 Stauridium privum Synedra acus
45 Stauridium tetras Synedra ulna
46 Lacunastrum gracillimum Synedra ulna var. impressa
47 Monactinus sturmii Fragilaria sp.
48 Hydrodictyon reticulatum Fragilaria capucina
49 Pseudopediastrum sp. KNUA039 Fragilaria biceps
50 Chlamydomonas applanata Gomphonema sp.
51 Chlamydomonas asymmetrica Gomphonema subclavatum
DOI: 10.4236/ojas.2021.112009 120 Open Journal of Animal SciencesA. J. Zhang et al.
Continued
52 Chlamydomonas bacca Gomphonema simus
53 Chlamydomonas debaryana Gomphonema parvulum
54 Chlamydomonas dorsoventralis Cocconeis placentula
55 Chlamydomonas globosa Nitzschia sp.
56 Chlamydomonas hedleyi Nitzschia acula
57 Chlamydomonas inflexa Nitzschia palea
58 Chlamydomonas leiostraca Nitzschia acicularis
59 Chlamydomonas mexicana Surirella ovata
60 Chlamydomonas proboscigera Surirella robusta
61 Chlamydomonas rapa Gyrosigma acuminatum
62 Chlamydomonas reinhardtii Didymosphenia geminata
63 Chlamydomonas sphagnophila Amphoraovalis
64 Chlamydomonas splendida Frustulia vulgaris
65 Chlamydomonas sp. Navicula sp.
66 Gloeomonas anomalipyrenoides Navicula rhynchocephala
67 Lobochlamys segnis Navicula cuspidata
68 Chloromonas perforata Cymbella sp.
69 Carteria eugametos Cymbellalanceolata
70 Carteria incisa Cymbellaturgidula
71 Tetraselmis suecica Diatoma vulgare
72 Vitreochlamys nekrassovii Eunotia sp.
73 Colemanosphaera charkowiensis Pinnularia sp.
74 Volvulina compacta Cymatopleura sp.
75 Gonium pectorale Cymatopleura elliptica
76 Coelastrum astroideum Leptocylindrus danicus
77 Coelastrum microporum Trioeratium favm
78 Coelastrum pseudomicroporum Cryptophyta Cryptomonas ovata
79 Eudorina cylindrica Cryptomonas erosa
80 Eudorina elegans Chroomonas caudata
81 Eudorina sp. KMMCC 1278 Euglenophyta Euglena sp.
82 Eudorina unicocca Euglena geniculata
83 Pandorina colemaniae Trachelomonas curta
84 Pandorina morum Strombomonas fluviatilis
85 Volvox carteri Pyrrophyta Peridinium sp.
86 Dunaliella parva Peridinium pusillum
DOI: 10.4236/ojas.2021.112009 121 Open Journal of Animal SciencesA. J. Zhang et al.
Continued
87 Dunaliella pseudosalina Peridinium umbonatum
88 Characium oviforme Ceratium hirundinella
89 Schroederia setigera Gymnodinium sp.
90 Closteriopsis acicularis
91 Didymogenes anomala
92 Didymogenes palatina
93 Kalenjinia gelatinosa
94 Marasphaerium gattermannii
95 Marvania geminata
96 Masaia oloidia
97 Meyerella planktonica
98 Graesiella emersonii
99 Pseudochlorella signiensis
100 Nannochloris sp. AICB 424
101 Compactochlorella dohrmannii
102 Compactochlorella kochii
103 Chlorella miniata
104 Chlorella pulchelloides
105 Chlorella sorokiniana
106 Chlorella sp.
107 Actinastrum hantzschii
108 Selenastrum capricornutum
109 Kirchneriella aperta
110 Kirchneriella lunaris
111 Ankistrodesmus falcatus
112 Ankyra judayi
113 Chlorococcum oleofaciens
114 Chlorococcum sp. CCAP 11/52
115 Micractinium belenophorum
116 Micractinium inermum
117 Micractinium reisseri
118 Micractinium sp.
119 Neospongiococcum sp. SAG 2474
120 Coenochloris sp. KR 2006/325
121 Franceia amphitricha
DOI: 10.4236/ojas.2021.112009 122 Open Journal of Animal SciencesA. J. Zhang et al.
Continued
122 Oocystella oogama
123 Oocystis sp. KMMCC 251
124 Pediastrum duplex
125 Pedinomonas minor
126 Crucigenia lauterbornii
127 Westella botryoides
128 Scenedesmus armatus
129 Scenedesmus bijugus
130 Scenedesmus quadricauda
131 Scenedesmus sp.
132 Dictyosphaerium ehrenbergianum
133 Dictyosphaerium lacustre
134 Dictyosphaerium libertatis
135 Dictyosphaerium sp.
136 Sorastrum pediastriforme
137 Oedogonium angustistomum
138 Oedogonium cardiacum
139 Oedogonium cylindrosporum
140 Oedogonium donnellii
141 Oedogonium subdissimile
142 Oedogonium tenerum
143 Oedogonium undulatum
144 Oedogonium sp.
145 Gloeotilopsis planctonica
146 Chamaetrichon basiliensis
147 Uronema sp. AF-2012
148 Uronema sp. CCAP 334/1
149 Uronema sp. CCAP 335/1B
150 Urospora neglecta
151 Chaetopeltis orbicularis
152 Chaetophora sp. BEA 0173B
153 Hormotilopsis gelatinosa
154 Hormotilopsis tetravacuolaris
155 Draparnaldia plumosa
156 Stigeoclonium helveticum
157 Schizomeris leibleinii
DOI: 10.4236/ojas.2021.112009 123 Open Journal of Animal SciencesA. J. Zhang et al.
Continued
158 Aphanochaete magnum
159 Cladophora sp. ZZ-2016
160 Rhizoclonium pachydermum
161 Tetracystis excentrica
162 Tetracystis intermedia
163 Tetracystis pulchra
164 Tetracystis sarcinalis
165 Tetracystis sp. 14601-7.1
166 Tetracystis tetraspora
167 Tetracystis texensis
168 uncultured Chlorophyta
169 Pleurastrum sp. CCCryo 194-04
170 Deasonia sp. 14615-7
171 uncultured Desmodesmus
172 Spermatozopsis exsultans
173 Spermatozopsis similis
174 Chlamydocapsa ampla
175 Chlamydopodium starrii
176 Scherffelia dubia
177 Chlorosarcinopsis sp. WJT16-VFNP5
178 Desmochloris halophila
179 Dicloster acuatus
180 Hindakia fallax
181 Elliptochloris marina
182 uncultured Trebouxiophyceae
183 Heterochlorella luteoviridis
184 Chloroidium saccharophilum
185 Choricystis parasitica
186 Chlorophyta sp. MCWWS13
187 Chlorophyta sp. SP2-3
188 Bacillariophyta uncultured Thalassiosirales
189 Cyclotella cf. scaldensis G18W42
190 Cyclotella meneghiniana
191 Cryptophyta uncultured Cryptophyta
192 Rhinomonas nottbecki
193 Rhodomonas sp. CCMP740
DOI: 10.4236/ojas.2021.112009 124 Open Journal of Animal SciencesYou can also read