Multifocal acceptance score to evaluate vision: MAS 2EV
←
→
Page content transcription
If your browser does not render page correctly, please read the page content below
www.nature.com/scientificreports
OPEN Multifocal acceptance score
to evaluate vision: MAS‑2EV
Xoana Barcala1*, Maria Vinas2, Mercedes Romero2, Enrique Gambra1,
Juan Luis Mendez‑Gonzalez1, Susana Marcos2 & Carlos Dorronsoro2
We present a new metric (Multifocal Acceptance Score, MAS-2EV) to evaluate vision with presbyopic
corrections. The MAS-2EV is based on a set of images representing natural visual scenes at day and
night conditions projected in far and near displays, and a near stereo target. Subjects view and score
the images through different binocular corrections (monofocal corrections at far; bifocal corrections;
monovision and modified monovision) administered with soft contact lenses (in cyclopleged young
subjects) or with a binocular simultaneous vision simulator (in presbyopic and cyclopleged young
subjects). MAS-2EV scores are visually represented in the form of polygons, and quantified using
different metrics: overall visual quality, visual degradation at far, visual benefit at near, near stereo
benefit, visual imbalance near-far, overall visual imbalance and a combined overall performance
metric. We have found that the MAS-2EV has sufficient repeatability and sensitivity to allow
differentiation across corrections with only two repetitions, and the duration of the psychophysical
task (3 min for subject/condition/correction) makes it useable in the clinic. We found that in most
subjects binocular bifocal corrections produce the lowest visual imbalance, and the highest near stereo
benefit. 46.67% of the subjects ranked binocular bifocal corrections first, and 46.67% of the subjects
ranked monovision first. MAS-2EV, particularly in combination with visual simulators, can be applied
to select prospective presbyopic corrections in patients prior to contact lens fitting or intraocular lens
implantation.
Presbyopia, the loss of the ability to focus near objects, affects 100% of the population over 45 years old1. There
is an increasing number of presbyopic corrections, beyond standard near vision spectacles of progressive addi-
tion, which include monovision and multifocal solutions, in the form of contact lenses (CLs), intraocular lenses
(IOLs) or refractive surgery (RS).
In monovision, one eye is corrected for far distance and the other for near distance to provide functional
vision at all distances. However, for a given distance at least one eye is out of focus. Monovision relies on a selec-
tive suppression of the defocused images coming from one eye while the brain uses the images from the eye that
is in focus. Despite some disadvantages caused by the interocular blur difference, as the loss of binocular vision
and stereopsis2, monovision correction is still the most popular spectacle-free presbyopic correction3.
Alternatively, simultaneous v ision4 creates a superposition of image components with different amounts of
defocus but similar content, position and magnification. Typically, simultaneous vision IOLs (multifocal IOLs;
M-IOLs) are based on diffractive optics, refractive optics or a hybrid approach, while multifocal CLs (M-CLs)5
tend to be based on rotationally-symmetric zonal refractive designs, with a part of the pupil devoted for far, and
another for near (either in the center or periphery). There is an increasing number of M-IOLs and M-CLs in
the market. In general, functionality at near and far (sometimes also intermediate distances) is achieved at the
expense of some reduction in visual quality (blur and contrast reduction) at all d istances6.
Typically, the quality of vision provided by multifocal lenses, monovision and combined strategies (i.e. modi-
fied monovision where the dominant eye is corrected with a monofocal lens at far and the non-dominant eye
is corrected with a multifocal lens3) is tested using visual acuity (VA) at various distances or using defocus
curves7–10. It is well recognized that high contrast VA is a limited descriptor of the quality of vision. Besides, the
complexity and unfamiliarity of multifocal v ision11 require wider and most sophisticated evaluation methods.
Quality of vision is, in fact, multifactorial, and largely depends on visual conditions that affect luminance,
pupil diameter, and on the spatial content and contrast of the visual world12.
To date, the quality of vision is assessed clinically by means of questionnaires that are given to the patient who
self-report visual comfort and task performance in different situations (i.e. reading a restaurant menu, driving,
sewing, etc.…)13. Examples of these questionnaires include NEI RQL-4214, a questionnaire with 42 questions
1
2Eyes Vision, Madrid, Spain. 2Institute of Optics, Spanish National Research Council, IO-CSIC, Madrid,
Spain. *email: xbarcala@2eyesvision.com
Scientific Reports | (2021) 11:1397 | https://doi.org/10.1038/s41598-021-81059-0 1
Vol.:(0123456789)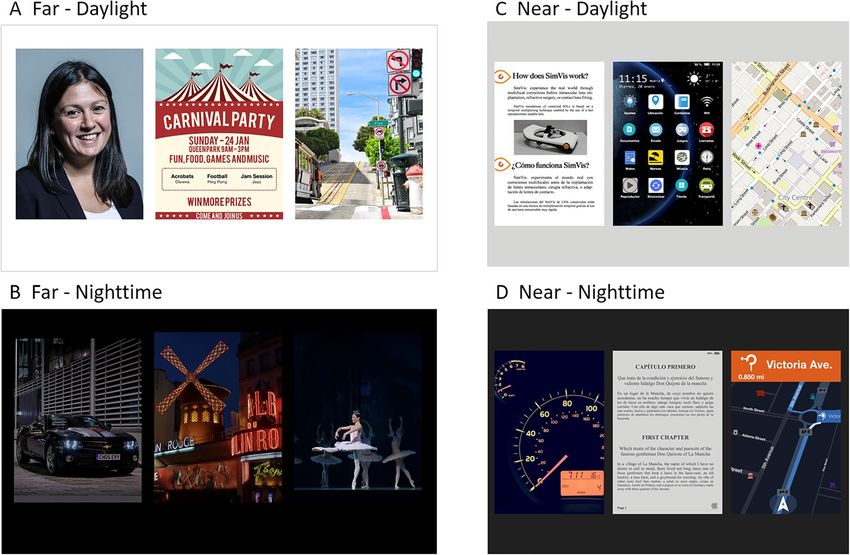
www.nature.com/scientificreports/
that measure the patient’s satisfaction at distance vision, clarity of vision, and severity and frequency of glare
symptoms, along with the need for spectacles. Other questionnaires also include an assessment of the satisfaction
with day and night vision (as the Functional Assessment of Visual Tasks (VISTAS) q uestionnaire15,16) or with
night driving (as VF-14, the Visual Function Index). Some questionnaires (i.e. The Catquest-9SF questionnaire)
address the perceived benefits of cataract s urgery17. While the previous questionnaires were not specifically
designed to evaluate the quality of vision with multifocal lenses, the CLUE questionnaire18 developed by Johnson
and Johnson targets specifically the quality of vision (as well as other comfort aspects) with M-CLs.
Drawbacks associated to vision questionnaires have been addressed before. For example, systematic psycho-
metric evaluations showed that the NEI-RQL-42 questionnaire has deficiencies in most of its tested aspects19.
All questionnaires, even those optimally designed, rely on the patient’s memory, as they rate their vision for situ-
ations that they encountered over different days. Furthermore, the evaluations provided by the questionnaires
may differ across patients, as not every patient is exposed to the same visual environment.
In this paper, we present for the first time a perceived visual quality test (Multifocal Acceptance Score to
Evaluate Vision, MAS-2EV) that combines the systematicity and accessibility of those tests conducted using visual
displays in the clinic (such a VA), with the multi-component description of the visual world that is captured in the
questionnaires. In MAS-2EV, natural images representing scenes that can be encountered in daily life (daytime
and nighttime, near and far distances, and stereovision) are scored by the patient.
The metric can be applied to patients already implanted with a M-IOL, or fitted with CLs of various designs,
similarly to the indicated VA tests or questionnaires. However, the real value of the metric relies on the possibility
to perform these tests pre-operatively or before fitting real CLs on eye. Pre-operative or pre-fitting simulations
are now possible with the use of visual simulators.
Adaptive optics visual simulators typically based on deformable mirrors or spatial light modulators have
been used to replicate various multifocal lens designs7,20–23. Alternatively, SimVis Gekko (SimVis, 2EyesVision),
a see-through wearable binocular visual s imulator8,24,25 with a wide field of view (> 20°) is targeted to prospec-
tive M-IOL and M-CLs patients. SimVis simulates multifocal corrections using tunable lenses working under
temporal multiplexing. Temporal multiplexing is based on fast periodic optical power variations at speeds greater
than the defocus flicker fusion of the human visual system, generating on the patient’s retina multifocal images
that are apparently static and programmable7,26,27.
The new Multifocal Acceptance Score to Evaluate Vision (MAS-2EV) presented here is ideally administered
in combination with binocular visual simulators such as SimVis. The patient experiences through different
presbyopic corrections (simulating prospective contact or intraocular lenses) realistic daytime and nighttime
natural scenes at near and at far, representative of different situations that the patient may encounter in his/her
daily life (with different illuminations, distances, contrasts, glare sources and spatial content). We evaluated the
repeatability and sensitivity of the metric in differentiating across different corrections, using both the SimVis
and real CLs on eye.
Materials and methods
Multifocal acceptance score to evaluate vision (MAS‑2EV). MAS-2EV is a custom-developed met-
ric defined as a multi-component vector, comprising five perceptual scores (PS; 0–10) of multi-stimuli images of
day and night scenes, at far (4 m) and near (40 cm) distance, and of a stereovision target at near. The perceived
image quality of the global visual scene at far and near distances through a given correction was judged by the
subject using a perceptual scoring technique6 ranging from very blurred (score 0) to very sharp (score 10).
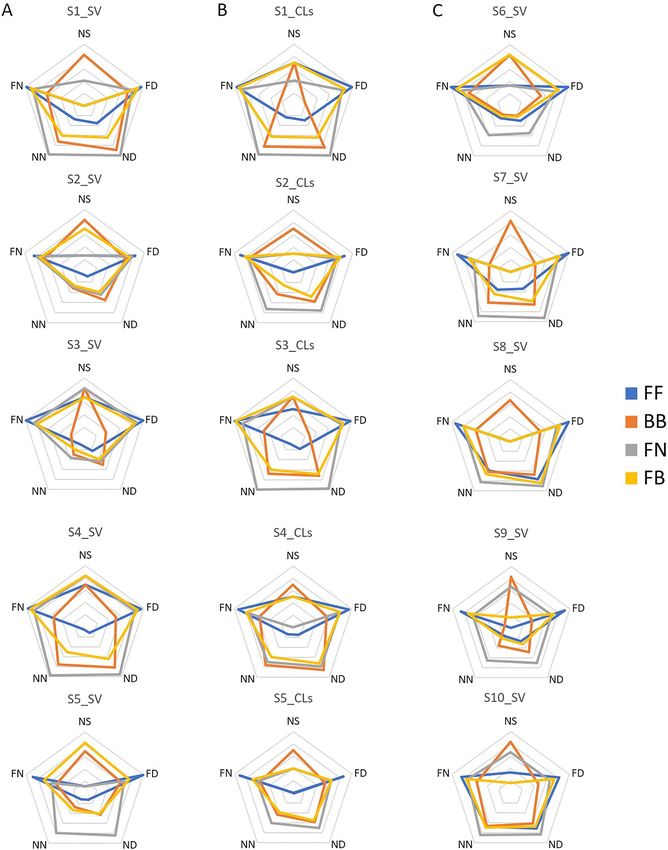
The selected images, shown in Fig. 1, represent four different daily-life visual activity areas: far-day, far-night,
near-day, and near-night. The images are available to distribute and either come from public repositories of
images (details of the sources, licenses and attributions can be found on the acknowledgments) or have been
specifically generated for this study.
The far-day image (Fig. 1A) set consists of a female portrait; a poster with different letter fonts and sizes; and
an urban street view. The far-night set (Fig. 1B) represents urban scenes at night: a view of a stopped car with
the lights on and a readable license plate, with a pair of bright superimposed white LEDs (18 cd/m2) simulating
real headlights introducing glare, a street scene with neon signs of different sizes; and an indoor ballet show.
Near-day (Fig. 1C) activities are represented by a flyer with different text sizes; a smartphone screen with app
icons and text; and a digital city map. The near-night (Fig. 1D) set consisted of a car’s glowing dashboard at
night; an electronic book screenshot with low contrast and different letter sizes; and a GPS navigation map in
night mode. The power spectra of the face and street scene images followed roughly the 1/spatial frequency of
natural images with a spatial frequency range between < 0.25 and > 40 cpd. The objects shown were designed
to be seen at a specific distance and to represent habitual visual scenes for a patient, the size of the text in the
images ranged from 0 to 1 logMAR VA. The contrast and color of each image was carefully selected for match
with the light condition and distance.
Additionally, near stereo-acuity targets are presented, consisting of a Random-dot anaglyph with seven in-
depth Snellen-E letters with different orientations and different crossed disparities (400–50 arcsec). For the stereo
test, the score corresponds to the number of letters whose orientation the subject can detect at 40 cm, ranging
from 0, for stereo disparities equal or above 400 arcsec, to 10, for a disparity of 50 arcsec. The anaglyphs are
presented in an iPad Pro 12.9″ with Retina Display (by Apple Inc) and observed with cyan/red glasses.
The MAS-2EV stimuli were designed to be presented on a standard monitor screen of 42″ for far distance,
and on standard iPad screen of 9.8″, being possible a resize to fit them on higher screens without modifying
the size of the stimuli. In this study, they were presented on a 48.5″ display (3840 × 2160 pixels, 49UH850V, LG)
at 4 m for far distance and on an iPad Pro (2732 × 2048 pixels) at 40 cm for near distance. With the displays
switched off, the room illumination was above 400 lx for day-time conditions, and bellow 2.5 lx for night-time
Scientific Reports | (2021) 11:1397 | https://doi.org/10.1038/s41598-021-81059-0 2
Vol:.(1234567890)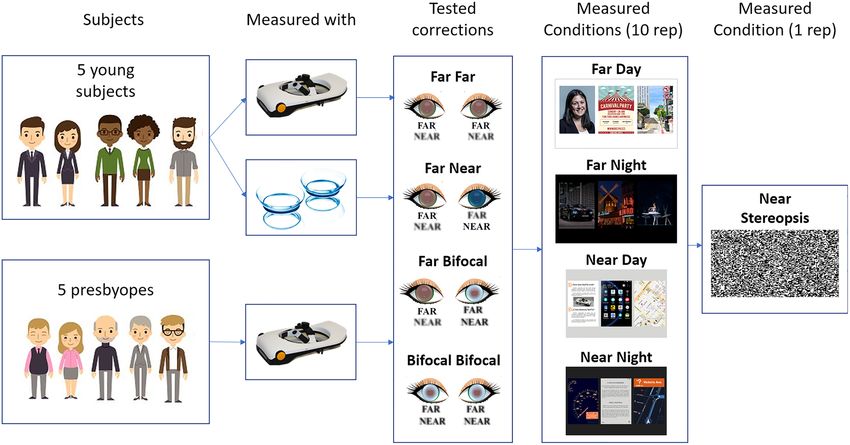
www.nature.com/scientificreports/

                                  Figure 1.  Set of images of MAS-2EV (CC BY open access license, further details in Acknowledgments and
                                  Attributions section).

                                   Subject        Age           Rx OD (Sph, cyl)         Rx OS (Sph, cyl)       Dominance         A.A. OD/OS
                                   S1_ F          26            0.00, − 0.50 × 30        − 0.25, − 0.50 × 150   OD                Cyclopleged
                                   S2_F           26            − 3.75, − 0.50 × 30      − 5.00, − 0.50 × 65    OD                Cyclopleged
                                   S3_F           29            − 2.00, − 0.25 × 95      − 2.50, − 0.25 × 40    OD                Cyclopleged
                                   S4_M           24            − 4.00, − 0.50 × 35      − 4.75, − 0.50 × 165   OS                Cyclopleged
                                   S5_F           38            0.00, − 0.75 × 180       0.00, − 0.75 × 170     OD                Cyclopleged
                                   S6_M           57             + 0.25                  + 0.75, − 0.50 × 70    OS                1.56/1.30
                                   S7_F           68             + 1.25, − 0.25 × 80     + 1.50, − 0.25 × 80    OS                0.93/1.07
                                   S8_F           59             + 1.00, − 0.75 × 100    + 1.00, − 0.75 × 80    OS                1.61/0.93
                                   S9_F           60             + 1.50, − 0.50 × 55     + 1.50, − 0.50 × 10⁵   OS                1.29/1.92
                                   S10_F          61             + 1.75, − 0.50 × 80     + 1.50, + 0.25 × 55    OS                1.27/1.67

                                  Table 1.  Individual data of gender (_M male; _F Female); age (years); Sphero-cylindrical refraction (Rx, sph
                                  and cyl in D, x astigmatic angle in degrees) in right (OD) and left (OS) eyes; eye dominance (OD right eye; OS
                                  left eye) and amplitude of accommodation (A.A, in D for OD/OS, only in presbyopes).

                                  conditions. The average luminance of the MAS-2EV stimuli presented on the displays was measured with a col-
                                  orimeter ColorCal (MKII, Cambridge Research Systems). The average luminances were 120 ± 51.21 cd/m2 (for
                                  far-day), 131.67 ± 17.28 cd/m2 (for near-day), 5.40 ± 5.79 cd/m2 (far-night) and 1.86 ± 0.30 cd/m2 (near-night).
                                  The brightness control of the displays was not changed between day and night conditions for far distance. The
                                  brightness control of the iPad was changed from the maximum (day condition) to the minimum (night condi-
                                  tion) for near distance.

                                  Subjects. Measurements were performed in ten healthy subjects: five young subjects (age: 29 ± 6 years;
                                  spherical error (sph): -2.23 ± 2.07 D) and five presbyopic subjects (age: 61 ± 4; 1.20 ± 0.45D). Astigmatism was
                                  lower than 0.75 D in all subjects. Anisometropia was lower than 1.50 D in all subjects. All presbyopic subjects
                                  wore reading glasses, but they were spectacle-free for far distance. Presbyopia was pharmacologically simulated
                                  in young subjects by instillation of one drop of 1% tropicamide 15 min before the measurements, and then
                                  every hour. The accommodation amplitude (A.A.) in presbyopic subjects was measured using a Power Refrac-
                                  tor 2 (PlusOptix, Germany), and was 1.35 ± 0.33 D, on average. The subject profiles are shown in Table 1 with
                                  individual data of age, gender, sphero-cylindrical refraction, eye dominance and accommodation amplitude.

Scientific Reports |   (2021) 11:1397 |                 https://doi.org/10.1038/s41598-021-81059-0                                                 3

                                                                                                                                              Vol.:(0123456789)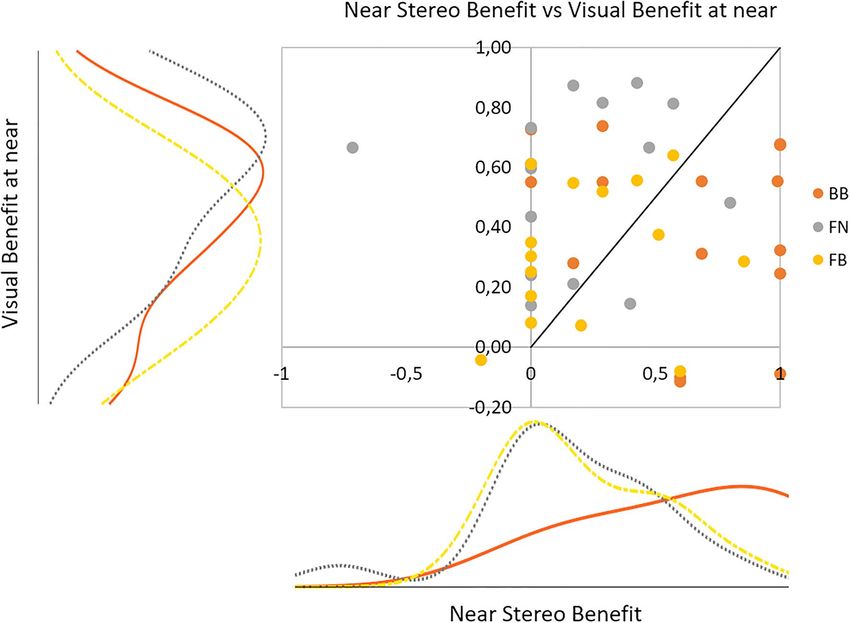
www.nature.com/scientificreports/
Experiments. All young subjects were measured both with CLs and SimVis. Presbyopic subjects only per-
formed measurements with SimVis. Subjects were divided in three different groups: (1) young subjects meas-
ured with SimVis; (2) young subjects measured with CLs; (3) presbyopic subjects measured with SimVis. The
experimental protocol was the same for all groups.
The experiments conformed to the tenets of the Declaration of Helsinki, with protocols approved by the
Consejo Superior de Investigaciones Cientificas Ethics Committee. The subjects signed an informed consent
after receiving an explanation of the nature and implications of the study.
Tested binocular presbyopic corrections. Four binocular presbyopic corrections were tested, both with
CLs and simulated using SimVis in young subjects, and SimVis in presbyopic subjects: (1) Monofocal far in
both eyes (FF); (2) Bifocal lenses in both eyes (BB); (3) Monovision (FN; dominant eye with monofocal far and
non-dominant eye with monofocal near); and (4) Modified Monovision (FB; dominant eye with monofocal far
and non-dominant eye with a bifocal lens). The near add in bifocal corrections was + 2.50 D, and the interocular
refraction difference was + 2.50 D in the monovision correction.
Contact lenses. In one experiment, patients wore monofocal and M-CLs (Biofinity, CooperVision, USA)28.
The lenses were silicone hydrogel (Comfilcon A) with standard geometry parameters (Base Curve: 8.6, Lens
diameter: 14.0) and monthly disposable. Distance power ranged from − 0.25 to − 5.00 D in both monofocal and
bifocal lenses. M-CLs had a central near add of + 2.50 D, with an aspheric front surface and a mono-curve back
surface.
CLs were fitted following the manufacturer’s guide and checked for lens damage under the slit-lamp before
proceeding with lens settling. Evaluation of the lens centration, primary gaze movement, upgaze movement,
and tightness was carried out following routinary standard practice29. CLs had a settling time of at least 4 min
before proceeding.
SimVis Gekko. A SimVis Gekko v0.5 visual simulator8,24,25 was used in this study. This wearable device has
the capability to simulate, in either eye, programmable multifocal corrections. In this study, we used generic
multifocal profiles with an energy distribution of 50% for far distance (0.00 D) and 50% for near distance (+ 2.50
D) programmed in the SimVis. The bifocal lens design was produced using a temporal multiplexing technique
24
. Trial lenses inserted in a dedicated slot in the system were used to correct the far distance refraction in the
multifocal designs (from − 1.00 D to + 4.50 D, in 0.25-diopter steps) and to replicate a monofocal correction.
The device was calibrated using a high-speed focimeter26 to measure both the optical power and the dynamic
effects of the optotunable lens. The lens was driven according to that calibration, including, for the simulation of
the bifocal lenses, the compensation of the dynamic effects m easured30. The calibration of the device was checked
weekly to guarantee the stability of the simulation throughout the study. It should be noted that the lens designs
used in this study correspond to generic monofocal and bifocal (pure simultaneous vision) designs, and do not
aim at reproducing the specific contact lens designs of “Contact lenses”.
Experimental protocol. The measurements were conducted by two experienced optometrists. Conven-
tional non-cyclopleged subjective refraction was obtained using Optonet Vision Unit (Optonet Ltd, United
Kingdom).
The patient’s sphero-cylindrical refraction was corrected with the spherical equivalent by the CLs power (in
the measurements with CLs) or by trial lenses placed in the dedicated slot in the SimVis device. Natural binocular
vision was tested using a 4-dot Worth test to discard fusion dysfunction, which was an exclusion criterion. Eye
dominance was determined by the + 1.50 D blur test.
A preparatory trial using SimVis allowed the subject to set the range for their perceptual scoring by viewing
the MAS-2EV far-day images through a simulated far-distance corrected monofocal lens (10 PS) and an addi-
tional + 2.50 D monofocal lens (0 PS).
Figure 2 illustrates and summarized the methodology followed in the study. The set of four presbyopic cor-
rections described in “Tested binocular presbyopic corrections” was tested first with the SimVis in the young
and presbyopic subjects, and then with CLs only in young subjects (in different sessions). Within each method,
corrections were tested following a preset random series.
For a given correction, the stereopsis at near was first tested (yielding a 0–10 score), according to the descrip-
tion in “Multifocal acceptance score to evaluate vision (MAS-2EV)”. Then MAS-2EV scorings were first obtained
for far-day and near-day. Patients were then allowed to settle into the night-time setting for 4 min, after which
MAS-2EV scorings were obtained for far-night and near-night.
A total of 1640 trials were conducted in young subjects (SimVis and CLs), and 820 trials in presbyopic subjects
(SimVis), corresponding to 4 corrections, 2 light conditions, 2 distances, each repeated 10 times, and 4 stereo
responses. A full MAS-2EV task takes 2 min to be completed per correction. Measurements were performed in
two different experimental sessions, lasting 5 h (SimVis) or 10 h (CLs).
Data analysis and visualization. MAS-2EV is graphically represented as a polygon, with the Perceptual
Scores (PS) in each vertex: the measured stereopsis (upper vertex) and the four PS measured for far-day, far-
night, near-day, and near-night (an example is shown in Fig. 2). The geometrical center of the polygon corre-
sponds to score 0 and the maximum separation of the vertex to score 10.
A metric of the overall visual quality with a specific correction is given by the unweighted average (MAS-2EV
Modulus) of the five vertices. Alternatively, the overall visual quality can be calculated as the normalized area
Scientific Reports | (2021) 11:1397 | https://doi.org/10.1038/s41598-021-81059-0 4
Vol:.(1234567890)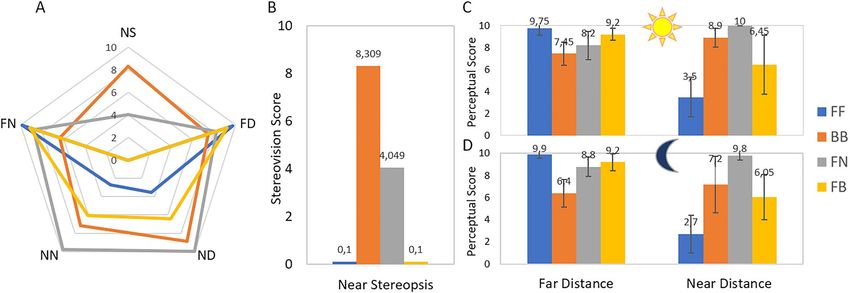
www.nature.com/scientificreports/

                                  Figure 2.  Illustration summarizing the methods, showing the subjects measured divided into three groups
                                  depending on the simulator/contact lens, the corrections tried by each group, and the measured conditions.
                                  Further explanations in "Subjects", "Experiments", "Tested binocular presbyopic corrections" and "Experimental
                                  protocol" (CC BY open access license, further details in Acknowledgments and Attributions section).

                                  enclosed by the MAS-2EV polygon (MAS-2EV Area), defined as: (area − area_min)/(area_max − area_min)
                                  where area is the area enclosed by the MAS-2EV polygon for a given subject and correction, area_max is the
                                  maximum area obtained across subjects and corrections, and the area_min the minimum area obtained across
                                  subjects and corrections.
                                      The visual imbalance across distances (near and far) for a given correction was obtained by subtracting the
                                  PS at near from the PS at far. Additionally, the overall visual imbalance across conditions (near/far, day/night,
                                  stereo) for a given correction was calculated as the standard deviation across all PS (normalized to the maximum)
                                  and represented the asymmetry of the MAS-2EV polygons.
                                      Metrics of visual compromise were also obtained from the MAS-2EV scores, in relation to the PS for the
                                  bilateral monofocal corrections (FF): (1) Visual degradation at far, defined as: (PS Far for each presbyopic correc-
                                  tion – PS Far FF)/PS Far FF; (2) Visual benefit at near, defined as: (PS Near for each presbyopic correction – PS Near
                                  FF)/PS Far FF; (3) Near stereo benefit is defined as: (Stereo with FF – Stereo for each presbyopic correction)/Best
                                  Near Stereo for that subject.
                                      The intra-subject repeatability was calculated as the mean of the standard deviation across repetitions for
                                  each subject. Inter-subject differences were calculated with the standard deviation of the MAS-2EV Modulus.
                                      Statistical analysis was performed in IBM SPSS Statistics v26 to (1) to analyze the statistical relevance of
                                  each variable (subject, correction, distance, and illumination) using a Mixed Model Analysis: Main effect and
                                  all two-way; (2) analyze the reliability and the consistency in the scoring criteria used by the subjects with an
                                  Alpha Cronbach; (3) analyze the significance of the difference between two variables across the same group using
                                  a Related-Samples Friedman’s 2-way ANOVA by Ranks with pairwise comparison-adjusted by the Bonferroni
                                  correction; (4) analyze the significance of a variable between groups using an Independent-Samples Kruskal–Wal-
                                  lis Test with pairwise comparison adjusted by Bonferroni correction; (5) analyze the repeatability of the metric
                                  using a Repeated Measures ANOVA analysis between factors.

                                  Results
                                   “Analysis of the variables and reliability of the metric” presents the statistical analysis and relevance of each vari-
                                  able, as well as the reliability of the metric. “MAS-2EV polygons, near stereopsis and perceptual scores” presents
                                  (1) an example of how to construct the MAS-2EV polygon that represents the ten perceptual score repetitions for
                                  each subject (Fig. 3); (2) all MAS-2EV polygons for all subjects (Fig. 4) showing differences across corrections and
                                  groups; (3) MAS-2EV Modulus and Areas averaged across subjects (Fig. 5) and; (4) a comparison between day
                                  and night conditions (Fig. 6). “Visual imbalance and compromise of different presbyopic corrections” presents:
                                  (1) visual imbalance for each correction (Fig. 7); (2) visual compromise across distances (Fig. 8); (3) near stereo
                                  benefit (Fig. 9); (4) overall visual imbalance and; (5) overall visual quality metrics (Tables 2 and 3). “Inter- and
                                  intrasubject variability” presents the MAS-2EV inter- and intra- subject variability. Finally, “Metric repeatability”
                                  shows the repeatability of the proposed metric.

Scientific Reports |   (2021) 11:1397 |                 https://doi.org/10.1038/s41598-021-81059-0                                                      5

                                                                                                                                                   Vol.:(0123456789)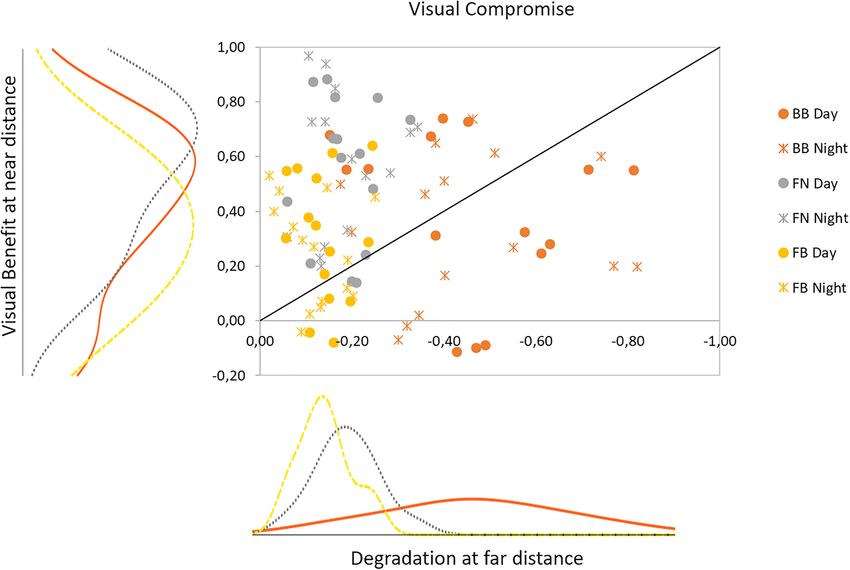
www.nature.com/scientificreports/

                                            Figure 3.  MAS-2EV polygons, near stereovision and perceptual scores for subject S1_SV, with presbyopic
                                            corrections simulated with SimVis. (A) MAS-2EV polygon. The upper vertices represent stereopsis score (NS),
                                            and the four lower vertices perceptual scores for far-day (FD), near-day (ND), near-night (NN) and far-night
                                            (FN) counter-clockwise. (B) Near stereovision scores. (C and D) Perceptual scores (PS) for far distance (left
                                            columns) and near distance (right columns), for day stimuli (upper graph) and night stimuli (lower graph)
                                            for the different corrections. In all graphs Blue stands for both eyes corrected for far (FF); Orange both eyes
                                            corrected with bifocal lenses (+ 2.50 D add, BB); Gray stands for monovision (monofocal for far distance in the
                                            dominant eye and + 2.50 D monofocal in the non-dominant eye, FN); Yellow stands for modified monovision
                                            (monofocal for far distance in the dominant eye and bifocal lens with + 2.50 D near add in the non-dominant
                                            eye, FB). Each data point is the average across 10 repeated measurements, and error bars represent standard
                                            deviations.

                                            Analysis of the variables and reliability of the metric. A Mixed Model Analysis (Dependent: PS;
                                            Fixed Factors: distance, light condition, correction; Random: Subject; Repeated: distance, light condition, cor-
                                            rection, repetition) reveals that all main effects were statistically significant (subject p < 10–10; correction p < 10–
                                            10
                                               ; distance p < 10–10; light condition p < 0.01) in all groups, and the two-way effects involving distance (near/far)
                                            were also significant (p < 0.05) in all groups.
                                                  The reliability and the consistency in the scoring criteria used by the subjects was high (Cronbach’s
                                            Alpha > 0.95 for each group, distance, and light condition).

                                            MAS‑2EV polygons, near stereopsis and perceptual scores. Figure 3 shows an example of MAS-
                                            2EV polygons (Fig. 3A), near stereovision (NS) scores (Fig. 3B), and individual perceptual scores (PS, Fig. 3C,D)
                                            in one subject (S01) for four presbyopic corrections (FF in blue, BB in orange, FN in grey, FB in yellow) simu-
                                            lated by SimVis. Data are averaged across ten repeated measurements. Figure 3C shows the average individual
                                            PS for far-day (Fig. 3C, left columns) and near-day (Fig. 3C, right columns) and far-night (Fig. 3D, left columns)
                                            and near-night (Fig. 3D, right columns). As expected, the FF correction (Monofocal far in both eyes; blue col-
                                            umns) provided better scores at far distance than at near distance (62.5%). For BB (bifocal lenses in both eyes;
                                            orange), the scores were 23% lower than FF, but similar at both distances (6.92 and 8.05, respectively). For FN
                                            (Monovision; gray) the scores were high at both distances (65% higher than FF for near). For FB (Modified
                                            monovision; yellow) the scores were higher for far distance than for near distance (27.5%), and more balanced
                                            across distances than with FF. Although the trends for day and night PS were similar, scores were on average
                                            4.25% higher for day than for night.
                                                Figure 4 shows the MAS-2EV polygons for all measured subjects and conditions: young subjects with SimVis
                                            (Fig. 4A, left column), young subjects with CLs (Fig. 4B, middle column) and presbyopic subjects with SimVis
                                            (Fig. 4C, right column).
                                                In all subjects, FF correction (blue line) provided the highest PS at far distance for day and night
                                            (PS = 9.38 ± 0.73), which was 75.27% on average higher than at near distance (PS = 2.32 ± 2.40). NS (near stereop-
                                            sis) with FF was low in almost all subjects (NS = 2.76 ± 2.96). Unlike FF, which produced similar polygons across
                                            subjects, BB bilateral correction (orange line) produced a larger inter-subject variability in the response (1.71
                                            PS). NS with BB correction (NS = 7.58 ± 0.72 PS) was 63.59% higher than with FF. The FN correction (grey line)
                                            provided good visual quality at near distance (PS = 7.64 ± 2.27) for all subjects except S2_SV and S3_SV, and in
                                            general, good quality at far distance (PS = 7.66 ± 0.87). However, FN seriously compromised NS (NS = 3.38 ± 2.87
                                            PS, on average) in 12 out of 15 subjects (except in S3_SV, S9_SV, and S10_SV, whose NS was not affected). The
                                            FB (yellow line) was nearly as good as FF for far (only 12.3% lower). However, FB was 26.4% higher than FF
                                            for near. FB compromised NS (NS = 4.28 ± 3.17 PS) in all subjects (except in S6_SV), although NS with FB was
                                            20.05% higher than FF and 11.87% higher than FN, but 43.54% lower than BB. Despite common trends across
                                            subjects, differences in both the shape and the area polygons between subjects suggest different responses to
                                            different corrections depending on the subject.

          Scientific Reports |   (2021) 11:1397 |                 https://doi.org/10.1038/s41598-021-81059-0                                                      6

Vol:.(1234567890)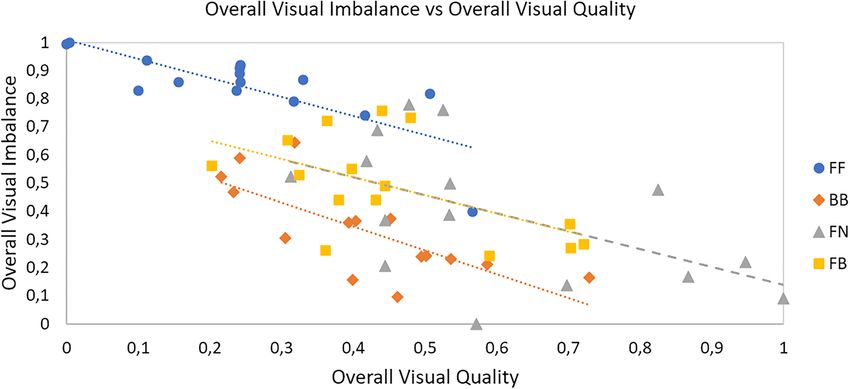
www.nature.com/scientificreports/

                                  Figure 4.  MAS-2EV polygons. (A) For young subjects measured with SimVis. (B) For young subjects measured
                                  with CLs. (C) For presbyopic subjects measured with SimVis. Blue line corresponds to bilateral monofocal
                                  correction for far (FF), orange line to bilateral bifocal (BB), gray line to monovision (FN), and yellow line to
                                  modified monovision (FB).

                                      An average metric for vision quality was calculated as the unweighted average (MAS-2EV Modulus, Fig. 5A)
                                  of the PS scores and the polygons normalized area (MAS-2EV Area, Fig. 5B). The similarity of the individual
                                  polygons for SimVis and CLs in most of the subjects indicates that SimVis captures similar trends as the real
                                  CLs, even if SimVis was not programmed to mimic the actual design of the lens.

Scientific Reports |   (2021) 11:1397 |               https://doi.org/10.1038/s41598-021-81059-0                                                7

                                                                                                                                           Vol.:(0123456789)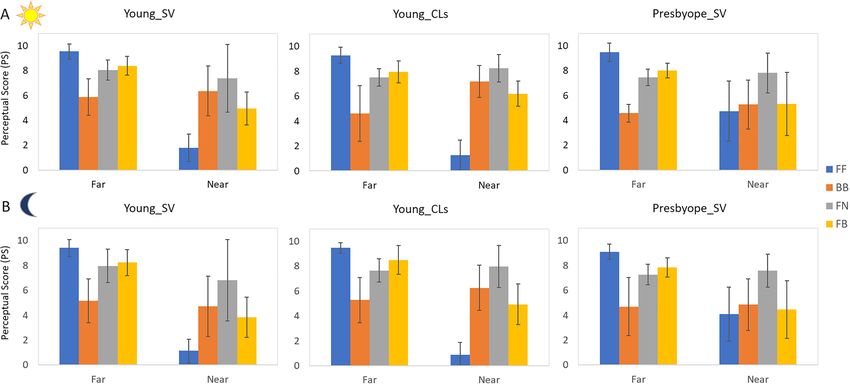
www.nature.com/scientificreports/

                                            Figure 5.  (A) MAS-2EV Modulus (average of the five polygon vertices: NS and the four PS averaged across
                                            subjects for each group), for all corrections. (B) MAS-2EV Area (normalized areas averaged across subjects for
                                            each group), for all corrections.

                                            Figure 6.  Mean PS across subjects for day (A, upper row), night (B, lower row) conditions, at far and near
                                            distances.

                                            Figure 7.  (A) Visual imbalance between distances (difference PS Far-PS Near) for each correction and group
                                            (averaged across light conditions and subjects). (B) Overall visual imbalance (normalized standard deviation in
                                            PS, averaged across subjects) for each for each correction and group.

          Scientific Reports |   (2021) 11:1397 |               https://doi.org/10.1038/s41598-021-81059-0                                                    8

Vol:.(1234567890)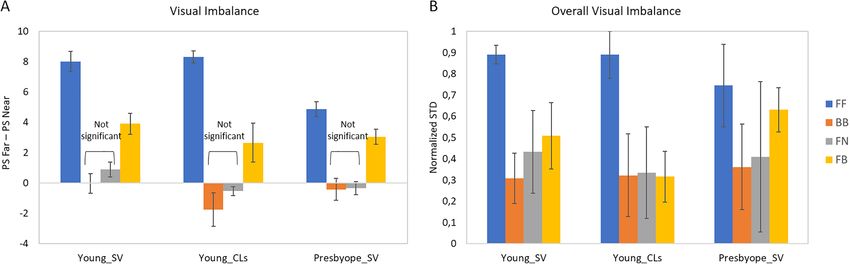
www.nature.com/scientificreports/

                                  Figure 8.  Visual compromise: visual degradation at far vs visual benefit at near, with respect to a bilateral
                                  monofocal correction (FF), for all presbyopic corrections (bilateral bifocal BB, monovision FN, modified
                                  monovision FB). Symbols represent each subject measured at day (spots) and night (asterisks) conditions. The
                                  histograms show the distribution of the data for each axis.

                                  Figure 9.  Near stereo benefit as a function of Visual Benefit at near for each presbyopic correction. The
                                  histograms show the distribution for each axis.

Scientific Reports |   (2021) 11:1397 |                https://doi.org/10.1038/s41598-021-81059-0                                                   9

                                                                                                                                               Vol.:(0123456789)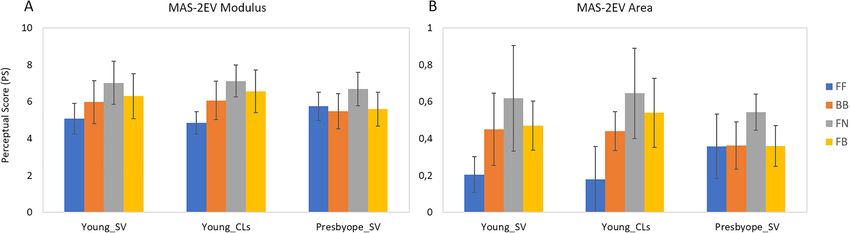
www.nature.com/scientificreports/
− Overall visual Overall performance
Subject Correction Degradation @Far Benefit @Near Benefit stereo imbalance Overall visual quality parameter Ranking
FF 0.00 0.00 0.00 − 0.91 0.24 − 0.67 4
BB − 0.30 0.51 0.99 − 0.16 0.73 1.77 ①
S1_SV
FN − 0.14 0.70 0.48 − 0.48 0.82 1.38 2
FB − 0.06 0.32 0.00 − 0.76 0.44 − 0.06 3
FF 0.00 0.00 0.00 − 0.83 0.10 − 0.73 4
BB − 0.19 0.44 0.68 − 0.37 0.45 1.01 ①
S2_SV
FN − 0.06 0.37 0.00 − 0.52 0.31 0.1 3
FB − 0.11 0.32 0.51 − 0.44 0.38 0.66 2
FF 0.00 0.00 0.00 − 0.87 0.33 − 0.54 4
BB − 0.70 0.24 0.17 − 0.47 0.23 − 0.53 3
S3_SV
FN − 0.13 0.24 0.17 − 0.50 0.53 0.31 ①
FB − 0.17 0.15 0 − 0.55 0.40 − 0.17 2
FF 0 0 0 − 0.92 0.24 − 0.68 4
BB − 0.46 0.73 0 − 0.23 0.54 0.58 3
S4_SV
FN − 0.11 0.92 0.17 − 0.09 1.00 1.89 ①
FB − 0.05 0.51 0.17 − 0.35 0.70 0.98 2
FF 0 0 0 − 0.94 0.11 − 0.83 4
BB − 0.39 0.24 0.68 − 0.30 0.30 0.53 2
S5_SV
FN − 0.33 0.71 0 − 0.58 0.42 0.22 3
FB − 0.21 0.25 0.85 − 0.44 0.43 0.88 ①
FF 0 0 0 − 0.79 0.32 − 0.47 4
BB − 0.39 − 0.09 0.60 − 0.59 0.24 − 0.23 3
S6_SV
FN − 0.21 0.29 0 − 0.37 0.44 0.15 ①
FB − 0.13 − 0.06 0.60 − 0.72 0.36 0.05 2
FF 0 0 0 − 0.86 0.24 − 0.62 4
BB − 0.56 0.30 1.00 − 0.36 0.40 0.78 ①
S7_SV
FN − 0.23 0.57 0 − 0.78 0.48 0.04 2
FB − 0.18 0.17 0 − 0.65 0.31 − 0.35 3
FF 0 0 0 − 0.82 0.51 − 0.31 4
BB − 0.42 − 0.04 1.00 − 0.10 0.46 0.9 ①
S8_SV
FN − 0.17 0.19 0 − 0.76 0.53 − 0.21 2
FB − 0.14 0.08 0 − 0.73 0.48 − 0.31 3
FF 0 0 0 − 0.86 0.16 − 0.7 4
BB − 0.72 0.22 1.00 − 0.52 0.22 0.2 2
S9_SV
FN − 0.24 0.51 0.80 − 0.00 0.57 1.64 ①
FB − 0.16 0.06 0.20 − 0.56 0.20 − 0.1 3
FF 0 0 0 − 0.40 0.57 0.17 3
BB − 0.37 − 0.07 0.60 − 0.24 0.50 0.42 2
S10_SV
FN − 0.17 0.17 0.40 − 0.14 0.70 0.96 ①
FB − 0.11 − 0.01 − 0.20 − 0.49 0.44 − 0.37 4
Table 2. Individual data of visual degradation at far distance, visual benefit at near distance, near stereo
benefit, overall visual imbalance (negative), overall visual quality, overall performance parameter and ranking.
Corrections in bold indicate acceptable overall performance. Circled correction ① indicates the highest
ranking. Data correspond to measurements performed with SimVis.
Both in young and presbyopic subjects, the FN correction produced the best overall visual quality (highest
MAS-2EV Modulus and Area). The FF correction produced a significantly lower MAS-2EV Modulus (p < 0.03;
paired-sample t-test) than FN and FB in young subjects, but not in presbyopic subjects. The difference between
the best and the worst correction was FN-FF = 1.94 ± 1.00 for the young group with SimVis, FN-FF = 2.26 ± 0.74
for the young group with CLs, and FN-BB = 1.21 ± 0.93 for presbyopes. The overall visual quality (MAS-2EV
Area) was lowest for FF (0.25 ± 0.16), followed by BB (0.42 ± 0.14), FB (0.46 ± 0.16) and highest (with higher
STD) for FN (0.60 ± 0.21).
Figure 6 shows the mean PS across subjects and distances, itemized by group, far/near and day/night condi-
tions. For each group, FF correction was statistically significantly different than BB at far distance both at day
and night condition (p = 0.001; Related-Samples Friedman’s 2-way ANOVA by Ranks with pairwise comparison-
adjusted by the Bonferroni correction). However, FF was statistically significantly different than BB at near
Scientific Reports | (2021) 11:1397 | https://doi.org/10.1038/s41598-021-81059-0 10
Vol:.(1234567890)www.nature.com/scientificreports/
Overall performance
Subject Correction Degradation @Far Benefit @Near Benefit stereo − Overall visual imbalance Overall visual quality parameter Ranking
FF 0 0 0 − 0.74 0.42 − 0.32 3
BB − 0.78 0.58 0 − 0.64 0.32 − 0.52 4
S1_CL
FN − 0.18 0.67 0 − 0.17 0.87 1.19 ①
FB − 0.08 0.37 0 − 0.27 0.70 0.72 2
FF 0 0 0 − 0.99 0.00 − 0.99 4
BB − 0.16 0.59 1.00 − 0.24 0.50 1.69 ①
S2_CL
FN − 0.15 0.87 0.43 − 0.39 0.53 1.29 2
FB − 0.09 0.43 0.43 − 0.53 0.32 0.56 3
FF 0 0 0 − 0.89 0.24 − 0.65 4
BB − 0.61 0.58 0.29 − 0.36 0.39 0.29 3
S3_CL
FN − 0.15 0.88 0.29 − 0.22 0.95 1.75 ①
FB − 0.07 0.53 0.29 − 0.28 0.72 1.19 2
FF 0 0 0 − 0.83 0.24 − 0.59 4
BB − 0.39 0.69 0.29 − 0.21 0.59 0.97 ①
S4_CL
FN − 0.18 0.63 − 0.71 − 0.69 0.43 − 0.52 3
FB − 0.15 0.55 0.00 − 0.24 0.59 0.75 2
FF 0 0 0 − 1.00 0.00 −1 4
BB − 0.39 0.59 1.00 − 0.16 0.40 1.44 ①
S5_CL
FN − 0.30 0.76 0.57 − 0.21 0.44 1.26 2
FB − 0.25 0.55 0.57 − 0.26 0.36 0.97 3
Table 3. Individual data of visual degradation at far distance, visual benefit at near distance, near stereo
benefit, overall visual imbalance (negative), overall visual quality, overall performance parameter and ranking.
Corrections in bold indicate acceptable overall performance. Circled correction ① indicates the highest
ranking. Data correspond to measurements performed with CLs.
distance (both at day and night condition) only for young subjects, both with SimVis (p = 0.02; Related-Samples
Friedman’s 2-way ANOVA by Ranks with pairwise comparison-adjusted by the Bonferroni correction) and
CLs (p = 0.042; same test). Very consistently, PS for FF at near was lower in young (by 71.27%, p < 0.04 -for both
illuminations-; Independent-Samples Kruskall-Wallis with pairwise comparison adjusted by Bonferroni correc-
tion) than in presbyopic subjects. PS were almost identical for day and night (the average PS difference across
distances, corrections and subjects was 0.32).
Visual imbalance and compromise of different presbyopic corrections. Figure 7A shows the vis-
ual imbalance across distances, calculated as far-near PS difference (averaged across subjects and day/night con-
ditions), for each correction. FF and FB corrections provided statistically significant imbalances between far and
near distances in all groups (p < 0.005; paired-sample t-test), although those were significantly lower for presby-
opes than for young subjects. The lowest far-near imbalances (not statistically different from zero) occurred in all
subjects for BB and FN. On average, the largest overall visual imbalance (Fig. 7B) was found for FF (0.84 ± 0.12)
followed by FB (0.48 ± 0.13) and FN (0.39 ± 0.25), with the lowest visual imbalance found for BB (0.33 ± 0.17).
Figure 8 shows the visual compromise (degradation at far distance versus visual benefit at near distance) for
each correction and each subject. The ideal correction will lie in the (0, 1) coordinate, i.e. low degradation at far
and high benefit at near. Points above the -1:1 line are indicative of a positive compromise (more benefit at near
than degradation at far).
Out of the 30 evaluations (3 groups × 5 subjects × 2 light conditions) per correction represented in Fig. 8, 28
showed a positive compromise for FN, 20 for FB and 13 for BB. Figure 8 also shows histograms representing the
distribution of degradation at far (horizontal axis) and benefit at near (vertical axis) for the three presbyopic cor-
rections. FN produced the highest benefit at near distance across subjects and light conditions (56.38 ± 25.79%;
with a peak at of the histogram at 0.69); followed by BB (36.79 ± 27.60%; peak at 0.57), and by FB (28.10 ± 20.89%;
peak at 0.33). The degradation at far distance was lowest for FB (− 12.03 ± 5.71%; peak at − 0.14); followed by FN
(− 18.26 ± 7.00%; peak at − 0.19); and it was highest for BB (− 45.51 ± 18.38%; peak at − 0.47).
An important aspect not reflected in visual quality at near and far distances is the stereo vision, the fifth
parameter in the MAS-2EV metric. Figure 9 shows the near stereo benefit as a function of visual benefit at
near, for all subjects and presbyopic corrections. The ideal correction will have both high near vision and near
stereo benefits. We found the largest near stereo benefit for BB (61.92 ± 38.31%; peak at 0.84, followed by FB
(22.80 ± 30.12%; peak at 0.02) and FN (17.23 ± 35.21%; peak at 0.04). On average across subjects, near stereo
benefit for BB was 0.45 ± 0.38 higher than near stereo benefit for FN, and 0.39 ± 0.42 higher than near stereo
benefit for FB, indicating that in most subjects BB provided the best stereo near vision, which on the other hand
was compromised in FB and FN.
Figure 10 shows the MAS-2EV overall visual imbalance (polygon asymmetry) as a function of overall visual
quality (MAS-2EV Area). For all corrections there was a significant negative correlation between overall visual
Scientific Reports | (2021) 11:1397 | https://doi.org/10.1038/s41598-021-81059-0 11
Vol.:(0123456789)www.nature.com/scientificreports/
Figure 10. Overall visual imbalance (MAS-2EV polygon asymmetry) vs overall visual quality (MAS-2EV
Area), for all tested corrections (far-far; bifocal-bifocal; far-near and far-bifocal).
imbalance and overall visual quality (r = -0.78; p = 0.0005 for FF; r = -0.74; p = 0.002 for BB; r = -0.54; p = 0.04 for
FN and r = -0.56; p = 0.03 for FB), indicating that overall quality increases as visual imbalance decreases.
Figures 3, 4, 5, 6, 7, 8, 9 and 10 allow visualizing overall trends with the different corrections and their average
performance. However, the parameters at the individual level may have an important predictive power to aid in
the selection of a correction or discard corrections not suitable for a patient. Table 2 (for SimVis) and Table 3 (for
Contact Lenses) show the ranking of corrections based on the combination (addition) of all parameters: visual
degradation at far, visual benefit at near, near stereo benefit, visual imbalance (multiplied by − 1) and overall
visual quality (MAS-2EV Area). The corrections marked in bold meet the threshold (0) in the overall perfor-
mance parameter. The circled number indicates the correction ranked as best for each subject. In 40% subjects
with SimVis and 60% subjects with CLs the BB was ranked 1, in 50% (SimVis)/40% (CLs) FN was ranked as 1,
and 10% (SimVis)/0% (CLs) FB was ranked as 1.
Inter‑ and intrasubject variability. MAS-2EV was highly repetitive across the ten repetitions of each
measurement. The intra-subject repeatability of the scoring was consistent in all subjects, with an average stand-
ard deviation of 0.97 PS. The standard deviation across repetitions (intra-subject variability) was similar in the
different groups (young 1.00 PS; presbyope 0.91 PS), light condition (day 0.99 PS; night 0.93 PS), corrections (FF
0.73 PS; BB 1.05 PS; FN 0.98 PS; FB 1.09 PS) and distances (far 0.78 PS; near 1.14 PS).
However, the inter-subject variability was significantly higher (p < 0.02, paired-sample t-test) for near distance
(2.74 PS) than for far distance (1.92), being the difference across distances much higher in young (1.05 PS) than in
presbyopic subjects (0.34 PS). Across all subjects, BB at far showed the highest inter-subject variability (1.71 PS).
Metric repeatability. Given the high repeatability of the responses (Alpha Cronbach’s factor 0.95), we stud-
ied the theoretical minimum number of repetitions of a MAS-2EV test that would provide reliable information
on the perceived quality of a given correction, and to establish a ranking of corrections. A Repeated Measures
ANOVA analysis between factors (for a medium effect size of 0.25) estimated that 3 repetitions provides enough
statistical power to show significant differences in perceived quality, influenced by the fixed factors (correction,
distance, and light condition). However, a parametric approximation would entail a higher number of subjects
per group.
Discussion
We have presented a new visual metric (MAS-2EV) that captures the multidimensionality of vision, measur-
ing the perceptual quality at different distances, light conditions and stereo. Instead of relying on visual acuity
charts or contrast sensitivity targets, judgments of the quality of vision are made on a total of 12 natural images
representing habitual visual scenes that the patient can recognize, and that are relevant to his/her daily visual
tasks. The test fulfills time requirements in clinical practice both regarding materials (only requires a monitor
to display the images at distance and a tablet for images at near, and two LEDs to couple with the night scene),
room dimensions (being compatible with the settings of other visual tests) and time of application (evaluation
of each correction takes 3 min). The metric has proved repetitive (only 3 repetitions needed to obtain sufficient
sensitivity) and provides multiple parameters (including, visual degradation at far, visual benefit at near, near
stereo benefit, visual imbalance and overall visual quality) onto which the selection of a correction can be based.
The metric is particularly suitable to evaluate and compare multiple presbyopic corrections on the same patients.
In the current study, four binocular presbyopic corrections (bilateral monofocal corrections at far, monovision,
modified monovision and bilateral bifocal corrections) were evaluated using the MAS-2EV.
Scientific Reports | (2021) 11:1397 | https://doi.org/10.1038/s41598-021-81059-0 12
Vol:.(1234567890)www.nature.com/scientificreports/
The study was conducted on cyclopleged young subjects (i.e. with simulated presbyopia) and a presbyopic
group. While presbyopes are the natural users of presbyopic corrections, multifocal corrections have been pro-
posed for myopia control in young p atients31. In this study, we paralyzed accommodation in the young group,
although a similar study could be envisioned for this group also under natural conditions as a way to study vision
with these lenses prior to their prescription. Interestingly, on average across groups, we found similar percep-
tual scores for the same presbyopic corrections and conditions between young and presbyopic subjects (see for
example Fig. 5). Only the perceptual scores for the FF correction at near distance were significantly higher in the
presbyopic subjects than in the young subjects. This may indicate a higher tolerance to blur at near in presbyopic
subjects, likely as a result of neural a daptation6. Consequently, the imbalance of far and near vision for FF was
significantly higher in young subjects than presbyopes (Fig. 7).
Perceptual scores between day and night conditions (Fig. 6) were small (0.32 PS) but statistically significantly
in all groups (p < 0.01). This effect is likely due to the influence of the pupillary dynamics in the study design.
On the one hand, measurements in young subjects were performed with a dilated pupil (therefore not reacting
to light and potential differences in vergence). On the other hand, the simulations with SimVis were performed
for a fixed pupil diameter of 4 mm in all conditions.
MAS-2EV allows a comparison of different presbyopic corrections, including multiple parameters (Figs. 8,
9, 10), and to perform that comparison of the performance of each correction for each subject (Tables 2 and 3).
While visual benefit at near was highest for monovision (FN), the inclusion of other parameters such as stereo
vision, visual imbalance, and overall quality (MAS-2EV polygon area), increased the value of bifocal correc-
tions (BB). At the individual level, BB resulted the first option in 46.67% of the subjects, FN the first option in
46.67%, and FB in 6.67%.
MAS-2EV allows the evaluation of the visual quality of the real visual world, making it closer to the infor-
mation collected in the quality of vision q uestionnaires13. However, to date, typical questionnaires are passed
after contact lenses are prescribed or after intraocular lens or corneal surgery, and rely, to a large extent, on the
patient’s memory, particularly on evaluations of their current quality of vision in comparison with their previ-
ous corrections (i.e. monofocal contact lenses or pre-operatively). The value of the MAS-2EV metric presented
here is that it is defined to be performed before final prescription, and allows in situ comparison of prospective
corrections, while still experiencing a realistic environment which samples different situations of the patient’s
visual world (faces, street scenes, theater, driving, navigating a map, reading, halos at night, and stereo tasks).
A goal with the MAS-2EV metric is to aid in the selection of the most suitable correction for a patient. In
the current study, the ranking, and hence the optimal correction, is based on a simple addition of parameters,
which are blind to the patient lifestyle or preferences. It is conceivable to weight the retrieved parameters with
factors accounting for the importance of time spent by the patients on near, far, daytime or nighttime activities,
requiring stereovision or benefiting from constant visual quality. The information from these weights could be
extracted, from lifestyle questionnaires or devices attached to the patient that measure light exposure and work
distance over a period of time32.
The MAS-2EV metric has been applied in patients both wearing real contact lenses (monofocal and multifo-
cal, and their combinations) and the Simultaneous Vision Simulator (SimVis Gekko by 2EyesVision) represent-
ing monofocal and bifocal contact lenses. The simulation of the exact design of the real contact lens was not
attempted. Even with this approximation, the visual experience of the patient with SimVis with all corrections
(bilateral far monofocal, bilateral bifocal, monovision and modified monovision) captures to a large extent that
provided by similar corrections in the contact lens form, as revealed by the similarity of the MAS-2EV–based
parameters obtained with SimVis and contact lenses (Figs. 5, 6). At the individual level (Tables 2, 3) the exact
ranking of corrections obtained with SimVis was only strictly the same as with CLs in one subject, although the
acceptable corrections (overall performance parameter) were captured similarly by SimVis and by CLs in 70% of
the cases. In the young group, where the study was performed with CLs and SimVis, performing the MAS-2EV
study with 4 contact-lens based conditions to 2–3 times longer than performing the MAS-2EV with 4 SimVis-
simulated conditions (369 vs 164 min per session), as the former requires interchanging of the contact lenses
while the latter passes rapidly across the programmed corrections. Similarly, SimVis + MAS-2EV can be used
to guide the selection of presbyopic corrections in intraocular lens form, allowing the patient to experience the
world with those corrections before implantation. The use of the MAS-2EV metric in combination with visual
simulators, such as the SimVis Gekko, therefore serves to reduce chair time in contact lens fitting as well as to
reduce uncertainties in intraocular lens surgeries.
In conclusion, MAS-2EV is a suitable metric for its use in the clinic due to its high repeatability, high sensitiv-
ity, and short administration time (3 min for subject/condition/correction). Also, the images were designed to
be presented in standard displays (or projectors). Further studies are currently underway, including a compari-
son between MAS-2EV and validated visual quality questionnaires18,33, evaluation of the MAS-2EV metric in
cataractous patients, evaluation of the sensitivity of the metric in a larger population, evaluation of the metric
in patients with other visual limitations and pathologies, study of the effect of pupillary dynamics (in particular,
its impact on differences between perceptual scores at near and far) and a direct comparison of perceived visual
quality with real contact lenses and their specific programmed design in the visual simulator using MAS-2EV.
Received: 29 April 2020; Accepted: 4 January 2021
References
1. Charman, W. N. The eye in focus: Accommodation and presbyopia. Clin. Exp. Optom. https : //doi.org/10.111
1/j.1444-0938.2008.00256.x (2008).
2. Evans, B. J. W. Monovision: A review. Ophthal. Physiol. Opt. https://doi.org/10.1111/j.1475-1313.2007.00488.x (2007).
Scientific Reports | (2021) 11:1397 | https://doi.org/10.1038/s41598-021-81059-0 13
Vol.:(0123456789)www.nature.com/scientificreports/
3. Charman, W. N. Developments in the correction of presbyopia I: Spectacle and contact lenses. Ophthal. Physiol. Opt. https://doi.
org/10.1111/opo.12091(2014).
4. Charman, W. N. Developments in the correction of presbyopia II: Surgical approaches. Ophthal. Physiol. Opt. https://doi.
org/10.1111/opo.12129(2014).
5. Pérez-Prados, R., Piñero, D. P., Pérez-Cambrodí, R. J. & Madrid-Costa, D. Soft multifocal simultaneous image contact lenses: A
review. Clin. Exp. Opt. https://doi.org/10.1111/cxo.12488 (2017).
6. Radhakrishnan, A., Dorronsoro, C., Sawides, L. & Marcos, S. Short-term neural adaptation to simultaneous bifocal images. PLoS
ONE https://doi.org/10.1371/journal.pone.0093089 (2014).
7. Vinas, M. et al. Visual simulators replicate vision with multifocal lenses. Sci. Rep. https://doi.org/10.1038/s41598-019-38673-w
(2019).
8. Vinas, M. et al. Pre-operative simulation of post-operative multifocal vision. Biomed. Opt. Express https://doi.org/10.1364/
boe.10.005801 (2019).
9. Pedrotti, E. et al. Comparative analysis of visual outcomes with 4 intraocular lenses: Monofocal, multifocal, and extended range
of vision. J. Cataract Refract. Surg. https://doi.org/10.1016/j.jcrs.2017.11.011 (2018).
10. Sheppard, A. L., Shah, S., Bhatt, U., Bhogal, G. & Wolffsohn, J. S. Visual outcomes and subjective experience after bilateral implan-
tation of a new diffractive trifocal intraocular lens. J. Cataract Refract. Surg. https://doi.org/10.1016/j.jcrs.2012.09.017 (2013).
11. Gil, M. A., Varon, C., Rosello, N., Cardona, G. & Buil, J. A. Visual acuity, contrast sensitivity, subjective quality of vision, and quality
of life with 4 different multifocal IOLs. Eur. J. Ophthalmol. https://doi.org/10.5301/EJO.2011.8371 (2012).
12. McAlinden, C., Pesudovs, K. & Moore, J. E. The development of an instrument to measure quality of vision: The quality of vision
(QoV) questionnaire. Investig. Ophthalmol. Vis. Sci. https://doi.org/10.1167/iovs.10-5341 (2010).
13. Grzybowski, A., Kanclerz, P. & Muzyka-Woźniak, M. Methods for evaluating quality of life and vision in patients undergoing lens
refractive surgery. Graefe’s Arch. Clin. Exp. Ophthal. https://doi.org/10.1007/s00417-019-04270-w (2019).
14. Hays, R. D. et al. Psychometric properties of the national eye institute-refractive error quality of life instrument. Ophthalmology
https://doi.org/10.1016/j.ophtha.2002.07.001 (2003).
15. Atkinson, M. J., Tally, S., Heichel, C. W. & Kozak, I. PSS34 qualitative grounding for a new patient assessment measure in ophthal-
mology: The functional assessment of visual tasks (Vistas). Value Heal. https://doi.org/10.1016/j.jval.2011.08.1499 (2011).
16. Atkinson, M. J., Tally, S., Kozak, I., Heichel, C. W. & Kulischak, J. PSS35 validation of the eighteen item functional assessment of
visual tasks (Vistas-18) using a new lens prescription methodology. Value Heal. https://doi.org/10.1016/j.jval.2011.08.1500 (2011).
17. Lundström, M. & Pesudovs, K. Catquest-9SF patient outcomes questionnaire. Nine-item short-form Rasch-scaled revision of the
Catquest questionnaire. J. Cataract Refract. Surg. (2009) doi:https://doi.org/10.1016/j.jcrs.2008.11.038.
18. Wirth, R. J. et al. Development of the contact lens user experience: CLUE scales. Optom. Vis. Sci. https: //doi.org/10.1097/OPX.00000
00000000913 (2016).
19. McAlinden, C., Skiadaresi, E., Moore, J. & Pesudovs, K. Subscale assessment of the NEI-RQL-42 questionnaire with rasch analysis.
Investig. Ophthalmol. Vis. Sci. https://doi.org/10.1167/iovs.10-67951 (2011).
20. Vinas, M. et al. Testing vision with angular and radial multifocal designs using Adaptive Optics. Vis. Res. https://doi.org/10.1016/j.
visres.2016.04.011 (2017).
21. Vinas, M. et al. Comparison of vision through surface modulated and spatial light modulated multifocal optics. Biomed. Opt.
Express https://doi.org/10.1364/boe.8.002055 (2017).
22. Manzanera, S., Prieto, P. M., Ayala, D. B., Lindacher, J. M. & Artal, P. Liquid crystal adaptive optics visual simulator: Application
to testing and design of ophthalmic optical elements. Opt. Express https://doi.org/10.1364/oe.15.016177 (2007).
23. Zheleznyak, L., Kim, M. J., MacRae, S. & Yoon, G. Impact of corneal aberrations on through-focus image quality of presbyopia-cor-
recting intraocular lenses using an adaptive optics bench system. J. Cataract Refract. Surg. https: //doi.org/10.1016/j.jcrs.2012.05.032
(2012).
24. Dorronsoro, C. et al. Portable simultaneous vision device to simulate multifocal corrections. Optica https://doi.org/10.1364/optic
a.3.000918 (2016).
25. Dorronsoro, C., Alonso-Sanz, J. R. & Marcos, S. Miniature simultaneous vision simulator instrument.
26. Dorronsoro, C. et al. Tunable lenses: Dynamic characterization and fine-tuned control for high-speed applications. Opt. Express
https://doi.org/10.1364/oe.27.002085 (2019).
27. Akondi, V., Dorronsoro, C., Gambra, E. & Marcos, S. Temporal multiplexing to simulate multifocal intraocular lenses: Theoretical
considerations. Biomed. Opt. Express https://doi.org/10.1364/boe.8.003410 (2017).
28. Kim, E., Bakaraju, R. C. & Ehrmann, K. Power profiles of commercial multifocal soft contact lenses. Optom. Vis. Sci. https://doi.
org/10.1097/OPX.0000000000000998 (2017).
29. Nathan, E. Contact Lens Practice: 3rd edition. (Elsevier, 2017).
30. Akondi, V. et al. Experimental validations of a tunable-lens-based visual demonstrator of multifocal corrections. Biomed. Opt.
Express https://doi.org/10.1364/boe.9.006302 (2018).
31. Aller, T. A., Liu, M. & Wildsoet, C. F. Myopia control with bifocal contact lenses: A randomized clinical trial. Optom. Vis. Sci. https
://doi.org/10.1097/OPX.0000000000000808 (2016).
32. Pajic, B., Zakharov, P., Pajic-Eggspuehler, B. & Cvejic, Z. User friendliness of awearable visual behavior monitor for cataract and
refractive surgery. Appl. Sci. https://doi.org/10.3390/app10062190 (2020).
33. Barcala, X. et al. Comparison of vision with multifocal contact lenses and SimVis Gekko simulations in a clinical site. Invest.
Ophthalmol. Vis. Sci. 61, 579–579 (2020).
Acknowledgements
Authors want to thank Laura Barrios from the Scientific Calculus Center of the Spanish National Research
Council (CSIC) for help with the statistical analysis within the study. Thanks to Chris McAndrews for the por-
trait from Fig. 1A (Creative Commons Attribution 3.0 Unported license); Catarina Barcala for the map from
Fig. 1D; Freepik for the poster of Fig. 1A; Jean Beaufort for the Moulin Rouge picture (Fig. 1B); Pixabay for the
street scene from Fig. 1A, the dancer from Fig. 1B, icons from the screenshot of Fig. 1C, and speedometer from
Fig. 1D; all of them with Creative Commons 0 Public Domain license. Thanks to Irina Mir for the cartoon people
from Fig. 2 posted in Adobe Stock with Standard License.
Author contributions
X.B., M.V., E.G., S.M. and C.D. conceived the ideas behind the MAS-2EV metric and designed the experiment.
X.B. conducted the experiments. M.R. and J.L.M-G. helped in the preparation of the experiments. X.B., M.V.,
S.M. and C.D. contributed to the data interpretation. X.B. and S.M. wrote the manuscript. All authors discussed
the results and contributed to the final manuscript.
Scientific Reports | (2021) 11:1397 | https://doi.org/10.1038/s41598-021-81059-0 14
Vol:.(1234567890)www.nature.com/scientificreports/
Funding
European Research Council (ERC-2011-AdC 294099 to SM); Spanish Government (FIS2017-84753R to SM,
ISCIII DTS16/00127 to CD, DI-15-07753 to JLM, PTQ-15-07432 to EG, PTA2017-13787-I to MR), and Madrid
Regional Government (IND2017/BMD-7670 to XB).
Competing interests
C.D. and S.M. are inventors of patents protecting the SimVis technology (PCT/ES2010/070218; PCT/
ES2014/070725; PCT/ES2016/070673); C.D., S.M., E.G. and M.V. are co-founder and have personal financial
interest in the company 2EyesVision; E.G. and X.B. are employees of 2Eyes Vision. All other authors declare no
competing interests.
Additional information
Correspondence and requests for materials should be addressed to X.B.
Reprints and permissions information is available at www.nature.com/reprints.
Publisher’s note Springer Nature remains neutral with regard to jurisdictional claims in published maps and
institutional affiliations.
Open Access This article is licensed under a Creative Commons Attribution 4.0 International
License, which permits use, sharing, adaptation, distribution and reproduction in any medium or
format, as long as you give appropriate credit to the original author(s) and the source, provide a link to the
Creative Commons licence, and indicate if changes were made. The images or other third party material in this
article are included in the article’s Creative Commons licence, unless indicated otherwise in a credit line to the
material. If material is not included in the article’s Creative Commons licence and your intended use is not
permitted by statutory regulation or exceeds the permitted use, you will need to obtain permission directly from
the copyright holder. To view a copy of this licence, visit http://creativecommons.org/licenses/by/4.0/.
© The Author(s) 2021
Scientific Reports | (2021) 11:1397 | https://doi.org/10.1038/s41598-021-81059-0 15
Vol.:(0123456789)You can also read