Thinning Response and Potential Basal Area in a Mixed Sub-humid Low-elevation Oak-Hornbeam Forest
←
→
Page content transcription
If your browser does not render page correctly, please read the page content below
Thinning Response and Potential Basal Area in a
Mixed Sub-humid Low-elevation Oak-Hornbeam
Forest
Mathias Neumann ( mathias.neumann@boku.ac.at )
University of Natural Resources and Life Sciences Vienna: Universitat fur Bodenkultur Wien
https://orcid.org/0000-0003-2472-943X
Hubert Hasenauer
University of Natural Resources and Life Sciences Vienna: Universitat fur Bodenkultur Wien
Research
Keywords: Quercus petraea, Carpinus betulus, abandoned forest management, conservation, biodiversity,
tree growth
DOI: https://doi.org/10.21203/rs.3.rs-698917/v1
License: This work is licensed under a Creative Commons Attribution 4.0 International License.
Read Full License
Page 1/19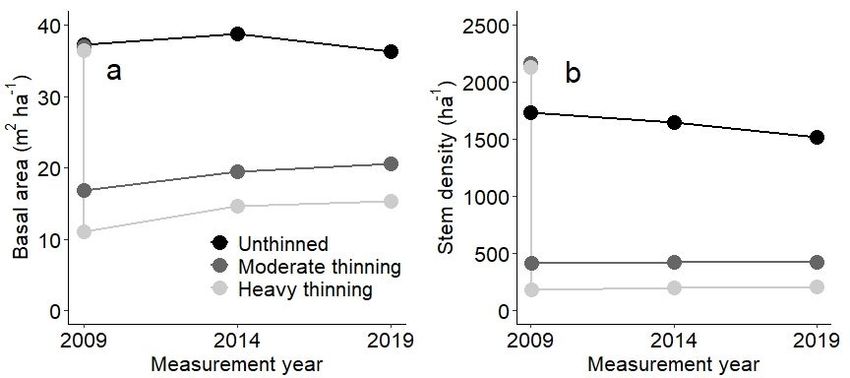
Abstract
Competition for resources (light, water, nutrients, etc.) limits the size and abundance of alive trees a site
can support. This carrying capacity determines the potential carbon sequestration in alive trees as well as
the maximum growing stock. Lower stocking through thinning can change growth and mortality. We were
interested in the relations between stand structure, increment and mortality using a long-unmanaged oak-
hornbeam forest near Vienna, Austria, as case study. We expected lower increment for heavy thinned
compared to unmanaged stands. We tested the thinning response using three permanent growth plots,
whereas two were thinned (50% and 70% basal area removed) and one remained unmanaged. We
calculated stand structure (basal area, stem density, diameter distribution) and increment and mortality
of single trees. The heavy thinned stand had over ten years similar increment as the moderate thinned
and unthinned stands. Basal area of the unthinned stand remained constant and stem density decreased
due to competition-related mortality. The studied oak-hornbeam stands responded well even to late and
heavy thinning suggesting a broad “plateau” of stocking and increment for these forest types. Lower
stem density for thinned stands lead to much larger tree increment of single trees, compared to the
unthinned reference. The findings of this study need verification for other soil and climatic conditions.

Background
Oaks (Quercus spp.) are widespread worldwide and Quercus petraea (Matt.) Liebl. (sessile oak) grows in
Europe over an area of about 300 Million hectares (Caudullo et al. 2017). In Austria, Quercus petraea
together with Quercus robur L. (pedunculate oak) are after Fagus sylvatica L. (European beech) the
second most important broadleaf species, in terms of growing stock, increment and harvesting (BFW
2017). Q. petraea and Q. robur forests cover an area of about 69,000 hectares in Austria, which is about
2% of the total forest area in Austria. Not much in absolute terms, oak-dominated forests in Austria are
common at low elevations near cities and probably have been managed since early times of settlement
(Haneca et al. 2005).

Large parts of the original oak-dominated forests have been lost to settlement and agriculture and the
remaining forests are often under some form of conservation, such as the Vienna Woods near the city of
Vienna in Austria. With about 75% the largest part of the Vienna woods is now a UNESCO biosphere
reserve of about 105,000 ha (Pötzelsberger et al. 2015). Oak species are common at the lower elevations
of the Vienna woods and on pseudogley and shallow soils, where European beech is less competitive and
productivity is lower. These forests are unmanaged or only extensively managed, should approach their
carrying capacity and eventually reach old-growth conditions with diverse stand structure, featuring
significant number of large old trees (Oettel et al. 2020). Stand structure is not only important for habitat
conditions (Mölder et al. 2019), regeneration (Ortmann-Ajkai et al. 2016) and carbon sequestration
(Bruckman et al. 2016), but also broadly determine tree growth (Zeller & Pretzsch 2019, Stimm et al.
2021).

                                                   Page 2/19
Thinning reduces the numbers of trees in a stand and thus concentrates the growth on fewer trees, which
grow faster than under unthinned conditions (Assmann 1970). Stand increment can be increased by
thinning, compared to unthinned conditions, when forests are water-limited and interception losses in
dense stands occurr (Gavinet et al. 2020). This is also supported by Assmann (1970) working on
temperate forests and suggesting that increment of thinned stands can be higher than an unthinned
stand. Assmann (1970) then introduced the concept of an optimal basal area, where stand increment is
highest. The research of the influential forester Emil Assmann was summarized by Pretzsch et al. (2015)
and has still relevance as increment determines the rate of carbon uptake and basal area determines the
carbon stocks in trees (Hochbichler et al. 2006, Suchomel et al. 2012). On the other hand, thinning cannot
increase volume stocks and the volume is in general highest in unthinned stands, composed of a large
number of trees allthough with smaller dimensions (Río et al. 2008). Average thinning intensity is
preferred by visitors, compared to very dense stands (Jensen & Skovsgaard 2009) and thus improve the
recreation value of urban forests.
Q. petraea stands in Czech Republic responded well to thinning with a clear effect on diameter increment,
less on height increment (Fedorová et al. 2016). Thinning has been shown to reduce adverse effects of
droughts and increases drought resistance of Q. petraea in France (Breda et al. 1995, Schmitt et al. 2020).
Survival of sessile oak growing in Hungary was found to be moderately increased after thinning, with
even stronger positive effects for coexisting Carpinus betulus L., the European hornbeam (Tinya et al.
2020). Improving survival is particularly important for oak forests, where summer conditions are usually
critical for growth (Führer et al. 2011). We are not aware of studies for Austrian mixed oak-hornbeam
stands on thinning response and relations between basal area and stand increment.
There are indications that the forest carbon stocks are saturating (Canadell et al. 2007), that is, the
potential for further net carbon uptake is decreasing, in Europe (Nabuurs et al. 2013) and in Amazonia
(Hubau et al. 2020). This saturation is often coupled with unmanaged forests and lack of recent
disturbances (Seidl et al. 2014), both can considerably reduce carbon stocks, but allow for continued net
carbon uptake. In forests, that are in equilibrium (steady-state of carbon pools), gains and losses balance
each other (Paul et al. 2021). We hypothesize that net gain (increment minus losses) approaches zero,
when potential stocking is reached (i.e., growing stock or basal area is constant and not increasing
further). We test this hypothesis for low-elevation sub-humid oak-hornbeam forests near the city of
Vienna. This study has the following objectives: (1) to determine the stand structure of oak-hornbeam
stands in urban forests near Vienna, and (2) to explore relations between stocking (basal area), increment
and mortality for three management alternatives, unthinned, moderate and heavy thinning.
Methods
Data
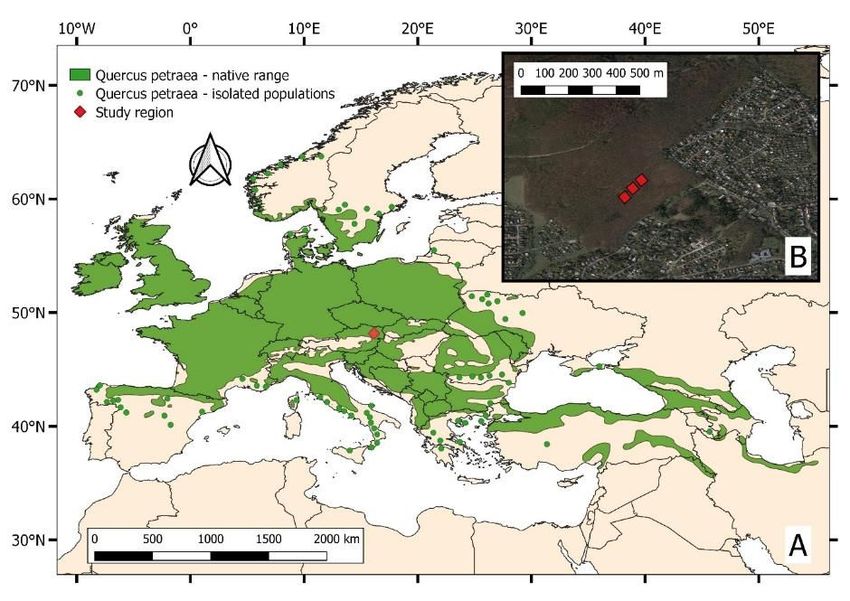
We used data from a thinning trial established in 2009 in a mixed oak-hornbeam forest in the ‘Vienna
Woods’, near Vienna, Austria (Fig. 1). The site locations are approximatly 48.22°N and 16.24°E. The
Page 3/19forests in the study region are owned and managed by the Vienna Forest Administration (public entity of
the City of Vienna). After World War II, large parts of the forests near Vienna were harvested to meet the
demand for wood and the current stands are a result of that. Thus the stands in this area have similar
age and stand structure and have been unthinned prior 2009. Parts of the Vienna Woods are now
UNESCO biosphere reserve. Average annual precipitation is 630 mm, average annual potential
evapotranspiration 768 mm and average daily temperature 9.4°C (Fick & Hijmans 2017, Abatzoglou et al.
2018). The aridity index using the UNEP definition is 0.82 mm/mm (annual precipitation sum / potential
evapotranspiration) and Führer’s aridity index is 6.64°C/mm (Führer et al. 2011). From 1960 to present, in
less than ten years precipitation exceeded potential evapotranspiration (Fig. A1), confirming that these
forests are usually water-limited (sensu Boisvenue and Running 2006; Creed et al. 2014). More details on
the study region can be found elsewhere (Pötzelsberger et al. 2015).
There are three plots with a size between 0.2 to 0.25 hectares. Larger plot size was favoured over
replications, as the terrain is heterogeneous and replicating the plots would have compromised the
comparability of the site conditions. Within the same area a grid-based forest inventory system (not used
here) was established, using angle count sampling (‘Bitterlich sampling’) (Hasenauer & Eastaugh 2012).
The elevation is about 300 m above sea level. The three plots are located within 20 m distance (about
one tree length) along a footpath / skid trail used harvesting (Fig. 1b)
Two plots were thinned in 2009 (chainsaw and skidding on the ground) and one plot was kept unthinned
as control. The treatments were (1) moderate thinning (removal of ~ 50% basal area) and (2) heavy
thinning (removal of ~ 70% basal area). The moderate thinning intended to induce more regeneration
from seeds by more homogenous seed fall, in particular of Quercus spp. The thinning targeted foremost
small-middle sized trees until about 30 cm DBH to promote growth of larger-sized retained trees, to
achieve valuable dimensions.
The plots were measured three times, 2009, 2014 and 2019. For every tree reaching breast height (1.3 m
above ground) the diameter at breast height (DBH), tree height, tree status (alive, standing dead,
harvested) and species was determined.
Analysis
We computed the following stand structure metrics, basal area, stem density, average tree height, stand
volume (using functions of Pollanschütz 1974) and yield class, defined as average periodic increment at
stand age of 100 years using the yield table ‘Eiche Ungarn’ (Marschall 1992). We calculated species
mixture (%) based on contribution to basal area of sessile oak, Quercus petraea (Matt.) Liebl. (pooled with
occasional Turkey oak, Quercus cerris L.), European hornbeam, Carpinus betulus L. and European beech,
Fagus sylvatica L.. We calculated these stand structure metrics for 2009, 2014 and 2019 and for the two
thinned plots, for both before and after thinning in 2009.
We calculated stem density by 10-cm diameter classes to explore potential changes in stand structure
and contributions of species to overall stem density, shown in Table 1. We calculated stand-level
Page 4/19increment and losses (BA2 is zero) for the two periods with remeasurements (2009–2014 and 2014–
2019, each spanning 5 years), after Eq. 1.
Table 1
Stand structure of three stands in year 2009. For thinned stands we show condition before
thinning (“2009 –“) and after thinning (“2009 +“). BA is basal area at breast height (1.3 m
above ground) and NHA is stem density. Mixture represent share of sessile Oak, Quercus
petraea (Matt.) Liebl. (pooled with Turkey oak, Quercus cerris L.), European hornbeam,
Carpinus betulus L., and European beech, Fagus sylvatica L., in percent of BA (separated
by commas). Volume is stem volume using the Austrian form factor functions
(Pollanschütz 1974). Yield class is the cummulated increment at age 100 years using
Austrian yield tables (Marschall 1992).
Unthinned Moderate thinning Heavy thinning
Measurement date 2009 2009 - 2009 + 2009 - 2009 +
BA (m2 ha− 1) 37.3 37.0 16.9 36.4 11.1
NHA (ha− 1) 1736 2170 410 2135 180
Mixture (%) 88, 12,net increase of basal area is caused by increment exceeding mortality independent (see next section). We
also noted a constant stem density for thinned forests (independent of thinning intensity) and no
mortality and no recruitment were observed within 10 years after thinning (Fig. 2b). The thinnings
removed proportionally more stem density, than basal area, and in consequence, the harvesting targeted
smaller diameter stems (see also diameter distribution in Fig. A2).
The stem density distributions of the three stands before thinning in 2009 were similar (Fig. A2). We
noted initially more trees with 10-20 cm DBH in the heavily thinned stand, while the moderately thinned
stand had fewer trees with 0-10 cm and 20-30 cm DBH than the two other stands (Fig. A2a). The thinning
removed trees with diameters smaller 30 cm and the moderate thinning retained trees with 0-10 cm with
about 60 ha-1 partly (Fig. A2b). For the unthinned stand, stem density was decreasing over, particularly for
trees below 20 cm DBH. From these results, we cannot determine the processes behind the observed
changes in stand structure over time. Since each tree was observed separately, we were able to analyse
increment and losses in terms of basal area.
Increment and losses
We measured the plots three times after thinning in 2009 and calculated increment and losses (i.e.,
mortality and harvesting) for two periods, 2009-2014 and 2014-2019. The balance of increment and
losses determines the net change, whether a stand accumulates or loses basal area. The forests in the
study region were mixed and composed predominantly of oak and hornbeam (Table 1, Fig. A3). In Fig. 3,
we show increment and losses separeted for oak, hornbeam and beech – a minor admixed species.
hornbeam and beech had smaller diameters (Fig. A3).
Between 2009-2014, immediately after thinning in 2009, the increment ranged between 0.54 and 0.69 m2
ha-1 year-1 and oak contribute by far most (>85%) to increment. The stand with highest basal area
(unthinned, 37 m2 ha-1) had the second largest increment (0.58 m2 ha-1 year-1) and the stand with lowest
basal area (coppice with standards, 11 m2 ha-1) was fastest growing (0.69 m2 ha-1 year-1). Smallest
increment was obsered between 2009 and 2014 for the moderatly thinned stand (high forest conversion,
16 m2 ha-1) with 0.54 m2 ha-1 year-1. Increment was considerable lower than losses for the two thinned
stands, as harvesting removed 30-50% of basal area and the ratio of between losses and increment was
about 7.4, thus seven times more basal area was lost then gained by increment (Fig. 3). The net change
for unthinned stand, on the other hand, was positive (0.58 - 0.29 = +0.29 m2 ha-1 year-1).
Five to ten years after thinning in 2014-2019, these patterns considerably changed. The unthinned stand
lost three times more basal area (solely due to mortality) than grew through increment. The climate
conditions did not vary considerable between the two periods (Fig. A1). The stand growing less in the
previous period (high forest conversion), was now the only stand with a positive net change in basal area
(Fig. 3). We note here that despite the reduction of plot basal area by 30-50%, there was still considerable
mortality in the two thinned stands, allthough three times smaller than under unthinned conditions. The
largest loss due to mortality was found for the stand with highest basal area (unthinned in 2014-2019,
Page 6/19Figs 2, 3). Thinning targeted foremost small diameter trees (Fig. 3) and also natural mortality under
unthinned conditions was more frequent for trees < 20 cm DBH (Fig. A4). We were next interested,
whether thinning (naturally through mortality or artificially through harvesting) has lead to an increase in
diameters of larger trees.
Larger trees grew faster across the three studied stands based on 10-year diameter increment between
2000 and 2019 and grouped using 20 cm DBH to separate large and small trees (Fig. 4ac). Small trees
were more abundant than large trees (Fig. 4bd). A more detail grouping of trees according to their DBH
show that only few trees hat DBH larger 40 cm (Figs A2-A4). For the dense, unthinned stand, we noted a
significant effect of tree size on diameter increment, with large trees growing significantly faster (p <
0.001). For the two thinned stands, the faster increment of large trees was not significantly different from
small trees (p 0.123 heavy thinning, p 0.149 moderate thinning). There was a clear link between faster
diameter increment and thinning intensity (see also Fig. A5). Under unthinned conditions, diameter
increment was smallest (Fig. 4), consistent with larger stem density but comparable increment on plot
level (Table 2, Fig. 2). Thinning increased the diameter increment 2-2.5 fold for large trees > 20 cm DBH
and even 7-9 times for trees with DBH smaller 20 cm. Diameter increment was not significantly by
thinning intensity, for both large and small trees, despite larger average increment for the strongly thinned
stand (Fig. 4). Comparing both thinned stands with unthinned conditions showed significantly larger
increment associated with thinning, irrespective whether 30 or 50% of basal area are removed.
Discussion
Our study indicates (1) that the studied oak-hornbeam forests respond well to thinning, both on stand and
tree-level, (2) that maximum basal area is reached at 35–40 m2 ha− 1, where increment stagnates and
mortality becomes more frequent and (3) both harvesting and natural mortality result in reduction of the
density of small diameter trees, while harvesting concentrates the growth on the (fewer) remaining trees
more efficiently. We discuss below these topics separatly and their relevance for carbon sequestration
and habitat value.
Thinning response
The thinning applied in the study region removed a considerable share (50–70%) of basal area, mostly
composed of trees with DBH smaller 30 cm. This reduced the basal area and in-situ carbon storage,
assuming that basal area is correlated with tree carbon (Burrows et al. 2002). Basal area measurements
require less time (e.g. using sampling-by-diameter, Bitterlich 1948; Hasenauer and Eastaugh 2012) than
measuring both diameters and tree height – needed to accuratly estimate tree volume using allometric
function (Pollanschütz 1974, Repola 2008, Ruiz-Peinado et al. 2012). In this study, the reduction in tree
carbon by removing small diameter trees (‘thinning from below’) is most likely smaller, as mostly
hornbeam trees with smaller diameter and smaller tree height were removed (Fig. A6). A large number of
small trees have collectivly a smaller volume than few large trees (Neumann et al. 2016).
Page 7/19Diameter increment increased more than two-fold for trees larger 20 cm DBH, thus the carbon allocation
into larger sized wood is more than doubled (Fig. 4). For trees smaller 20 cm DBH the increase in
increment by thinning is even larger, in particular after removing 50% of basal area. Large diameter
coarse woody debris has slower decay and thus longer carbon residence time (Harmon et al. 2020).
Additional benefits of more and larger-sized trees include more flexibility in potential wood products
(Pukkala 2017) and more diverse habitat, for instance for hollow-dwelling animals and other organisms
specialized on large-dimension wood (Thom & Seidl 2016). For carbon accounting purposes, internal
decay of large trees need consideration to avoid overestimating biomass and in consequence carbon
stocks by applying allometric functions (Roxburgh et al. 2006, Dean et al. 2018).
Maximum basal area
Our results suggest that the studied oak-hornbeam stands have maximum basal area of 35–40 m2 ha− 1
(Fig. 2). In the unthinned stand, increment range between 0.25 and 0.6 m2 ha− 1 year− 1 and mortality due
to to competation is in the same range. The basal area remained largely unchanged over the 10-year
measurement period. There is scant published inforamtion on the maximum basal area of unmanaged
oak-hornbeam forests. Grotti et al. (2019) reported for oak-hornbeam stands on floodplains in Northern
Italy stagnating basal area at about 25–30 m2 ha− 1. With an average temperature of 13.2°C and annual
precipitation sum 658 mm, the stands studied by Grotti et al. (2019) had similar precipitation but allmost
4°C higher temperature. These stands were reportedly unmanaged since the 1980s and earlier a coppice
with standards system was in place (similar to the management applied on the intensively thinned stand
of this study).
In Romania, the Runcu-Grosi Natural Reserve has stem density of 713 ha− 1, growing stock of 577 m3 ha−
1
and basal area of 39.3 m2 ha− 1 (Petritan et al. 2012). Annual temperature ranged between 7.6 and
9.4°C and precipitation sum from 750 to 925 mm and thus the Romanian stands had similar temperature
and higher precipitation than the stands used in this study (9.4°C, 630 mm) based on gridded climate
data (Fick & Hijmans 2017). In a nearby study (about 2 km northwest of our study site) an ‘overmature’
coppice (dominated by oak and hornbeam) had stem density (> 5 cm DBH) of 1881 ha− 1, growing stock
of 412 m3 ha− 1 and basal area of 45.6 m2 ha− 1 (Bruckman et al. 2016). Bruckman et al. (2016) did not
measure or report increment or mortality, thus we can only assume that these stands were close to their
maximum basal area. This suggests that oak-hornbeam stands in this region can have up to 46 m2 ha− 1
and thus about 6 m2 ha− 1 more than observed in this study. We have to assume that Bruckman et al.
(2016) included dead trees in their basal area (i.e., carbon study reporting aboveground biomass, but not
standing deadwood). We note, that in this study dead trees were not tallied.
The available literature suggest that oak-hornbeam forests have maximum basal area of about 40 m2
ha− 1, where carbon pool in alive trees is highest (using basal area as proxy for carbon). This study
provides evidence that increment stagnates at this point and mortality exceeds increment (cf. Figure 4)
resulting in net decrease of basal area/carbon in alive trees. Plotting increment versus basal area (sensu
Assmann 1970) indicates that oak-hornbeam stands might have a rather wide ‘plateau’ where basal area
Page 8/19is largely unaffected by decreasing basal area (Fig. 5). This was an unexpected result as initially we
expected a stronger decrease in increment for the heavy thinned stand. This means (1) that oak and
hornbeam are plastic tree species and utilize the additional available resources (light, water, nutrients)
made available through thinning and (2) that oak-hornbeam stands can be thinned by up to 70% basal
area without decreasing increment. It is important to maintain crown cover across the area with even
distribution of retained trees and targetting foremost small-mid diameter trees, to reach the same
outcome as found by this study. Further research to test the effects of thinning targetting large diameters
such as selective final harvest or shelterwood cut.
Harvesting versus natural mortality
Tree death by harvesting or mortality results in decreasing stem density. Over ten years natural mortality
reduced stem density by about 250 ha− 1, while thinning removed 1760–1955 ha− 1. Assuming net basal
area increment of 0.25 m2 ha− 1 year− 1, it will take another 60–70 years to reach pre-thinning basal area.
A thinned stand will be composed of a smaller number of large trees (Fig. A4), than can be expected
under unthinned conditions. The trees in the studied stands grow in height until about 30 cm DBH
reaching their maximum height at about 25 m (Fig. A5). Since thinning targetted mostly small trees, the
average tree height in the two thinned stands increase by 4.5 to 5 m (Table 1). As tree volume can be
estimated as the product of basal area, average tree height and a form factor, the increase in average tree
height through thinning partly compensates for the lower basal area after thinning. In consequence,
considering two stands with the same basal area but different tree diameters (and in consequence tree
height) the stand with large trees can be expected to have larger stand volume.
In conclusion, harvesting speeds up the natural process of tree mortality. Thinned stands have for several
decades lower basal area than unthinned stands. Evaluating the effects of thinning on forest carbon
stocks need measurements of standing and lying deadwood and coarse woody debris (Woldendorp et al.
2004, Harmon et al. 2020), reliable biomass functions and accurate tree height measurements (Neumann
et al. 2016, Stereńczak et al. 2019). This case study provides some evidence that oak-hornbeam forests
may have a broad “plateau-like” relationship between increment and stocking (Assmann 1970), when
stands approach their maximum basal area. Our results encourage verifying whether similar patterns can
be found on contrasting soil and climate condition and other widespread Central-European tree species,
such as Fagus sylvativa or Picea abies.
Conclusions
We demonstrate that the Oak-hornbeam forests studied here have a maximum basal area of 35–40
m2/ha, where further net accumulation of basal area slows considerably. This decrease in net
accumulation is caused by increasing mortality and stagnating increment as stands approach their
carrying capacity. We cannot generalize this behaviour for other forests and tree species. There is,
however, increasing evidence globally for diminishing net gain as forest ecosystems approach their
steady state, e.g. in New Zealand (Paul et al. 2021) and Africa and Amazonia (Hubau et al. 2020). This
Page 9/19study suggests, that for continued uptake (i.e., carbon, biomass or volume), the stocking of forest
ecosystems has to be below the potential steady state; this reduction is possible through forest
management or natural disturbances.
Declarations
Ethics approval and consent to participate
Not applicable.
Consent for publication
Not applicable.
Competing interests
The authors declare that they have no competing interests.
Acknowledgements
We thank the Viennese Forest Administration for permission to establish and maintain the research sites.
We are grateful for the logistic support and field measurements by Raphael Klumpp and Franz Reinthaler.
Authors’ contributions
MN conceived the idea of the study, analysed the data and wrote the manuscript. HH designed the
experimental design, coordinated the fieldwork and helped with interpretation and statistical analysis. All
authors contributed to the drafts and gave approval to publication.
Funding
The study was supported by the University of Natural Resources and Life Sciences, Vienna.
Availability of data and materials
The data used in this analysis is available over https://figshare.com/s/b745b22d333ffbda883c (this
preliminary link will be replaced with final DOI upon acceptance) and is also available from the
corresponding author upon request.
References
1. Abatzoglou JT, Dobrowski SZ, Parks SA, Hegewisch KC (2018) TerraClimate, a high-resolution global
dataset of monthly climate and climatic water balance from 1958–2015. Scientific Data. 5: 1–12. -
doi:10.1038/sdata.2017.191
2. Assmann E (1970) The Principles of Forest Yield Study. Pergamon Press, New York, p 506
Page 10/193. BFW (2017) Österreichische Waldinventur. http://bfw.ac.at/rz/wi.home. Retrieved from
http://bfw.ac.at/rz/wi.home
4. Bitterlich W (1948) Die Winkelzaehlprobe. Allgemeine Forst- Und Holzwirtschaftliche Zeitung. 59: 4–5
5. Boisvenue C, Running SW (2006) Impacts of climate change on natural forest productivity - evidence
since the middle of the 20th century. Global Change Biology 12:862–882. doi:10.1111/j.1365-
2486.2006.01134.x
6. Breda N, Granier A, Aussenac G (1995) Effects of thinning on soil and tree water relations,
transpiration and growth in an oak forest (Quercus petraea (Matt.) Liebl.). Tree Physiology 15:295–
306. doi:10.1093/treephys/15.5.295
7. Bruckman VJ, Terada T, Fukuda K, Yamamoto H, Hochbichler E (2016) Overmature periurban
Quercus–Carpinus coppice forests in Austria and Japan: a comparison of carbon stocks, stand
characteristics and conversion to high forest. European Journal of Forest Research 135:1–13.
doi:10.1007/s10342-016-0979-2
8. Burrows WH, Henry BK, Back PV, Hoffmann MB, Tait LJ, Anderson ER, Menke N, Danaher T, Carter
JO,. McKeon GM (2002) Growth and carbon stock change in eucalypt woodlands in northeast
Australia: ecological and greenhouse sink implications. Global Change Biology. 8: 769–784. - doi:
10.1046/j.1365-2486.2002.00515.x
9. Canadell JG, Pataki DE, Gifford R, Houghton RA, Luo Y, Raupach MR, Smith P, Steffen W. ., Pataki DE,
LF Pitelka eds (2007) Saturation of the Terrestrial Carbon Sink. In: Terrestrial Ecosystems in a
Changing World (JG Canadell. Springer Berlin Heidelberg, Berlin. doi:10.1007/978-3-540-32730-1_6
10. Caudullo G, Welk E, San-Miguel-Ayanz J (2017) Chorological maps for the main European woody
species. Data in Brief 12:662–666. doi:10.1016/j.dib.2017.05.007
11. Creed IF, Spargo AT, Jones JA, Buttle JM, Adams MB, Beall FD, Booth EG, Campbell JL, Clow D, Elder
K, Green MB, Grimm NB, Miniat C, Ramlal P, Saha A, Sebestyen S, Spittlehouse D, Sterling S, Williams
MW, Winkler R, Yao H (2014) Changing forest water yields in response to climate warming: Results
from long-term experimental watershed sites across North America. Global Change Biology
20:3191–3208. doi:10.1111/gcb.12615
12. Dean C, Kirkpatrick JB, Osborn J, Doyle RB, Fitzgerald NB, Roxburgh SH (2018) Novel 3D geometry
and models of the lower regions of large trees for use in carbon accounting of primary forests. AoB
PLANTS 10:1–20. doi:10.1093/aobpla/ply015
13. Fedorová B, Kadavý J, Adamec Z, Kneifl M, Knott R (2016) Response of diameter and height
increment to thinning in oak-hornbeam coppice in the southeastern part of the Czech Republic.
Journal of Forest Science 62:229–235. doi:10.17221/13/2016-JFS
14. Fick SE, Hijmans RJ (2017) WorldClim 2: new 1-km spatial resolution climate surfaces for global
land areas. International Journal of Climatology 37:4302–4315. doi:10.1002/joc.5086
15. Führer E, Horváth L, Jagodics A, Machon A, Szabados I (2011) Application of a new aridity index in
Hungarian forestry practice. Idojaras 115:205–216
Page 11/1916. Gavinet J, Ourcival JM, Gauzere J, García de Jalón L, Limousin JM (2020) Drought mitigation by
thinning: Benefits from the stem to the stand along 15 years of experimental rainfall exclusion in a
holm oak coppice. Forest Ecology Management 473:118266. doi:10.1016/j.foreco.2020.118266
17. Grotti M, Chianucci F, Puletti N, Fardusi MJ, Castaldi C, Corona P (2019) Spatio-temporal variability in
structure and diversity in a semi-natural mixed oak-hornbeam floodplain forest. Ecological Indicators
104:576–587. doi:10.1016/j.ecolind.2019.04.014
18. Haneca K, Van acker J, Beeckman H (2005) Growth trends reveal the forest structure during Roman
and Medieval times in Western Europe: a comparison between archaeological and actual oak ring
series (Quercus robur and Quercus petraea). Annals of Forest Science 62:797–805.
doi:10.1051/forest:2005085
19. Harmon ME, Fasth BG, Yatskov M, Kastendick D, Rock J, Woodall CW (2020) Release of coarse
woody detritus-related carbon: A synthesis across forest biomes. Carbon Balance Management
15:1–21. doi:10.1186/s13021-019-0136-6
20. Hasenauer H, Eastaugh CS (2012) Assessing Forest Production Using Terrestrial Monitoring Data.
International Journal of Forestry Research. 1–8. - doi:10.1155/2012/961576
21. Hochbichler E, Bellos P, Lick E (2006) Biomass functions for estimating needle and branch biomass
of spruce (Picea abies) and Scots pine (Pinus sylvestris) and branch biomass of beech (Fagus
sylvatica) and oak (Quercus robur and petrea). Austrian J For Sci 123:35–46
22. Hubau W, Lewis SL, Phillips OL, Affum-Baffoe K, Beeckman H, Cuní-Sanchez A, Daniels AK, Ewango
CEN, Fauset S, Mukinzi JM, Sheil D, Sonké B, Sullivan MJP, Sunderland TCH, Taedoumg H, Thomas
SC, White LJT, Abernethy KA, Adu-Bredu S, Amani CA, Baker TR, Banin LF, Baya F, Begne SK, Bennett
AC, Benedet F, Bitariho R, Bocko YE, Boeckx P, Boundja P, Brienen RJW, Brncic T, Chezeaux E, Chuyong
GB, Clark CJ, Collins M, Comiskey JA, Coomes DA, Dargie GC, de Haulleville T, Kamdem MND, Doucet
JL, Esquivel-Muelbert A, Feldpausch TR, Fofanah A, Foli EG, Gilpin M, Gloor E, Gonmadje C, Gourlet-
Fleury S, Hall JS, Hamilton AC, Harris DJ, Hart TB, Hockemba MBN, Hladik A, Ifo SA, Jeffery KJ,
Jucker T, Yakusu EK, Kearsley E, Kenfack D, Koch A, Leal ME, Levesley A, Lindsell JA, Lisingo J,
Lopez-Gonzalez G, Lovett JC, Makana JR, Malhi Y, Marshall AR, Martin J, Martin EH, Mbayu FM,
Medjibe VP, Mihindou V, Mitchard ETA, Moore S, Munishi PKT, Bengone NN, Ojo L, Ondo FE, Peh KSH,
Pickavance GC, Poulsen AD, Poulsen JR, Qie L, Reitsma J, Rovero F, Swaine MD, Talbot J, Taplin J,
Taylor DM, Thomas DW, Toirambe B, Mukendi JT, Tuagben D, Umunay PM, van der Heijden GMF,
Verbeeck H, Vleminckx J, Willcock S, Wöll H, Woods JT, Zemagho L (2020) Asynchronous carbon
sink saturation in African and Amazonian tropical forests. Nature 579:80–87. doi:10.1038/s41586-
020-2035-0
23. Jensen FS, Skovsgaard JP (2009) Precommercial thinning of pedunculate oak: Recreational
preferences of the population of Denmark for different thinning practices in young stands.
Scandinavian Journal of Forest Research 24:28–36. doi:10.1080/02827580802592475
24. Marschall J (1992) Hilfstafeln für die Forsteinrichtung. Österreichischer Agrarverlag, Wien, 5. edition,
pp. 202
Page 12/1925. Mölder A, Meyer P, Nagel RV (2019) Integrative management to sustain biodiversity and ecological
continuity in Central European temperate oak (Quercus robur, Q. petraea) forests: An overview. Forest
Ecology Management 437:324–339. doi:10.1016/j.foreco.2019.01.006
26. Nabuurs G-J, Lindner M, Verkerk PJ, Gunia K, Deda P, Michalak R, Grassi G (2013) First signs of
carbon sink saturation in European forest biomass. Nature Climate Change 3:792–796.
doi:10.1038/nclimate1853
27. Neumann M, Moreno A, Mues V, Härkönen S, Mura M, Bouriaud O, Lang M, Achten WMJ, Thivolle-
Cazat A, Bronisz K, Merganič J, Decuyper M, Alberdi I, Astrup R, Mohren F, Hasenauer H (2016)
Comparison of carbon estimation methods for European forests. Forest Ecology Management
361:397–420. doi:10.1016/j.foreco.2015.11.016
28. Oettel J, Lapin K, Kindermann G, Steiner H, Schweinzer K, Frank G, Essl F (2020) Patterns and drivers
of deadwood volume and composition in different forest types of the Austrian natural forest
reserves. Forest Ecology Management 463:118016. doi:10.1016/j.foreco.2020.118016
29. Ortmann-Ajkai A, Csicsek G, Hollos R, Kevey B, Borhidi A (2016) Comparison of spontaneous
regeneration in unmanaged oak (Quercus robur L.) and beech (Fagus sylvatica L.) forests:
implications for close-to-nature silviculture. Austrian Journal of Forest Science 133:223–250
30. Paul T, Kimberley MO, Beets PN (2021) Natural forests in New Zealand – a large terrestrial carbon
pool in a national state of equilibrium. Forest Ecosystems 8 -. doi:10.1186/s40663-021-00312-0
31. Petritan AM, Biris IA, Merce O, Turcu DO, Petritan IC (2012) Structure and diversity of a natural
temperate sessile oak (Quercus petraea L.) - European Beech (Fagus sylvatica L.) forest. Forest
Ecology Management 280:140–149. doi:10.1016/j.foreco.2012.06.007
32. Pollanschütz J (1974) Formzahlfunktionen der Hauptbaumarten Österreichs. Informationsdienst
Forstliche Bundesversuchsanstalt Wien 153:341–343
33. Pötzelsberger E, Wolfslehner B, Hasenauer H (2015) Climate change impacts on key forest functions
of the Vienna Woods. European Journal of Forest Research 134:481–496. doi:10.1007/s10342-015-
0866-2
34. Pretzsch H, Biber P, von Gadow K (2015) Ernst Assmann: A German pioneer in forest production
ecology and quantitative silviculture. European Journal of Forest Research 134:391–402.
doi:10.1007/s10342-015-0872-4
35. Pukkala T (2017) Does management improve the carbon balance of forestry? Forestry 90:125–135.
doi:10.1093/forestry/cpw043
36. Repola J (2008) Biomass Equations for Birch in Finland. Silva Fennica 42:605–624
37. Río M, Del, Calama R, Cañellas I, Roig S, Montero G (2008) Thinning intensity and growth response in
SW-European Scots pine stands. Annals of Forest Science 65:308–308. doi:10.1051/forest:2008009
38. Roxburgh SH, Wood SW, Mackey BG, Woldendorp G, Gibbons P (2006) Assessing the carbon
sequestration potential of managed forests: A case study from temperate Australia. Journal of
Applied Ecology 43:1149–1159. doi:10.1111/j.1365-2664.2006.01221.x
Page 13/1939. Ruiz-Peinado R, Montero G, Del Rio M (2012) Biomass models to estimate carbon stocks for
hardwood tree species. Forest Systems 21:42–52
40. San-Miguel-Ayanz J, de Rigo D, Caudullo G, Houston Durrant T, Mauri A (2016) European Atlas of
Forest Tree Species. Publication Office of the European Union, Luxembourg. - doi: 10.2788/038466
41. Schmitt A, Trouvé R, Seynave I, Lebourgeois F (2020) Decreasing stand density favors resistance,
resilience, and recovery of Quercus petraea trees to a severe drought, particularly on dry sites. Annals
of Forest Science 77 -. doi:10.1007/s13595-020-00959-9
42. Seidl R, Schelhaas M-J, Rammer W, Verkerk PJ (2014) Increasing forest disturbances in Europe and
their impact on carbon storage. Nature Climate Change 4:806–810. doi:10.1038/nclimate2318
43. Stereńczak K, Mielcarek M, Wertz B, Bronisz K, Zajączkowski G, Jagodziński AM, Ochał W, Skorupski
M (2019) Factors influencing the accuracy of ground-based tree-height measurements for major
European tree species. Journal of Environmental Management 231:1284–1292.
doi:10.1016/j.jenvman.2018.09.100
44. Stimm K, Heym M, Uhl E, Tretter S, Pretzsch H (2021) Height growth-related competitiveness of oak
(Quercus petraea (Matt.) Liebl. and Quercus robur L.) under climate change in Central Europe. Is
silvicultural assistance still required in mixed-species stands? Forest Ecology and Management. 482:
118780. - doi: 10.1016/j.foreco.2020.118780
45. Suchomel C, Pyttel P, Becker G, Bauhus J (2012) Biomass equations for sessile oak (Quercus petraea
(Matt.) Liebl.) and hornbeam (Carpinus betulus L.) in aged coppiced forests in southwest Germany.
Biomass Bioenerg. 1–9. - doi:10.1016/j.biombioe.2012.06.021
46. Thom D, Seidl R (2016) Natural disturbance impacts on ecosystem services and biodiversity in
temperate and boreal forests. Biological Reviews 91:760–781. doi:10.1111/brv.12193
47. Tinya F, Kovács B, Aszalós R, Tóth B, Csépányi P, Németh C, Ódor P (2020) Initial regeneration
success of tree species after different forestry treatments in a sessile oak-hornbeam forest. Forest
Ecology Management 459:117810. doi:10.1016/j.foreco.2019.117810
48. Woldendorp G, Keenan RJ, Barry S, Spencer RD (2004) Analysis of sampling methods for coarse
woody debris. Forest Ecology Management 198:133–148. doi:10.1016/j.foreco.2004.03.042
49. Zeller L, Pretzsch H (2019) Effect of forest structure on stand productivity in Central European forests
depends on developmental stage and tree species diversity. Forest Ecology Management 434:193–
204. doi:10.1016/j.foreco.2018.12.024
Figures
Page 14/19Figure 1
Current distribution of Quercus petraea - sessile oak (San-Miguel-Ayanz et al. 2016) in Europe (A) and
enlarged location of study area and the three sample plots (B).
Page 15/19Figure 2
Basal area (a) and stem density (b) of three oak-hornbeam stands with contrasting management. For the
first measurement in year 2009, we show before and after treatment conditions for the thinned stands.
Page 16/19Figure 3
Increment versus losses in basal area (m2 ha-1 year-1) for the two periods with remeasurements, 2009-
2014 and 2014-2019, with color-coded species. We limited the extent of the vertical axis to 1 m2 ha-1
year-1 to enhance readability. For 2009-2014, losses of moderatly thinned stand were 4.61 m2 ha-1 year-1
and the losses of the heavy thinned stand were 5.71 m2 ha-1 year-1.
Page 17/19Figure 4
Diameter increment of trees measured at both 2009 and 2019 separated into two DBH classes (a, c) and
their stem density (b, d). We separated large trees and small trees using 20 cm DBH as cut-off. The boxes
in a and c represent the median and the 25th and 75th percentile, the whiskers extend to 1.5 of the
interquartile range. Observations outside the interquartile range are shown as dots.
Page 18/19Figure 5
Relationship between basal area and basal area increment for oak-hornbeam stands with different
stocking (3 sites x 2 remeasurements). Dots with basal area of about 38 m2 ha-1 are unthinned. We
added a second-order polynomial function forced through the plot origin to illustrate the plateau effect of
stocking and increment (sensu Assmann 1970).
Supplementary Files
This is a list of supplementary files associated with this preprint. Click to download.
Supplement.docx
Page 19/19You can also read