Simultaneous Production of Bioethanol and Bioelectricity in a Membrane Less Single Chambered Yeast Fuel Cell by Saccharomyces Cerevisiae and ...
←
→
Page content transcription
If your browser does not render page correctly, please read the page content below

Simultaneous Production of Bioethanol and
Bioelectricity in a Membrane Less Single
Chambered Yeast Fuel Cell by Saccharomyces
Cerevisiae and Pichia Fermentans
Akansha Shrivastava
Manipal University Jaipur
Mamta Pal
Manipal University Jaipur
Rakesh Kumar Sharma ( rakeshkumar.sharma@jaipur.manipal.edu )
Manipal University Jaipur https://orcid.org/0000-0002-2826-1291
Research
Keywords: Pichia fermentans, Saccharomyces cerevisiae, Single chambered MFC, Ethanol production,
Columbic efficiency
Posted Date: April 19th, 2021
DOI: https://doi.org/10.21203/rs.3.rs-405049/v1
License: This work is licensed under a Creative Commons Attribution 4.0 International License.
Read Full License
Page 1/16
Abstract
Production of bioethanol and bioelectricity is a promising approach through microbial electrochemical
technology. Sugars are metabolized by yeast to produces ethanol, CO2 and energy. Surplus electrons
produced during the fermentation can be transferred through the circuit to generate electricity in a
Microbial fuel cell (MFC). In the present study, a membrane less single chambered microbial fuel cell was
developed for simultaneous production of bioethanol and bioelectricity. Pichia fermentans along with a
well-known ethanol producing yeast Saccharomyces cerevisiae was allowed to ferment glucose. S.
cerevisiae demonstrated maximum open circuit voltage (OCV) 0.287 ± 0.009 V and power density 4.473
mW m− 2 on 15th day, with a maximum ethanol yield of 5.6% (v/v) on 12th day. P. fermentans
demonstrated a maximum OCV of 0.318 ± 0.0039 V and power density of 8.299 mW m− 2 on 15th day
with ethanol yield of 4.7 % (v/v) on 12th day. Coulombic efficiency (CE) increased gradually from 0.002–
0.471 % and 0.012–0.089 % in the case of S. cerevisiae and P. fermentans, respectively, during 15 days of
experiment. Thus, the result indicated that Single chambered fuel cell can be explored for its potential
applications for ethanol production along with clean energy generation.

1. Introduction
Fossil fuels are naturally occurring carbon or hydrocarbon fuel such as peat and coal while natural gases
are formed by the decay of plants or animals. The products formed by fossil fuels are essential for our
living and required for the production of materials like plastics, medicines, life-saving devices, gasoline,
fuel, heating oil, while natural gas to be used as fuel and generate electricity. In spite of being several
usages, increasing price and negative environmental impact of fossil fuels have increased the concerns
related to its future availability and use. Several potential alternative fuels including biodiesel, methanol,
hydrogen, natural gas, bio-oil, bio-char, liquefied petroleum gas (LPG), Fischer–Tropsch fuel, p-series,
bioelectricity, and solar fuels (Aditiya et al. 2016; Baig et al. 2019) have been developed. Moreover,
bioethanol is also produced from various agricultural raw materials such as sucrose-containing
feedstocks, lignocellulosic materials and starch materials (Bušić et al. 2018). Since the conversion of
lignocellulosic biomass into ethanol is difficult due to the fact of being resistant in nature to be degraded
(Liu et al. 2019). Bioethanol is a promising liquid fuel that is expected to have promising future.

The increasing interest in bioethanol production started since 1980s and hence has been considered as
an alternative fuel in many countries. It helps to reduce CO2 emission up to 80% as compared to using the
petrol, thus encourages a healthier environment for the future. They are recyclable and contribute to
sustainability. Similarly, production of bioelectricity in microbial fuel cell (MFC) as biotechnological
system is another developing green approach towards renewable energy from sustainable development
(Paul et al. 2018; Kumar et al. 2019). Bioelectricity is produced through microbial catalytic activity using
various organic sources. In MFC, anode accepts electrons from microbial catabolic activity through
oxidation and reduction processes. In general, it is evident that 2 mol of ethanol is produced from 1 mol
of glucose (glucose → Pyruvate → acetaldehyde → ethanol) through NADH-dependant enzyme and

                                                   Page 2/16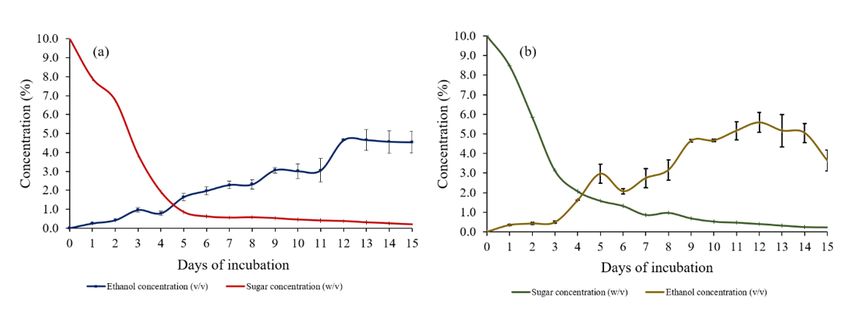
alcohol dehydrogenase. This reaction generates two ATP molecules, two H+ ions and two electrons.
These electrons are stored in cells in the form of NADH. An increasing ratio of NADH to NAD + could help
to generate voltage output (Geng et al. 2020). Thus the generated electrons from NADH/NAD + redox cycle
may be used in MFC system (Walker and Stewart 2016). Therefore, it is possible that yeast metabolic
activity, energy production and its conversion into heat could be efficiently harvested as electricity
through a combined approach of MFC during sugar fermentation and ethanol production.

Yeast could potentially be considered as an ideal model organism for MFC applications due to its non-
pathogenic nature and being able to utilize a wide-ranging substrate. The most commonly used
biocatalyst for fermenting the sugars into ethanol is Saccharomyces cerevisiae, but its use is restricted as
it cannot ferment xylose and other 5-carbon sugars present in lignocellulosic material. On the other hand,
xylose-fermenting yeasts e.g. Pichia stipitis, Candida parapsilosis and Candida shehatae (Mohd Azhar et
al. 2017) may ferment both 5-carbon as well as 6-carbon sugars. Pichia fermentans has also been
reported to produce xylitol using non-detoxified xylose rich pre-hydrolysate from sugarcane bagasse
(Prabhu et al. 2020).

Recently published reports suggests that non-pathogenic Pichia fermentans could be a potential yeast to
be used in a microbial fuel cell due to its possible exoelectrogenic property (Pal and Sharma 2019). The
signaling molecule produced by one cell and sensed by another to induce oriented growth is considered
for cell-cell communication (Stephens and Bentley 2020). Most bacterial communities are embedded in
structured extracellular polymeric substances (EPS) to survive in a harsh environment (Flemming and
Wuertz 2019). Electroactive biofilms play an important role in bioelectrochemical system via various
electron transfer mechanism. Yeasts may also produce biofilm to enhance electron transfer mechanism
and biofilm dynamics in microbial fuel cells (Speranza et al. 2020).

Most of the work related to MFC has been focused on reactor design, proton exchange membrane,
electrolyte development and modification of electrode design and materials to increase electricity
production (Christwardana et al. 2019). There are several advantages in MFC as it can be operated in fed
batch, continuous or batch mode whether single chambered or double chambered, with membrane or
membrane less etc. This paper presents an approach to explore MFC for bioethanol production with
simultaneous generation of electricity. The study further evaluates the production of ethanol in MFC by P.
fermentans and compared its efficiency with a well-known sugar fermenting yeast S. cerevisiae under a
batch type operation in a single chambered Microbial fuel cell. The electrochemical data was generated
by calculating current density, power density, output voltage along with the glucose consumption for
maximum ethanol yield and fermentation efficiency.

2. Experimental Section
2.1 Microorganisms

                                                   Page 3/16
Pichia fermentans was procured from the Microbial Type Culture collection (MTCC 189) Chandigarh,
India, and cultured aerobically in yeast extract and glucose (YG) agar and maintained. And
Saccharomyces cerevisiae was purchased from local market and maintained. Both the yeasts, P.
fermentans and S. cerevisiae was cultured for 24 hours at 30°C enriched with yeast extract 0.25% (w/v)
and Glucose 10% (w/v) in a 1L solution. The same broth medium was used for inoculum preparation to
be inoculated in the MFC.

2.2 Single Chambered MFC setup
A typical mediator less membrane less single chambered MFC was constructed using glass flasks (with
working volume 100 mL). Bow shaped Carbon fibers (100 cm length, 7 mm diameter) were used as
anode and circular stainless steel wire (as a mesh) (100 cm length, 0.05 mm diameter) as cathode (Nam
et al. 2018). Both the electrodes were sterilized with ethanol, rinsed with autoclaved distilled water, and
treated under UV radiation for 20 min, then dried under aseptic conditions. The flasks contained
production medium (Glucose 10% (w/v), enriched with yeast extract 0.25% (w/v) was sterilized and then
sterilized electrodes were fixed at a vertical distance of 3 cm using rubber corks as plug to maintain
anaerobic condition for fermentation. The flasks were inoculated with either of the yeast (10 % (v/v) and
incubated at 30°C for 15 days. All experiments were performed in triplicates and repeated along with
suitable controls. The sample (2 ml) was taken out for glucose and ethanol estimations.

2.3 Electrochemical calculations
The open circuit voltage (OCV) and output voltage was recorded across different external resistor ranging
from 1000Ω to 820KΩ via a digital multimeter. For the preparation of polarization curve the external
resistance (Rex) was varied at time intervals. The current (I) was calculated by using Ohm’s law V = IR,
where V represents cell voltage value and R represents external resistance value. Power was calculated
according to P = VR whereas, Current density (j) and power density (p) were calculated using electrode
(anode) area (2.2 cm2). The Coulombic efficiency (CE) was calculated using CE = CEx×100/CTH, CEx is the
experimental value of total coulombs. The theoretical value of coulombs (CTH) was calculated using CTH
= FnMV, where F stands for faraday constant (96,485C per mole of electrons), n represents number of
electrons produced per glucose unit consumed during fermentation, M is the glucose concentration and V
represents the reaction volume (L). Internal resistance (Rint) of the cell was calculated as Rint = R (E/V-1)
where R represents external resistance, E represents OCV (voltage without any resistance), and V
represents output voltage with resistors (Pal and Sharma 2020). All data presented in the manuscript are
average of triplicates along with the standard error bars.
2.4 Glucose estimation
Concentration of glucose in the cell setup was routinely measured by dinitrosalicylic acid (DNS) method.
The quantification was performed according to the step-by-step method (Pal and Sharma 2019). DNSA
reagent was prepared by dissolving 2g of DNSA and 60g of sodium-potassium tartaric acid in 160 mL of
0.5N NaOH. It was cooled to room temperature and diluted to 200mL with the help of distilled water. Then
1 mL of DNSA reagent was pipette out in a test tube containing 0.5 mL of sample (1g/mL) and kept at
                                                   Page 4/16
100°C for 5 min. After cooling, 1.5 mL of distilled water was added to the same test tube to stop further
reaction and absorbance was measured at 540 nm using UV-VIS spectrophotometer. The glucose
concentration was calculated from the standard curve of D-glucose (0.1mg-1g/mL), and results were
expressed as mg glucose equivalent (GE) per mL sample. The ethanol fermentation was confirmed by
using High performance liquid chromatography.

2.5 Ethanol estimation
All parameters were performed with an Agilent HPLC 1260 II INFINITY with autosampler and C18 column
(5 µm; 25 x 0.46cm). All the outputs were processed through Agilent Chemstation-Open lab software. All
samples were drawn out and recorded on daily basis. The sample was centrifuged at 8000 rpm for 15
min to collect for further process. The total runtime was 6 min with peaks detected with a UV detector.
Water was used as a mobile phase with 4% acetone added in an optimized parameter. The standard flow
rate was set at 1mL/min with injection volume of 1µL and detection was monitored at 235 nm and 25°C
temperature. Standard ethanol solutions were prepared in water ranging from 0.1% -10% (v/v).

Ethanol absorbs less UV compared to high UV absorbing background, which result in the reverse positive
or negative peak polarity. Direct estimation of ethanol as a negative peak from samples was confirmed
by reversed phase-HPLC and performed same according to (Nisha et al. 2016). In every run, the three
peaks were corresponding to acetone, ethanol or water singly or in combination were detected. Acetone,
pure water and ethanol samples were injected separately for separate verification of retention times into
the HPLC system in separate runs. The quantitative analysis of ethanol was calculated from the formula-

Concentration of unknown sample = Unknown sample area / standard solution area × concentration of
standard solution

Where peak areas are in arbitrary units and peak heights and area in milli absorbance units (mAU).

2.6 EPS production
P. fermentans and S. cerevisiae were grown separately in 10mL sterilized Yeast extract and Glucose (YG)
broth and incubated for 15 days at 30°C. The samples were taken out from both the cultures at altered
time intervals (day 1, day 5, 10 and 15) to estimate EPS. Ten mL of cell culture was centrifuged
simultaneously at 8000 rpm for 15 min. The carbohydrate in EPS was analysed by phenol/sulphuric acid
method and glucose was used as a standard (Pal and Sharma 2019). Protein was estimated by Lowry
method and bovine serum albumin was used as a standard (Zhang et al. 2019).

2.7 Fourier transform infrared spectroscopy
Functional groups in EPS were detected by Fourier transform infrared (FTIR) spectroscopy. A drop of EPS
solution from both the samples was used for study on a glass slide as a dry film.

2.8 Scanning electron microscopy

                                                 Page 5/16
The visual appearance of P. fermentans and S. cerevisiae was evaluated on anodic surface at 1000X
magnification. The sample was prepared by using electrode material from both the cell cultures at
different time interval (day 1, 5, 10 and 15) and was air dried on a glass slide.
3. Results & Discussion
3.1 Performance of MFC
Combination of fermentation and electricity generation demonstrated a promising performance in the
MFC. Both the yeast S. cerevisiae and P. fermentans grew rapidly under experimental setup (membrane
less single chambered MFC). All the setup depicted a typical behaviour of MFC in terms of its
electrochemical responses. In the absence of exogenous electron mediator, the intracellular proteins of
the model organisms play a major role in electron transfer located inside the cell. This could possibly
overcome by adherence of yeast cells to the carbon fibre surface through force driven interaction such as
electrostatic or physical adsorption (Rossi et al. 2015).
3.2 Electrochemical response
Electrochemical performance of both the MFC setup containing either P. fermentans or S. cerevisiae,
gradually increased after 24 h of inoculation, which was almost stable upto 15 days of the incubation.
Maximum OCV for P. fermentans 0.318 ± 0.0039 V was recorded on 15th day (Fig. 1a).
Current density also increased gradually from 4.848 mA m− 2 (1st day) to 57.348 mA m− 2 (15th day)
(Fig. 2c and d). Power density of the cell also followed similar pattern with maximum power density of
8.299 mW m− 2 was recorded on 15th day. For S. cerevisiae maximum recorded OCV was 0.287 ± 0.009 V
on 15th day (Fig. 1a) with increasing current density from 1.66 mA m− 2 on 1st day to 43.63 mA m− 2 on
15th day (Fig. 2a and b). Power density was also recorded with same increasing pattern out of which
maximum is 4.47 mW m− 2 on 15th day (Fig. 2a).
The internal resistance (Rint) was very high against different Rex from 1000 Ω-82 KΩ for both the
organisms on 1st day which drastically decreases from 2nd day onwards (Fig. 3a and b). Combination of
carbon fibre anode and stainless steel cathode has been explored well in the setup. Thus indicates the
present setup was intact without any physical damage or corrosion and can be reused efficiently after
sterilization. MFC appears to be an ecological approach to achieve the cost-effective electricity
generation. The maximum power density for P. fermentans was 8.299 mW m− 2/100mL while the current
density was 57.348 mA m− 2/100mL on 15th day and 0.318 ± 0.0039 V power output for the same day.
From past years, Pichia has been explored in the field of MFC such as Pichia pastoris, Pichia stipitis,
Pichia kudriavzevii etc., for power generation with genetic modifications and less interest was focused on
efficient bioethanol formation (Pal and Sharma 2019). Whereas the S. cerevisiae was measured at power
density of 4.473 mW m− 2/100mL on 15th day while the current density was 43.636 mA m− 2/100mL on
15th day and power output was of 0.287 ± 0.0094 V.
Page 6/16Amongst them P. fermentans was resulted in better power, current density and OCV than S. cerevisiae.
This is because of low resistance and large surface area of carbon brush electrode. Makes them ideal
features as anodes from small as well as large scale applications of MFCs (Yuan et al. 2020a). Yuan et
al recently published a report on simultaneous power generation system and bioethanol formation. In
this, they used S. cerevisiae as model organism for dual and single chambered MFC setup with or without
Mediator for power generation and ethanol production. This study resulted in a high power output (5.2 ±
0.5 W/m3) and high ethanol yield (92.5 ± 2%). There are many factors affecting electron transport such
as cell metabolism, pH value, mediator type, yeast cell growth, substrate. But excessive addition of MB for
electron transfer could affect the activity of yeast and lasts in unbalancing and blocking of electron
transmission.
3.3 Glucose consumption and ethanol production
The quantifiable reducing sugar content was carried out using Dinitrosalicylic acid (DNSA) method. Basic
principle involves for the method is interaction of an alkaline solution of DNSA with reducing sugars such
as glucose and fructose wherein the aldehyde group of reducing sugar is oxidized to the carboxylic acid
and the 3-nitro group (NOO−). The change in colour was measured at 540 nm (Jain et al. 2020). The
variation of the orange-red color index was the indication of presence of reducing sugar to high/low
extent.
The sugar consumption and ethanol production by these yeasts was studied in 100 mL single chambered
cell setup in sugar medium containing 10% (Glucose) 100 mL Erlenmeyer flasks, supplemented with
0.25% yeast extract and incubated as described above. The glucose content was calculated from the
standardization curve of D-glucose (y = 6.5333x + 0.0613, R² = 0.9909) and expressed as mg/mL. The
glucose was efficiently consumed during initial days of incubation period; about 15–20% of glucose was
consumed in one day. After 24 h, the glucose concentration reduced from 10% (w/v) to 7.8 ± 0.0004%
(w/v) in the reactors inoculated with P. fermentans and 8.4 ± 0.0003% (w/v) for S. cerevisiae, while the
glucose concentration was only 0.2 ± 0.00002% (w/v) at the end of the experiment. A detectable amount
0.025% (v/v) of ethanol was observed on day 1 for P. fermentans, which was maximum on 12th day 4.7%
(v/v) and remain constant on 13th day and decreased gradually. As, Pichia utilizes hexoses slowly than
pentose sugar as a carbon source and ethanol formation during fermentation process (Tahir and Mezori
2020).
Whereas, in the case of S. cerevisiae the ethanol concentration measured on day 1 was 0.03 % (v/v) with
remaining glucose concentration of 8.4 % (w/v). S. cerevisiae produced maximum ethanol on 12th day
5.6 % (v/v) and the remaining glucose concentration was left with 0.23 % (w/v) at the end of experiment
(Fig. 4a and b). It shows alcohol production by yeast cells P. fermentans and S. cerevisiae on day wise
fermentation analysis.
The 24 h old cells subjected to fermentation in a 10 % glucose solution (10g/100mL) and have ability to
ferment glucose to ethanol. The cell setup of P. fermentans showed maximum 4.7 % (v/v) ethanol
production of theoretical yield (6.41 % v/v for 10 % glucose) on day 12 and continued to remain constant
Page 7/16upto day 13 and gradually decreased on consecutive days (Nandal et al. 2020). Since 1 mol of glucose
produces 2 mol of ethanol and 2CO2. This infers that the power generation in MFC setup is independent
of fermentation process. In point of fact, ethanol and power generation occur concurrently with the
process of glucose metabolization through yeast. It been reported from several studies that under
anaerobic conditions, 1 mol of glucose can be converted to give 2 mol of ethanol and 2 mol of electrons.
It is evident that the under anaerobic conditions, yeast-MFC cannot utilize all the electrons from complete
oxidation of glucose. Another major reason is the direct electron transfer by a yeast cell is very limited, as
compared to Shewanella and Geobacter (Christwardana et al. 2018). Therefore, this study focused on the
simultaneous production of both bioethanol and electricity generation so that the substrate can be fully
utilized for significant benefit.
Based on the stoichiometric information, glucose concentrations were theoretically converted to electron
amounts. It was used to calculate the amount of electrons passed through the MFC circuit during glucose
oxidation (Flimban et al. 2019). The CE According to the formula for CE, CE = (CEX × 100/CTh), one can
calculate how many electrons were involved in electron transfer through the MFC external circuit (Yuan et
al. 2020b). Over 24 h, the CE of the proposed MFC setup for P. fermentans was 0.012% and increased
upto 0.89% gradually along with the increase in the current density (Fig. 1b). Whereas, the CE efficiency
after 24 h for the S. cerevisiae was 0.002% and increased to 0.47% on concluded day. Still, most of the
electrons may possibly involve in the ethanol production process. This indicates that MFC setup had little
effect on fermentation efficiency (Walker and Stewart 2016; Yuan et al. 2020a). The carbon fibre of
electrode provides massive surface area for yeast adsorption on its electrode surface. Hence, the
application of yeast cells on carbon fibre electrode improved the immobilization effect onto the electrode
(Yuan et al. 2020a). A higher glucose concentration would yield more electrons for high electricity
generation and ethanol (dos Passos et al. 2019; Zhao and Zhang 2019). Whereas, a massive literature
survey suggests the ongoing efforts for energy generation and biofuel formation (Moradian et al. 2021).
Still there is lot to unravel about the efficient mechanism behind the electron transfer and different
substrates conversion to energy generation requires further consideration.
3.4 Effect of pH
In industrial ethanol production, yeast tolerates wide range of pH, thus making the whole process less
susceptible to contamination. It was observed that higher acidic conditions produces larger amount of
ethanol (Mohd Azhar et al. 2017). At the time of yeast fuel cell setup for P. fermentans and S. cerevisiae,
the initial pH was maintained at 7. In the cells inoculated with P. fermentans, the pH decreases to 6.5 after
24 h and here ethanol was measured is 0.3% (v/v), which was further decreased to 5 and was constant
from day 4 to day 7 and during these days the concentration of ethanol ranged from 0.8–2.3% (v/v). A
decrease in pH and increase in ethanol yield was observed during further incubation. In S. cerevisiae after
24 h the pH decreased upto 6.6 and a detectable volume of ethanol was recorded 0.3% (v/v). The pH
decreased upto 5 during further 9 days of incubation and increasing ethanol concentration upto 5.6%
(v/v). As per the results obtained P. fermentans produced maximum ethanol 4.7% on 12th day with pH
4.3, while S. cerevisiae produced maximum ethanol 5.6% on 12th day of incubation with 4.8 pH (Figure
Page 8/16S1). The yeast S. cerevisiae strains are considered to be pillars of fermentation industry since then
dominated ethanol fermentation due to their low pH tolerance for ethanol formation, organic acids, and
low oxygen availability. It is evident that in P. fermentans the correlated effect of respiratory and
fermentative pathways supports growth and product formation. This yeast ferments glucose or xylose
under oxygen-limited conditions (Kwak et al. 2019).
3.5 EPS production
EPS production was observed in both the yeast P. fermentans and S. cerevisiae along with their growth
and colonization on anode surface. Growing biofilm were observed under scanning electron microscopic
images (Fig. 5).
The biofilm was developed on the anode surface as well as on the top of the medium. A significant
correlation between EPS production and yeast growth was observed as analysed on different days (day 1,
5, 10 and 15). The cells grew rapidly along with the biomass accumulation on different time intervals and
resulted in gradual increase in biomass, protein, EPS and carbohydrate (Fig. 6a and b).
Both the yeast P. fermentans and S. cerevisiae produced EPS along with a dense biofilm on carbon fibre
anode, which showed efficient direct electron transfer. However, its EPS may have boosted the electron
transfer via the indirect mechanism (Pal and Sharma 2019). Evident studies suggested that the
combination of yeast attached anode improves electron transfer directly creating synergistic effect
(Chung et al. 2016). EPS composed of polysaccharides, extracellular DNA, glycoproteins, glycolipids and
proteins. This EPS plays some significant roles such as microbial cell to cell communication, protection
from external and specially extracellular electron transfer (Flemming et al. 2016). It is evident that
presence of carbohydrate in EPS carry out specific functions in mat formation.
The protective glycocalyx acts as a mediator in yeast for electron transfer and may be involved in
oxidation and reduction reactions. The presence of EPS matrix was confirmed by infrared (IR) spectrum.
After 24 h (day 1), the EPS production for Saccharomyces cerevisiae and Pichia fermentans was
minimum but increased gradually during further incubation on day 5, day 10 and day 15. The spectrum
of purified EPS showed numerous peaks from 3585 − 502 cm⁻¹ (Figure S2a and b). The EPS absorption
frequency from 3585 to 3174 cm⁻¹ and 3688 − 3071 cm⁻¹ showed the presence of alcoholic (O-H) group,
primary and secondary amine group confirms the polysaccharide nature of EPS produced by S. cerevisiae
and P. fermentans, respectively. Peaks ranging from 2969 − 2763 cm⁻¹ and 2956 − 2763 cm⁻¹ represent
saturated aliphatic (alkene/alkyl) with methyl C-H (− CH3) asymmetrical/symmetrical stretch and ether
and oxy compound with methoxy, C-H stretch (CH3-O-) in the case of S. cerevisiae and P. fermentans,
respectively (Abid et al. 2021). The absorption peak at 1628 cm⁻¹ was due to the stretch vibration of
carboxyl group (C = O) in S. cerevisiae. Peaks ranging from 1838 − 1221 cm⁻¹ represents primary amide C
= O, -CONH2 and secondary amide with N-H stretch bend in EPS produced by P. fermentans.
The absorption peaks ranging from 1011 to 1036 cm⁻¹ showed alkyl halide and stretching vibrations of
pyranose ring (Li et al. 2014). The peaks between 904 − 509 & 604 cm⁻¹ showed stretch of alkyl halides
Page 9/16and d (C-O-C) glyosidic linkage respectively (Pal and Sharma 2019).
4. Conclusion
In this study a system for simultaneous power generation and ethanol production was developed. The
study demonstrated ethanol production by Pichia fermentans and Saccharomyces cerevisiae, which
reached upto 4.7% and 5.6% v/v of the theoretical yield (6.41% (v/v)) respectively for 10% glucose in
yeast microbial fuel cell. Analysis of EPS showed the presence of polysaccharides, protein having several
functional groups like C = O, -CONH2, −CH3 and OH, of P. fermentans and S. cerevisiae. Another important
aspect of the present study is the application of P. fermentans for ethanol production in a fuel cell, which
was not explored yet. P. fermentans turned out as an efficient yeast for further microbial fuel cell
application.
Declarations
Ethics approval and consent to participate: Not Applicable
Consent for publication: Yes
Availability of data and materials: Not Applicable
Competing interests: Not Applicable
Funding: Not Applicable
Authors' contributions: AS performed the experimental work, analyses of data and prepared draft of the
manuscript. MP analysed the data, and writing of manuscript. RKS conceptualized and supervised the
work, and edited the manuscript.
Acknowledgements: Authors acknowledge Manipal University Jaipur for providing SEM and HPLC
facilities.
Authors' information: AS and MP hold M Sc in Microbiology and working as Ph D research scholars. RKS
is an Assistant Professor in the Department of Biosciences, Manipal University Jaipur and supervising
their Ph D.
References
1. Abid Y, Azabou S, Blecker C et al (2021) Rheological and emulsifying properties of an
exopolysaccharide produced by potential probiotic Leuconostoc citreum-BMS strain. Carbohydr
Polym 256:117523. https://doi.org/https://doi.org/10.1016/j.carbpol.2020.117523
2. Aditiya HB, Mahlia TMI, Chong WT et al (2016) Second generation bioethanol production: A critical
review. Renew Sustain Energy Rev 66:631–653. https://doi.org/10.1016/j.rser.2016.07.015
Page 10/163. Baig KS, Wu J, Turcotte G (2019) Future prospects of delignification pretreatments for the
lignocellulosic materials to produce second generation bioethanol. Int J Energy Res 43:1411–1427.
https://doi.org/https://doi.org/10.1002/er.4292
4. Bušić A, Mardetko N, Kundas S et al (2018) Bioethanol production from renewable raw materials and
its separation and purification: A review. Food Technol Biotechnol 56:289–311.
https://doi.org/10.17113/ftb.56.03.18.5546
5. Christwardana M, Frattini D, Accardo G et al (2018) Optimization of glucose concentration and
glucose/yeast ratio in yeast microbial fuel cell using response surface methodology approach. J
Power Sources 402:402–412. https://doi.org/10.1016/j.jpowsour.2018.09.068
6. Christwardana M, Frattini D, Duarte KDZ et al (2019) Carbon felt molecular modification and biofilm
augmentation via quorum sensing approach in yeast-based microbial fuel cells. Appl Energy
238:239–248. https://doi.org/10.1016/j.apenergy.2019.01.078
7. Chung Y, Ahn Y, Christwardana M et al (2016) Development of a glucose oxidase-based biocatalyst
adopting both physical entrapment and crosslinking, and its use in biofuel cells. Nanoscale 8:9201–
9210. https://doi.org/10.1039/c6nr00902f
8. dos Passos VF, Marcilio R, Aquino-Neto S et al (2019) Hydrogen and electrical energy co-generation
by a cooperative fermentation system comprising Clostridium and microbial fuel cell inoculated with
port drainage sediment. Bioresour Technol 277:94–103.
https://doi.org/https://doi.org/10.1016/j.biortech.2019.01.031
9. Flemming HC, Wingender J, Szewzyk U et al (2016) Biofilms: An emergent form of bacterial life. Nat
Rev Microbiol 14:563–575. https://doi.org/10.1038/nrmicro.2016.94
10. Flemming HC, Wuertz S (2019) Bacteria and archaea on Earth and their abundance in biofilms. Nat
Rev Microbiol 17:247–260. https://doi.org/10.1038/s41579-019-0158-9
11. Flimban SGA, Ismail IMI, Kim T, Oh SE (2019) Overview of recent advancements in the microbial fuel
cell from fundamentals to applications: Design, major elements, and scalability. Energies 12:3390.
https://doi.org/10.3390/en12173390
12. Geng BY, Cao LY, Li F et al (2020) Potential of Zymomonas mobilis as an electricity producer in
ethanol production. Biotechnol Biofuels 13:. https://doi.org/10.1186/s13068-020-01672-5
13. Jain A, Jain R, Jain S (2020) Quantitative Analysis of Reducing Sugars by 3, 5-Dinitrosalicylic Acid
(DNSA Method). pp 181–183. https://doi.org/10.1007/978-1-4939-9861-6_43
14. Kumar SS, Kumar V, Malyan SK et al (2019) Microbial fuel cells (MFCs) for bioelectrochemical
treatment of different wastewater streams. Fuel 254:115526.
https://doi.org/https://doi.org/10.1016/j.fuel.2019.05.109
15. Kwak S, Jo JH, Yun EJ et al (2019) Production of biofuels and chemicals from xylose using native
and engineered yeast strains. Biotechnol Adv 37:271–283.
https://doi.org/https://doi.org/10.1016/j.biotechadv.2018.12.003
16. Li W, Ji J, Chen X et al (2014) Structural elucidation and antioxidant activities of exopolysaccharides
from Lactobacillus helveticus MB2-1. Carbohydr Polym 102:351–359.
Page 11/16https://doi.org/10.1016/j.carbpol.2013.11.053
17. Liu CG, Xiao Y, Xia XX et al (2019) Cellulosic ethanol production: Progress, challenges and strategies
for solutions. Biotechnol Adv 37:491–504. https://doi.org/10.1016/j.biotechadv.2019.03.002
18. Mohd Azhar SH, Abdulla R, Jambo SA et al (2017) Yeasts in sustainable bioethanol production: A
review. Biochem Biophys Reports 10:52–61. https://doi.org/10.1016/j.bbrep.2017.03.003
19. Moradian JM, Fang Z, Yong Y-C (2021) Recent advances on biomass-fueled microbial fuel cell.
Bioresour Bioprocess 8:14. https://doi.org/10.1186/s40643-021-00365-7
20. Nam T, Son S, Kim E et al (2018) Improved structures of stainless steel current collector increase
power generation of microbial fuel cells by decreasing cathodic charge transfer impedance. Environ
Eng Res 23:383–389. https://doi.org/10.4491/eer.2017.171
21. Nandal P, Sharma S, Arora A (2020) Bioprospecting non-conventional yeasts for ethanol production
from rice straw hydrolysate and their inhibitor tolerance. Renew Energy 147:1694–1703.
https://doi.org/10.1016/j.renene.2019.09.067
22. Nisha M, Shankar M, Krishnan N et al (2016) Direct estimation of ethanol as a negative peak from
alcoholic beverages and fermentation broths by reversed phase-HPLC. Anal Methods 8:4762–4770.
https://doi.org/10.1039/c6ay01075j
23. Pal M, Sharma RK (2019) Exoelectrogenic response of Pichia fermentans influenced by mediator and
reactor design. J Biosci Bioeng 127:714–720. https://doi.org/10.1016/j.jbiosc.2018.11.004
24. Pal M, Sharma RK (2020) Development of wheat straw based catholyte for power generation in
microbial fuel cell. Biomass Bioenerg 138:. https://doi.org/10.1016/j.biombioe.2020.105591
25. Paul D, Noori MT, Rajesh PP et al (2018) Modification of carbon felt anode with graphene oxide-
zeolite composite for enhancing the performance of microbial fuel cell. Sustain Energy Technol
Assessments 26:77–82. https://doi.org/https://doi.org/10.1016/j.seta.2017.10.001
26. Prabhu A, Bosakornranut E, Amraoui Y et al (2020) Enhanced xylitol production using non-detoxified
xylose rich pre-hydrolysate from sugarcane bagasse by newly isolated Pichia fermentans.
Biotechnology for biofuels 13:1–15. https://doi.org/10.1186/s13068-020-01845-2
27. Rossi R, Fedrigucci A, Setti L (2015) Characterization of electron mediated microbial fuel cell by
Saccharomyces cerevisiae. Chem Eng Trans 43:337–342. https://doi.org/10.3303/CET1543057
28. Speranza B, Corbo MR, Campaniello D et al (2020) Biofilm formation by potentially probiotic
Saccharomyces cerevisiae strains. Food Microbiol 87:. https://doi.org/10.1016/j.fm.2019.103393
29. Stephens K, Bentley WE (2020) Synthetic Biology for Manipulating Quorum Sensing in Microbial
Consortia. Trends Microbiol 28:633–643. https://doi.org/10.1016/j.tim.2020.03.009
30. Tahir B, Mezori HA (2020) Bioethanol production from Quercus aegilops using Pichia stipitis and
Kluyveromyces marxianus. Biomass Convers Biorefinery. https://doi.org/10.1007/s13399-020-
00704-2
31. Walker G, Stewart G (2016) Saccharomyces cerevisiae in the Production of Fermented Beverages.
Beverages 2:30. https://doi.org/10.3390/beverages2040030
Page 12/1632. Yuan J, Liu S, Jia L et al (2020a) Co-Generation System of Bioethanol and Electricity with Microbial
Fuel Cell Technology. Energy Fuels 34:6414–6422. https://doi.org/10.1021/acs.energyfuels.0c00749
33. Yuan J, Liu S, Jia L et al (2020b) Co-Generation System of Bioethanol and Electricity with Microbial
Fuel Cell Technology. Energy Fuels 34:6414–6422. https://doi.org/10.1021/acs.energyfuels.0c00749
34. Zhang Z, Cao R, Jin L et al (2019) The regulation of N-acyl-homoserine lactones (AHLs)-based
quorum sensing on EPS secretion via ATP synthetic for the stability of aerobic granular sludge. Sci
Total Environ 673:83–91. https://doi.org/10.1016/j.scitotenv.2019.04.052
35. Zhao Z, Zhang Y (2019) Application of ethanol-type fermentation in establishment of direct
interspecies electron transfer: A practical engineering case study. Renew Energy 136:846–855.
https://doi.org/https://doi.org/10.1016/j.renene.2019.01.055
Figures
Figure 1
Open circuit voltage (a) and columbic efficiency (b) during MFC operation
Page 13/16Figure 2
Polarization curve of single chambered fuel cell with Saccharomyces cerevisiae; (a) Current density vs
Power density and (b) Current density vs Output voltage and with Pichia fermentans; (c) Current density
vs power density and (d) Current density vs Output voltage
Figure 3
Page 14/16Internal resistance of Pichia fermentans (a) and Saccharomyces cerevisiae (b) at different external loads
Figure 4
Glucose consumption and ethanol formation of (a) Pichia fermentans and (b) Saccharomyces cerevisiae
Figure 5
Scanning electron micrograph of biofilm formation on 10µm scale in Pichia fermentans; (a) carbon fibers
as control with no growth, (b) after 24 h, (c) on day 5, (d) on day 10, (e) on day 15 and in Saccharomyces
cerevisiae; (f) after 24 h, (g) on day 5, (h) on day 10, (i) on day 15
Page 15/16Figure 6
Cell biomass, EPS content and protein at different time interval for Pichia fermentans (a) and (b)
Saccharomyces cerevisiae
Supplementary Files
This is a list of supplementary files associated with this preprint. Click to download.
Graphicalabstract.pptx
SupplementFigures.pptx
Page 16/16You can also read