A source for the continuous generation of pure and quantifiable HONO mixtures - Recent
←
→
Page content transcription
If your browser does not render page correctly, please read the page content below

Atmos. Meas. Tech., 15, 627–637, 2022
https://doi.org/10.5194/amt-15-627-2022
© Author(s) 2022. This work is distributed under
the Creative Commons Attribution 4.0 License.

A source for the continuous generation of pure and
quantifiable HONO mixtures
Guillermo Villena and Jörg Kleffmann
Department of Physical and Theoretical Chemistry, School of Mathematics and Natural Sciences,
University of Wuppertal, 42097 Wuppertal, Germany

Correspondence: Jörg Kleffmann (kleffman@uni-wuppertal.de)

Received: 13 October 2021 – Discussion started: 3 November 2021
Revised: 10 January 2022 – Accepted: 12 January 2022 – Published: 8 February 2022

Abstract. A continuous source for the generation of pure            former studies. A standard deviation between all measured
HONO mixtures was developed and characterized, which                and theoretical HONO concentrations of only ±3.8 % was
is based on the Henry’s law solubility of HONO in acidic            observed, and a conservative upper-limit accuracy of the
aqueous solutions. With the help of a peristaltic pump,             HONO concentration of better 10 % is estimated. Thus, for
diluted nitrite and sulfuric acid solutions are mixed in a          the first time, a stable HONO source is developed which can
temperature-controlled stripping coil, which is operated with       be used for the absolute calibration of HONO instruments.
pure nitrogen or synthetic air at gas flow rates of 0.5–
2 L min−1 . Caused by the acidic conditions of the aque-
ous phase (pH ≈ 2.5), nitrite is almost completely converted
into HONO, which partitions to the gas phase limited by             1   Introduction
its known solubility in water. The source shows a fast time
response of ∼ 2 min (0 %–90 %) at higher concentrations             Nitrous acid (HONO) is an important trace gas in the at-
and an excellent long-term stability (2σ noise < 1 %). The          mosphere which represents a major source of the OH rad-
HONO emission of the source perfectly correlates with the           ical (Kleffmann et al., 2005; Acker et al., 2006; Ma et al.,
nitrite concentration from the sub-ppb range up to 500 ppb.         2013; Michoud et al., 2014; Gu et al., 2020), the detergent
The rate of NOx formation increases quadratically with the          of the atmosphere. In addition, HONO and its reaction prod-
HONO concentration from non-detectable values at atmo-              ucts show mutagenic and carcinogenic properties (Pitts et al.,
spheric relevant HONO concentrations reaching a NOx con-            1978; Kirchner and Hopkins, 1991), which is especially im-
tent of 1.6 % at 500 ppb. A general equation based on Henry’s       portant for indoor conditions, for which much higher levels
law is developed, whereby the HONO concentration of the             of up to 90 ppb compared to the ambient atmosphere have
source can be calculated using measured experimental pa-            been observed (Večeřa and Dasgupta, 1994).
rameters, i.e. nitrite concentration, liquid flow rates, gas flow      The sources of HONO in the atmosphere are contro-
rate, pH of the solution, and temperature of the stripping          versially discussed (Kleffmann, 2007), and among others,
coil. In the equation, the known Henry’s law constant of            photochemical heterogeneous reactions have been proposed
HONO in sulfuric acid solutions is used. For the calcula-           to explain unexpectedly high HONO concentrations during
tion of the effective Henry’s law constant, the acid disso-         daytime (Stemmler et al., 2006; Zhou et al., 2011). How-
ciation equilibrium of HONO / nitrite is used as a variable         ever, the accuracy of the daytime HONO data was often
to adjust the theoretical HONO concentration to the mea-            doubted, for which spectroscopic instruments are often not
sured values. From the average of all experimental data the         sensitive enough, while wet-chemical instruments may suffer
equilibrium of HONO / nitrite is described well by pKa =            from chemical interferences (Kleffmann and Wiesen, 2008).
1021.53/T − 0.449. The pKa of 3.0 ± 0.1 (1σ ) at 25 ◦ C is          Thus, the development of sensitive and selective HONO in-
in good agreement with the range of 2.8–3.28 published in           struments is still of high interest, for which a stable and pure
                                                                    HONO source is very helpful. Such a HONO source should

Published by Copernicus Publications on behalf of the European Geosciences Union.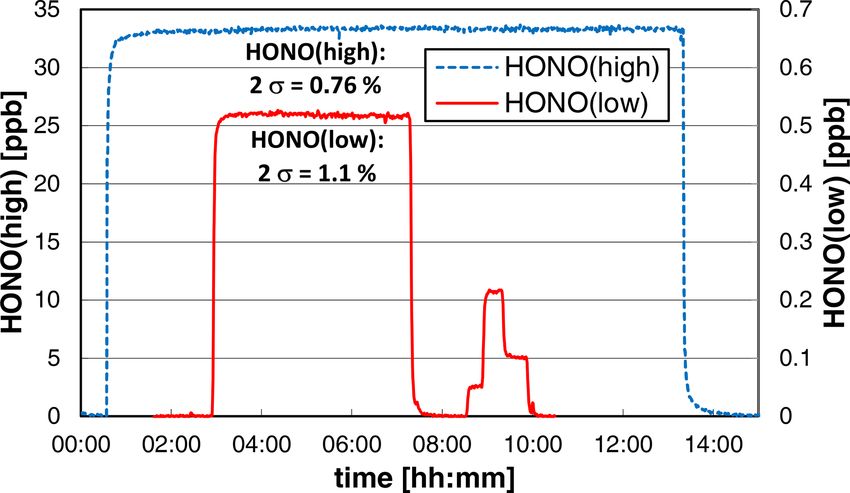
628 G. Villena and J. Kleffmann: A pure and quantifiable HONO source
ideally be simple in operation, produce HONO mixtures with are mixed in a temperature-controlled bubbler-type reactor
high purity and stability, cover a wide range of concentra- while flushed with synthetic air. The HONO concentration
tions, and also produce predictable HONO concentrations of the source can be adjusted simply by changing the con-
for the calibration of HONO instruments in the field when centration of the aqueous nitrite solution. In contrast, for the
other calibration methods are not available. Several attempts source by Febo et al. (1995), variations of the temperature
have been made in the past to produce HONO mixtures in and the concentration of the liquid HCl in the permeation
the laboratory and in the field. In the first studies, simply the source are required, which is more complicated and time-
equilibrium between nitrogen oxides (NO + NO2 ) and water consuming. Finally, the source of Taira and Kanda (1990)
vapour was used to generate HONO (Wayne and Yost, 1951): was optimized by using a temperature-controlled stripping
coil reactor, leading to even higher simplicity and stability,
NO + NO2 + H2 O
2HONO. (R1) faster time response, and lower NOx formation (Kleffmann
et al., 2004). The source was later commercialized (QUMA
However, Reaction (R1) is never quantitative, and the pu- Elektronik & Analytik GmbH), and its prototype is in regu-
rity of HONO is typically lower than 50 %. Accordingly, lar use in our laboratory and for the characterization of dif-
other methods were developed which are mainly based on ferent HONO instruments (e.g. Jurkat et al., 2011; Ródenas
different acid displacement reactions, for example using ox- et al., 2013). However, in addition to the very little informa-
alic acid (Braman and de la Cantera, 1986), tion given in Kleffmann et al. (2004), the source was never
NaNO2 + H2 C2 O4 → HONO + NaHC2 O4 ; (R2) explained in detail. Caused by the increasing general interest
in the chemistry of HONO and in the development of sim-
sulfuric acid (Taira and Kanda, 1990), ple HONO sources during the last years (e.g. Gingerysty and
Osthoff, 2020; Lao et al., 2020), the aim of the present study
NaNO2 + H2 SO4 → HONO + NaHSO4 ; (R3) was to characterize the source in more detail and also to ap-
ply Henry’s law for its theoretical quantification for use in
or hydrochloric acid (Febo et al., 1995), the standalone calibration of HONO instruments.
NaNO2 + HCl → HONO + NaCl. (R4)
In addition to the acid displacement, Večeřa and Das- 2 Experimental
gupta (1991) developed a source where the thermal decom-
position of ammonium nitrite was used: 2.1 HONO source
NH4 NO2 → HONO + NH3 . (R5) The set-up of the source is shown in Fig. 1. Nitrogen (N2 )
from the evaporation of 99.999 % pure liquid nitrogen (al-
The purity of the latter source is however low, caused by ternatively also synthetic air can be used) controlled by a
the equimolar formation of HONO and NH3 . The different 2 L min−1 flow controller (Bronckhorst) is passed through a
types of sources used in various studies were recently sum- temperature controller stripping coil (2.4 mm i.d. glass tube,
marized in Table 1 of Gingerysty and Osthoff (2020). 25 turns, 20 mm turn diameter) with gas flow rates in the
In the most recent studies, the acid displacement using range 0.5–2 L min−1 . The temperature of the stripping coil
HCl was applied (Ren et al., 2010; Reed et al., 2016; Gin- is controlled in the range 5–20 ◦ C by a compact liquid ther-
gerysty and Osthoff, 2020; Lao et al., 2020); these are all mostat (QUMA, Peltier type) and a thermoelement, which
based on the pioneering study of Febo et al. (1995). Gaseous was calibrated by a certified Hg thermometer. The maxi-
HCl is produced by any kind of permeation source and after mum temperature of the stripping coil is limited to a few
humidification reacts heterogeneously with solid sodium ni- degrees Celsius below room temperature. If higher temper-
trite. After careful optimization, high purity and a large con- atures are used, water will condensate in the PFA (perfluo-
centration range from ppb to ppm levels can be obtained by roalkoxy alkanes) lines (4 mm i.d.). For most experiments,
the source (Febo et al., 1995). However, when using HCl un- the source was operated at the nominal instrument set point
der dry conditions or at low relative humidity, there is al- of 15 ◦ C, which represents a real calibrated temperature of
ways a risk of the undesired formation of ClNO. In addi- 15.9 ◦ C.
tion, unreacted HCl may occur when the sodium nitrite reac- In the stripping coil, the gas phase comes into contact
tor is not working properly (Gingerysty and Osthoff, 2020). with a mixture of diluted nitrite and H2 SO4 solutions. Ex-
For this reason, we used this source only for a short pe- cept for the study of the pH dependence, a 3.6 mM H2 SO4
riod in our laboratory (Brust et al., 2000) and later switched solution was used, for which 2 mL of a 1/10 diluted H2 SO4
to the experimentally much simpler source from Taira and (Aldrich p.a., 95 %–98 %) was diluted to 1 L with pure wa-
Kanda (1990), for which the above-mentioned by-product ter. Diluted nitrite solutions (0.001–10 mg L−1 ) were made
formation is completely absent when using the non-volatile from a 1000 mg L−1 standard stock solution (Merck Titrisol)
H2 SO4 . In the source, diluted nitrite and H2 SO4 solutions by dilution with volumetric pipettes and flasks. If nitrite con-
Atmos. Meas. Tech., 15, 627–637, 2022 https://doi.org/10.5194/amt-15-627-2022
G. Villena and J. Kleffmann: A pure and quantifiable HONO source                                                               629

Figure 1. Picture of the HONO source (QUMA) and its experimental set-up.

centrations ≥ 0.1 mg L−1 are used, these solutions are sta-         strument (Villena et al., 2011) was also used during the con-
ble for weeks when stored in the dark. For lower concentra-         centration dependency.
tions daily preparation is recommended. The pH of the com-             The HONO mixture from the source was guided by PFA
bined solutions of ∼ 2.5 collected from the waste channel           lines (4 mm i.d.) to the different instruments. The excess flow
of the instrument was measured by a calibrated pH meter             passed a humidity and temperature sensor (HYTELOG USB,
(HANNA instruments, HI8314 membrane pH meter). The                  HYGROSENS Instruments GmbH, accuracy of ±2 % RH)
liquid flow rates of the two reagent solutions and of the           to also measure the dew point of the gas phase. Caused by
waste are controlled by an eight-channel peristaltic pump           this set-up, the lower gas flow rate of the HONO source ap-
(Ismatec) using each 0.51 mm i.d. peristaltic-pump tubing           plied in the present study was limited by the flow rate of the
for the nitrite and H2 SO4 solutions and a 1.14 mm i.d. tub-        chemiluminescence instrument (1 L min−1 ).
ing for the waste (Ismaprene, PharMed® , three stopper, life-
time of 2 × 1000 h), respectively. The peristaltic pump can
be operated from 8–40 rpm, and the liquid flow rates were           3      Results
measured by the time to fill 5 mL volumetric flasks. The liq-
                                                                    At HONO mixing ratios higher than 100 ppb significant for-
uid flow rate of a peristaltic pump is typically decreasing by
                                                                    mation of NOx was observed (see below Sect. 3.2), which
∼ 20 % during the lifetime of the tubes and should be mea-
                                                                    is caused by the decomposition of HONO; see the back-
sured when the theoretical HONO concentrations are calcu-
                                                                    reaction of equilibrium (R1). In agreement with the stoi-
lated. All components described above including plastic bot-
                                                                    chiometry of the reaction, the NO2 concentration measured
tles for the reagents (2 × 0.5 L) and the waste (1 L) are in-
                                                                    by the NO2 LOPAP instrument was found to be similar to
stalled in a 19 in. (48.62 cm) rack housing (see Fig. 1).
                                                                    the NO concentration measured by the chemiluminescence
                                                                    instrument. Thus, for simplicity, the NOx level of the HONO
2.2   Other analytical equipment                                    source was calculated by doubling the measured NO sig-
                                                                    nal. The HONO concentration measured by the chemilu-
                                                                    minescence monitor was then determined by the difference
For the measurement of HONO and NOx a chemilumines-                 between [NOy ] and 2 × [NO]. The calculated HONO con-
cence NOx monitor (ECO PHYSICS, nCLD SL899) with a                  centrations agreed well with those from the HONO LOPAP
molybdenum converter was used. The instrument has a de-             instrument in between the experimental errors of both in-
tection limit of ∼ 30 ppt at a sample flow rate of 1 L min−1        struments. During a concentration dependency experiment in
and was daily calibrated by a certified NO calibration mix-         the range 0–100 ppb (see Sect. 3.2) both instruments showed
ture (410 ppb NO, Messer) with an accuracy of 3 %. While            an excellent linear correlation (R 2 = 0.9995) and agreement
the instrument is very selective for the detection of NO, all       (slope LOPAP instrument against the ECO PHYSICS in-
other reactive nitrogen species (NOy ), i.e. for the present        strument: 0.972). Since the accuracy of the ECO PHYSICS
study NO2 and HONO, are quantitatively measured in the              instrument is slightly higher (3 %) than that of the HONO
NOx channel of the instrument (Villena et al., 2012). Quan-         LOPAP instrument (5 %), the chemiluminescence HONO
titative NO2 conversion was assured by the replacement of           data were further used for the characterization of the HONO
the molybdenum converter during the annual maintenance              source. Only for one low-concentration experiment (see
of the instrument just a week before the experiments and            Sect. 3.6) were the HONO LOPAP data shown.
was also verified with an O3 titration unit (Anysco GPT; gas
phase titration). Quantitative conversion of HONO to NO             3.1     pH dependence
was demonstrated by comparison with an HONO LOPAP
instrument (long-path absorption photometer; Heland et al.,         The effective solubility of HONO in an aqueous solution is
2001; Kleffmann et al., 2002). To confirm that HONO de-             limited by different processes. First, the solubility of undis-
composes to NO and NO2 at an equimolar ratio according              sociated HONO is described by Henry’s law:
to the back-reaction of equilibrium (R1), an NO2 LOPAP in-

https://doi.org/10.5194/amt-15-627-2022                                                 Atmos. Meas. Tech., 15, 627–637, 2022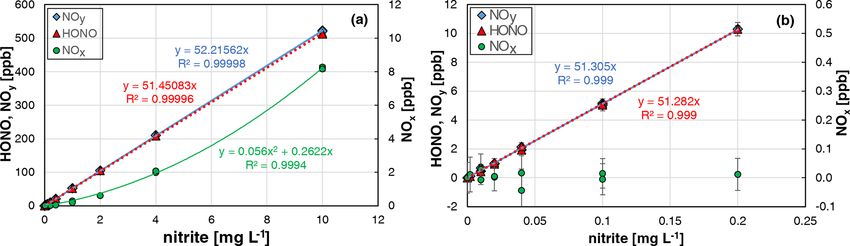
630 G. Villena and J. Kleffmann: A pure and quantifiable HONO source
clq.
KH = , (1)
pg
where clq. is the liquid concentration (mol L−1 ) and pg is
the gas phase partial pressure of HONO (atm). In former
studies, consistent values of the Henry’s law constant KH
(mol L−1 atm−1 ) were observed (e.g. Park and Lee, 1988;
Becker et al., 1996). Second, since H2 SO4 solutions were
used in the present study, the salting-out effect of the weak
acid HONO by the strong acid H2 SO4 has to be considered.
Thus, for the HONO–H2 SO4 system the solubility data from
the former study of Becker et al. (1996) were used, which Figure 2. Dependence of the HONO mixing ratio and the
agreed well with the results from Park and Lee (1988) for NOx / HONO ratio on the pH of the NO− 2 –H2 SO4 reaction mix-
pure water. Furthermore, considering that only a moderate − −1
ture (NO2 = 1 mg L ; T = 15.9 C, φg ◦ ∅, dry
= 1570 cm3 min−1 ,
acidity of the reaction mixture was finally used (pH ≈ 2.5; 20 rpm). In addition, the theoretical HONO mixing ratios calculated
see below), the added nitrite is still not completely converted by Eq. (3) (see Sect. 4.2) are also shown, for which pKa = 3.16 was
into undissociated HONO in the aqueous phase, caused by used (weighted average of all shown data at pH > 2.4). The y error
the pH-dependent acid dissociation equilibrium: bars represent the precision errors (2σ ), which are only visible for
the NOx / HONO ratio but smaller than the size of the symbols for
HONO
NO− +
2 +H . (R6) HONO and NOy . The x error bars represent the accuracy of the pH
To quantitatively describe equilibrium (R6), pKa values in measurements.
the range 2.8–3.26 have been published in former studies
(Park and Lee, 1988; Riordan et al., 2005; da Silva et al.,
2006). Considering this equilibrium, the effective Henry’s agreement between measured and theoretical values only for
law constant KH,eff. (mol L−1 atm−1 ) is given by pH > 2. In contrast, at higher acidity, measured pH values
Ka
were significantly higher than theoretically expected, which
KH,eff. = KH 1 + , (2) is a known problem when using pH electrodes (Bates, 1973).
cH+
Thus, the theoretical and not the experimental pH values
where the H+ concentration cH+ (mol L−1 ) is calculated were used for pH < 2 in Fig. 2. For the calculation of the the-
from the measured pH of the combined solutions (waste). oretical pH, the acid concentration was used, and reasonable
Since the acid dissociation constant has a significant uncer- quantitative dissociation of the strong H2 SO4 was assumed.
tainty, we used the pKa as an unknown variable to adjust the Furthermore, according to the study by Riordan et al. (2005)
theoretical HONO concentrations (see Eq. 3, Sect. 4.2) to a second equilibrium between HONOaq. and H2 ONO+ aq. at
the experimental values. When using all experimental data at pH < 2 could lead to a higher effective solubility compared
pH > 2.4 and excluding the temperature dependence, an av- to undissociated HONO. However, in the former study of
erage pKa = 3.09 ± 0.12 (1σ ) was determined at the typical Becker et al. (1996), the equilibrium between HONO and
used temperature of 15.9 ◦ C. When the temperature depen- NO+ was observed at much higher acidity around 55 wt %,
dence was also considered (see Sect. 3.5), the equilibrium is which was in good agreement with a former study by Seel
described well by pKa = 1021.53/T − 0.449 in the exper- and Winkler (1960). Thus, any increasing effective solubil-
imental temperature range (5.4–18.6 ◦ C). The resulting pKa ity by the formation of H2 ONO+ –NO+ should not be of
of 3.0 ± 0.1 (1σ ) at 25 ◦ C is in good agreement with the range importance in the pH range 0–2. Finally, liquid phase diffu-
of 2.8–3.28 published in former studies (Park and Lee, 1988; sion in the stripping coil could limit the experimental HONO
Riordan et al., 2005; da Silva et al., 2006). emission with increasing viscosity of the H2 SO4 solutions at
When the pH of the solution was varied, an excellent concentrations up to 2.7 wt % used, leading to lower HONO
agreement between theoretical (see Sect. 4.2) and experi- concentrations than theoretically expected from the thermo-
mental HONO concentrations was observed only for pH val- dynamic equilibrium. In contrast, in the study by Becker et
ues > 2.4. For lower pH values, significantly lower HONO al. (1996), on which Eq. (3) is based, a bubbler set-up was
concentrations were observed in comparison with the values used under thermodynamic equilibrium.
calculated with Eq. (3) (see Fig. 2). Reasons for this discrep- Since our focus was not the exact study of the system
ancy are still unclear and could not be explained by the in- N(III) in sulfuric acid solutions but the development of a
creasing rate of NOx formation with decreasing pH, as even HONO source, we did not further investigate this issue in
the measured NOy concentration was lower than the theoret- detail but simply limited the acidity to pH ≥ 2.4. For these
ical HONO concentration (see Fig. 2). One potential prob- conditions, the pH measurements were accurate; the theoret-
lem could be the pH measurements, which showed excellent ical and experimental HONO concentrations agreed well; a
Atmos. Meas. Tech., 15, 627–637, 2022 https://doi.org/10.5194/amt-15-627-2022
G. Villena and J. Kleffmann: A pure and quantifiable HONO source                                                                 631

potential equilibrium of HONO and H2 ONO+ is still not sig-
nificant (Riordan et al., 2005); and the unwanted NOx forma-
tion is still small (see Fig. 2). The pH should however also not
be too high (i.e. > 3), since the uncertainties in the theoretical
HONO concentrations increase at higher pH values, caused
by the incomplete conversion of the added nitrite to HONO;
see equilibrium (R6). Thus, for the present HONO source an
acidity of the reaction mixture of pH ≈ 2.5 is recommended.

3.2   Concentration dependence

The dependence of the added nitrite concentration on the
HONO mixing ratio was studied in two different experi-
                                                                     Figure 3. NO and HONO concentrations of the HONO source
ments and by two different operators of the source. The ex-
                                                                     (logarithmic scale) for variable nitrite concentrations (numbers
perimental data from one experiment are shown in Fig. 3,             in the figure in mg L−1 ). The HONO signal of the chemilumi-
for which the nitrite concentration was varied by several or-        nescence instrument shows significant tailing for zero measure-
ders of magnitude (0.002–10 mg L−1 ). The source showed a            ments, which follow high HONO concentrations (see last zero).
very fast time response of ∼ 2 min (0 %–90 %) for HONO                                                       ∅, dry
                                                                     Experimental conditions: T = 15.9 ◦ C, φg      = 2104 cm3 min−1 ,
concentrations > 20 ppb increasing to 6–7 min at lower con-          20 rpm, pH = 2.48.
centrations at a liquid pump speed of 20 rpm. The increas-
ing time response at low HONO levels is explained by ad-
sorption/desorption of HONO on the surfaces behind the               NOx formation was observed in between the experimental er-
HONO source, which gets less important with increasing               rors. Only at higher HONO levels, did NOx quadratically in-
HONO levels, leading to faster saturation of the surfaces.           crease with the HONO concentration (see Fig. 4a), in agree-
From the experiment shown in Fig. 3, we conclude that most           ment with the expected second-order kinetic behaviour of
of this adsorption/desorption took place on the surfaces of          the back-reaction of equilibrium (R1). But even at 500 ppb
the chemiluminescence instrument used (inlet particle fil-           HONO, a NOx content of only 1.6 % was observed, which
ter, stainless-steel lines) and not on the PFA transfer lines.       is significantly lower than in the original bubbler set-up of
At 16:09 local time (LT) the HONO source was switched                Taira and Kanda (1990). Thus, the HONO source can be op-
from reagents to pure water, for which the HONO emissions            erated for mixing ratios up to 500 ppb and up to 20 ppb with
should quickly decrease to zero. However, after a first fast         purities of > 98 % and > 99.8 %, respectively. In addition,
decrease of the HONO concentration there was a significant           the excellent agreement of the HONO and NOx data for the
tailing of the signal. Here the slope of the decreasing sig-         two completely independent experiments performed by two
nal did not change when the HONO source was replaced by              different operators including different NOx calibration and
pure nitrogen at 16:59 LT. This can only be explained when           dilution of the nitrite stock solution (see Fig. 4) demonstrates
the tailing is caused by desorption of HONO from the sur-            the high precision and reproducibility of the HONO source
faces of the chemiluminescence instrument, as all other PFA          (see also Sect. 3.6).
surfaces were removed. This conclusion is also confirmed by
the LOPAP data, for which a time response of only 4 min was          3.3   Gas flow rate dependence
observed at low mixing ratios in the range 0.05–0.5 ppb (see
Sect. 3.6 and Fig. 8). Since this time response is similar to the    The used stripping coil can be operated at gas flow rates
one of the LOPAP instrument under the experimental condi-            in the range 0.5–2 L min−1 . However, caused by the sample
tions applied, the time response of the HONO source will be          flow rate of the chemiluminescence instrument of 1 L min−1 ,
≤ 4 min, in agreement with the high-concentration data. The          only gas flow rates in the range 1–2 L min−1 were investi-
proposed adsorption of HONO mainly on the metal surfaces             gated. The HONO concentration was decreasing with the gas
of the chemiluminescence instrument at low HONO levels is            flow rate (see Fig. 5), which can be explained by the increas-
also in agreement with our experience with pure HONO mix-            ing dilution of the formed HONO in the increasing gas vol-
tures, for which adsorption losses in PFA transfer lines of up       ume.
to 20 m length were found to be insignificant.                          Furthermore, a decreasing NOx content with increasing
   When all HONO data from the two experiments were plot-            gas flow rate was observed, which is explained by the de-
ted against the nitrite concentration, an excellent linear corre-    creasing reaction time of HONO in the stripping coil and the
lation (R 2 = 0.99996) was observed. Similar slopes were ob-         heterogeneous decomposition of HONO (back-reaction of
served when using all HONO data up to 500 ppb (see Fig. 4a)          equilibrium R1, second-order kinetics). Thus, for increasing
compared to mixing ratios only up to 10 ppb (see Fig. 4b).           the purity of the source, it should be operated at gas flow rates
At typical atmospheric HONO mixing ratios < 20 ppb, no               > 1.5 L min−1 . If lower flow rates are necessary, the HONO

https://doi.org/10.5194/amt-15-627-2022                                                   Atmos. Meas. Tech., 15, 627–637, 2022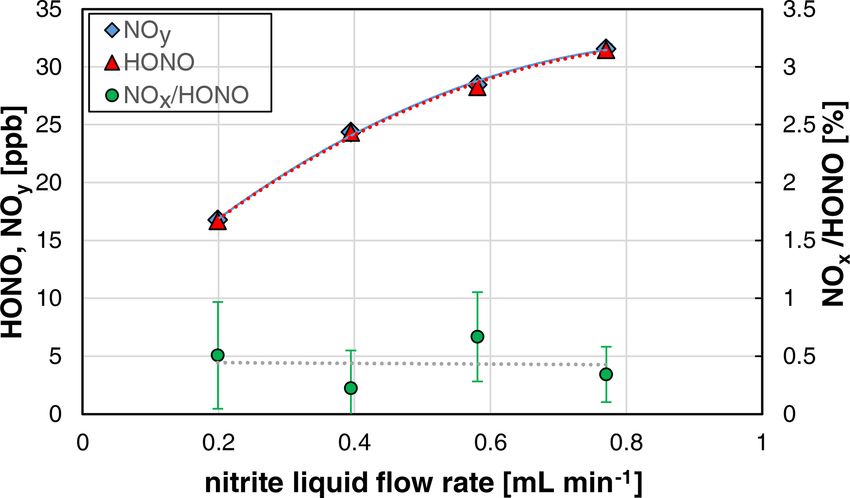
632                                                        G. Villena and J. Kleffmann: A pure and quantifiable HONO source

Figure 4. Nitrite concentration dependence of NOy , HONO, and NOx formation of the HONO source for two independent ex-
periments. (a) All data including the data shown in Fig. 3; (b) same data for nitrite concentrations ≤ 0.2 mg L−1 (T = 15.9 ◦ C,
  ∅, dry
φg       = 2104 cm3 min−1 , 20 rpm, pH = 2.45 and 2.48). The error bars represent the 2σ precision errors, which are smaller than the size of
the symbols in (a).

Figure 5. Gas flow rate dependence of NOy , HONO, and the                Figure 6. Nitrite liquid flow rate dependence (10, 20, 30,
NOx / HONO ratio of the HONO source (NO−                         −1
                                                     2 = 0.4 mg L ,      and 40 rpm of the peristaltic pump) of NOy , HONO, and the
          ◦
T = 15.9 C, 20 rpm, pH = 2.47). The error bars represent the pre-        NOx / HONO ratio of the HONO source (NO−                 −1
                                                                                                                      2 = 0.4 mg L ,
cision errors (2σ ), which are only visible for the NOx / HONO ratio                     ∅, dry
but smaller than the size of the symbols for HONO and NOy .              T = 15.9 ◦ C, φg      = 1570 cm3 min−1 , pH = 2.47). The error
                                                                         bars represent the precision errors (2σ ), which are only visible for
                                                                         the NOx / HONO ratio but smaller than the size of the symbols for
                                                                         HONO and NOy .
levels should be reduced to mixing ratios < 10 ppb, caused
by the quadratic dependence of the NOx formation with the
HONO mixing ratio; see Sect. 3.2. The time response of the
source was found to be independent of the gas flow rate.                 only occurs on the surface of the stripping coil, which is not
                                                                         affected by the liquid flow rate. In contrast, if the decompo-
3.4   Liquid flow dependence                                             sition of HONO proceeded via a liquid phase reaction, the
                                                                         NOx content should increase with the liquid flow rate. As
Since the amount of nitrite pumped into the stripping coil is            expected, the time response of the source was observed to
directly proportional to the liquid flow rate, the speed of the          decrease with the liquid flow rate, which can be explained by
liquid peristaltic pump was varied in the range 10–40 rpm. As            faster liquid exchange in the stripping coil.
expected, the HONO mixing ratios increased with the liquid
flow rate (see Fig. 6). However, the increase was found to be            3.5   Temperature dependence
non-linear, since at higher liquid flow rates the liquid volume
in the stripping coil also increases. Thus, an increasing con-           Since the solubility of HONO is temperature dependent (Park
tent of nitrite / HONO remains in the liquid phase according             and Lee, 1988), also the temperature of the stripping coil was
to Henry’s law.                                                          varied in the range 5.4–18.6 ◦ C. The maximum temperature
   No significant impact of the NOx formation on the liq-                of the stripping coil is limited to a few degrees Celsius be-
uid flow was observed (see Fig. 6). This could be explained              low the laboratory temperature to exclude condensation of
by the heterogeneous back-reaction of equilibrium (R1) that              water on surfaces behind the stripping coil. Here, a strong

Atmos. Meas. Tech., 15, 627–637, 2022                                                        https://doi.org/10.5194/amt-15-627-2022
G. Villena and J. Kleffmann: A pure and quantifiable HONO source                                                                    633

Figure 7. Temperature dependence of NOy , HONO, and the                Figure 8. Stability tests of the HONO source at different
NOx / HONO ratio of the HONO source (NO−              −1               HONO mixing ratios. On the left axis the chemiluminescence
                                          2 = 0.8 mg L ,               data of a high-concentration experiment (NO−            −1
 ∅, dry                                                                                                            2 = 0.8 mg L ,
φg      = 1570 cm3 min−1 , 20 rpm, pH = 2.46). The y error bars                        ∅, dry
represent the precision errors (2σ ), which are only visible for the   T = 15.9 ◦ C, φg      = 1570 cm3 min−1 , 10 rpm, pH = 2.47)
NOx / HONO ratio but smaller than the size of the symbols for          and on the right axis the LOPAP data at lower concentra-
HONO and NOy . Accuracy errors of the temperature of ±0.3 ◦ C          tions (NO−                                   −1         ◦
                                                                                   2 = 0.01 (0.001/0.004/0.002) mg L , T = 15.9 C,
                                                                        ∅, dry
are also shown.                                                        φg     = 2104 cm3 min−1 , 20 rpm, pH = 2.54) are shown. For
                                                                       zero measurements the source was operated under water.

fluctuation of the HONO concentration was observed when
the source was operated close to the dew point of water. The           (see Fig. 8). However, caused by the lower HONO level ap-
lower temperature limit is given by the power of the Peltier           plied, the much more sensitive LOPAP technique was used
cooler of the source. Besides the HONO levels, also the ab-            for quantification. The LOPAP instrument had a detection
solute humidity of the gas phase can be varied by the temper-          limit of 2 ppt and a precision of 1.0 % for the experimen-
ature of the stripping coil (see the Clausius–Clapeyron rela-          tal conditions applied, explaining the slightly lower preci-
tion).                                                                 sion of the data. In good agreement with the results shown
   As expected from the known solubility data (Park and                in Sect. 3.2, an excellent linear correlation of the HONO
Lee, 1988; Becker et al., 1996), the HONO concentration                mixing ratio with the nitrite concentration was also observed
of the source was found to increase with the temperature               (R 2 = 0.9997) in the very low-concentration range of 0.05–
(see Fig. 7). In contrast, the NOx content of the source               0.5 ppb (see Fig. 8). The two experiments show that the pre-
was slightly decreasing with the temperature, which was not            cision of the HONO source does not depend on the HONO
caused by decreasing absolute NOx concentrations but by the            concentration in agreement with the used concept of the
increasing HONO levels.                                                source. The variability of the HONO emission only depends
   Similar to the other experiments, the theoretical HONO              on the mixing of the two reagents at the inlet of the stripping
concentrations calculated by Eq. (3) (see Sect. 4.2) were ad-          coil (see Fig. 1) and the stabilities of the gas and liquid flows.
justed to the measured values by varying the pKa for acid              These parameters will not change with the nitrite concentra-
dissociation, equilibrium (R6), leading to a decreasing pKa            tion.
with increasing temperature; for the quantitative description,            With the reduced liquid flow rate and using the internal
see Sect. 3.1.                                                         liquid containers of the instrument, the source can be con-
                                                                       tinuously operated for ∼ 43 h. If longer operation is neces-
3.6   Stability test                                                   sary, 5 L (nitrite, H2 SO4 ) and 10 L (waste) liquid bags could
                                                                       be used. However, for such long periods the liquid flow rate
To test the long-term stability and precision, the source was          of a peristaltic pump typically slightly decreases with time,
operated overnight at constant experimental conditions at a            leading to some expected drift of the HONO source. In this
low liquid pump speed of 10 rpm, leading to reduced liquid             case, the liquid flow rates (nitrite, waste) should be regularly
consumption and a time response (0 %–90 %) of the source               measured and included in the calculation of the theoretical
of ∼ 4 min. At high HONO mixing ratios of ∼ 33 ppb, the                HONO concentration; see Sect. 4.2.
precision of the source was < 1 % (2σ noise: 0.76 %); see
Fig. 8. This high precision is similar to the precision of the
chemiluminescence instrument used to quantify the HONO
source. Thus, the given precision error of the source is even
an upper limit. When a much lower mixing ratio of ∼ 0.5 ppb
was used, almost the same precision of 1.1 % was obtained

https://doi.org/10.5194/amt-15-627-2022                                                     Atmos. Meas. Tech., 15, 627–637, 2022
634                                                       G. Villena and J. Kleffmann: A pure and quantifiable HONO source

4     Discussion                                                           easily made with high accuracy by the dilution of a
                                                                           stock solution using volumetric pipettes and flasks. In
4.1    General considerations                                              contrast, for the source of Febo et al. (1995), different
                                                                           concentrated HCl solutions and HCl temperatures have
In the present study a new HONO source was developed and                   to be used to adjust the output of the source, which is
characterized. In contrast to most recent studies (Ren et al.,             much more difficult and time-consuming. Dilution of
2010; Reed et al., 2016; Gingerysty and Osthoff, 2020; Lao                 the source by synthetic air and using flow controllers
et al., 2020), HONO is produced by the reaction of nitrite                 is not recommended, due to the decreasing precision
and H2 SO4 in the liquid phase. In a stripping coil reactor,               of the source and the resulting variable humidity. The
HONO partitions to the gas phase according to its known                    latter can be a problem when a humidity-dependent
moderate solubility in acidic solutions. The advantage of us-              HONO instrument is characterized, e.g. when the CIMS
ing H2 SO4 is the missing formation of unwanted by-products                (chemical ionization mass spectrometer) technique is
like HCl and ClNO as observed in HONO sources using the                    used (Jurkat et al., 2011). In contrast, for the present
volatile HCl, which are based on the original concept of Febo              source, variable HONO concentrations are obtained for
et al. (1995). While these sources can be carefully optimized              constant humidity.
for low by-product formation (Febo et al., 1995; Gingerysty
and Oshoff, 2020; Lao et al., 2020), the use of the non-               – The high purity of the source. For HONO mixing ratios
volatile H2 SO4 completely excludes the still existing risk of           < 20 ppb, no NOx formation and a purity of > 99.8 %
any malfunction of the source. For example, when the Febo                are observed. And even at high HONO levels of 500 ppb
et al. (1995) source was used in our laboratory 2 decades ago            the purity of the source is > 98 %. In contrast, for other
(Brust et al., 2000), we often had problems related to the ho-           recent HONO sources only purities > 95 % and > 90%
mogeneous mixing of the solid NaNO2 and the use of low                   were observed, respectively (Gingerysty and Osthoff,
relative humidity, leading to a lower purity of HONO.                    2020; Lao et al., 2020).
   Further advantages of the new HONO source are as fol-
lows:                                                                  – The high long-term stability and precision of the source.
                                                                         After stabilization, an upper-limit 2σ precision of the
    – The high time response (0 %–90%) of 1.5–7 min de-
                                                                         source of 0.76 % was observed, which is similar to the
      pending on the liquid flow rates and the HONO con-
                                                                         precision error of the used NOx instrument.
      centration levels used. For a typical pump speed of
      20 rpm and HONO levels > 20 ppb, a time response of              – The wide variability of the experimental conditions.
      2 min was observed. In contrast, the sources of Taira              Here, the liquid and gas flow rates and the tempera-
      and Kanda (1990) and Febo et al. (1995) show much                  ture can be varied, leading, for example, to variable hu-
      longer time responses. Even when the original source               midity, time response, and reagent consumption of the
      from Febo et al. (1995) was optimized by using a mod-              source.
      ified HCl permeation source and a solid NaNO2 -coated
      flow tube reactor, HONO stabilization times of 2 h were          – The predictability of the HONO output. The abso-
      observed, after the HCl permeation source was running              lute HONO concentration can be calculated based on
      constantly (Lao et al., 2020). Furthermore, for the HCl            Henry’s law with high accuracy (see next Sect. 4.2),
      permeation source stabilization times of a week and                which offers for the first time the possibility of using
      more were necessary, still leading to some unwanted                a HONO source for the absolute calibration of HONO
      peaks of the permeation rate after this long stabilization         instruments.
      time (Lao et al., 2020). In contrast, the present HONO
      source can be started under water, which can addition-         4.2   Theoretical calculation of the HONO concentration
      ally be used to zero any HONO instrument, and after
      1 h stabilization of the liquid flow rate of the peristaltic   When the acidity of the reaction mixture was fixed to
      pump stable HONO concentrations are obtained in a              pH ≈ 2.5, for which the effective solubility of HONO is de-
      few minutes, when water is exchanged by the nitrite and        scribed well by the Henry’s law solubility and the acid dis-
      H2 SO4 reagents.                                               sociation equilibrium (R6) (see Sect. 3.1), the experimental
                                                                     HONO mixing ratios of the source are calculated by Eq. (3):
    – The wide mixing ratio range of 0.05–500 ppb, simply
      by changing the nitrite concentration. Variable HONO           [HONO]theo. =
      mixing ratios can be important in laboratory studies but
      are also necessary when HONO instruments with non-                           cNO− · φNO− · NA
                                                                                        2       2
                                                                                                         p,T

      linear response are calibrated (Jurkat et al., 2011). A        MNO− · NA · φwaste · KH,eff. · p + N     · φ
                                                                                                                  p,T ,RH
                                                                                                        V        g
      very linear correlation between HONO and nitrite is ob-              2

      served. Different concentrated nitrite solutions can be        × 10−9 (ppb),                                               (3)

Atmos. Meas. Tech., 15, 627–637, 2022                                                   https://doi.org/10.5194/amt-15-627-2022
G. Villena and J. Kleffmann: A pure and quantifiable HONO source 635
where cNO− represents the nitrite concentration (g L−1 ), mixing ratios of only 1.2 ± 1.6 % was observed in the range
2
φNO− is the nitrite liquid flow rate (L min−1 ),
NA is the Avo- 0.05–0.5 ppb.
2
23 Besides this high precision, also a high accuracy of better
gadro constant (6.02214 × 10 molecules mol−1 ), MNO− is than 10 % is estimated for the HONO source, which is mainly
2
the molar mass of nitrite (46.005 g mol−1 ), φwaste is the liq- based on the accuracy of the used chemiluminescence moni-
uid flow rate of the waste (L min−1 ), KH,eff. is the effective tor (3 %), the precision error of all data for HONO concentra-
Henry’s law constant (mol L−1 atm−1 , see Sect. 3.1), p is the tions > 5 ppb (1.7 %), and the errors in the different variables
p,T
ambient pressure (atm), N V is the number density of the used in Eq. (3). For the liquid nitrite concentration, an accu-
gas phase according to the ideal gas law at ambient pressure racy of typically 3 %–4 % is obtained, considering the accu-
and temperature of the stripping coil (molecules cm−3 ), and racy of the nitrite stock solution of 1000 mg L−1 (1 %) and
p,T ,RH
φg is the gas flow rate at ambient pressure and temper- those of the used volumetric pipettes and flasks. An accuracy
ature of the stripping coil and considering the evaporation of of 2 % is estimated for the gas flow rate, since the flow con-
water at the temperature of the stripping coil (cm3 min−1 ). troller was used at 50 %–100 % of its nominal flow rate. In
p,T ,RH
φg is calculated by addition, it was calibrated during the experiments with a soap
bubble flow tube, for which temperature, pressure, and water
p,T ,RH ∅,dry T exp. p ∅ p exp. evaporation were carefully considered. Accuracies of the liq-
φg = φg · · · , (4)
T ∅ p exp. (p exp. − p water ) uid flow rates of 1 % are estimated. The error of the theoret-
∅,dry
ical HONO concentration induced by the pH measurements
where φg is the gas flow rate (cm3 min−1 ) of the is estimated to be 1.5 %. And finally, the error introduced by
calibrated flow controller at dry standard conditions the uncertainty of the stripping coil temperature of ±0.5 ◦ C
(T ∅ = 298.15 K, p ∅ = 1 atm) and T exp. and p exp. are the ex- is 1 %. By error propagation a combined accuracy of ±5.8 %
perimental temperature (K) and pressure (atm), respectively. is obtained.
To calculate the water vapour pressure p water (atm), the Mag- Because of the accuracy of better than 10 %, the HONO
nus equation was used (Alduchov and Eskridge, 1996): source can be used as a standalone device to absolutely cali-
17.625 · t (◦ C)
1 brate HONO instruments, for which no simple calibration is
p water = 6.1094 · exp ◦
· . (5) available, e.g. mass spectrometers. In contrast, instruments
243.04 + t ( C) 1013.25
which measure HONO after sampling in a liquid phase (e.g.
The measured liquid flow rate of the waste φwaste was in HPLC, high-performance liquid chromatography; WEDD,
excellent agreement with the sum of the flow rates of nitrite wetted effluent diffusion denuder; and LOPAP) can typically
and H2 SO4 considering the theoretical water evaporation in be calibrated by using liquid nitrite standards. However, even
the stripping coil, confirming an almost complete saturation these instruments need careful characterization, for exam-
of the gas phase by water vapour at the temperature of the ple of the sampling and detection efficiencies, where a pure
stripping coil. The liquid flow rates were measured by the HONO source would be also very helpful. And finally, the
time taken to fill up 5 mL volumetric flasks. HONO source can be used to study the chemistry of HONO
When all experimental data described in the previous in the laboratory.
sections, excluding the pH dependence (see Sect. 3.1),
were compared to the theoretical HONO concentrations,
a weighted average ratio of [HONO]exp. / [HONO]theo. of 5 Conclusion
0.996 was observed. This excellent agreement is trivial, since
the applied pKa was derived from the average of all in- In the present study, a HONO source is developed and char-
dividual adjusted values for fitting the theoretical HONO acterized, which is based on the effective Henry’s law solu-
mixing ratios to the measured values; see Sect. 3.1. How- bility of HONO in water. Diluted nitrite and sulfuric acid so-
ever, more importantly, the average 1σ standard deviation lutions are mixed in a temperature-controlled stripping coil,
of all [HONO]exp. / [HONO]theo. ratios was only 3.8 %, de- which is operated with pure nitrogen or synthetic air at gas
spite the high variability of the experimental conditions flow rates of 0.5–2 L min−1 . Under the acidic conditions of
applied. When the less precise data at [HONO] < 5 ppb the combined reaction mixture (pH ≈ 2.5), nitrite is almost
were excluded, the average 1σ standard deviation of the completely converted into HONO, which partitions to the
[HONO]exp. / [HONO]theo. ratios was only 1.7 %, showing gas phase. The known Henry’s law constant of HONO in
the very high precision of the source. The lower precision of H2 SO4 is used for the calculation of the effective solubility.
the data at HONO mixing ratios < 5 ppb is not caused by the In addition, in the present study the acid dissociation equilib-
precision of the HONO source but by the lower precision of rium is described by pKa = 1021.53/T − 0.449. The pKa of
the chemiluminescence instrument used. This is confirmed 3.0 ± 0.1 (1σ ) at 25 ◦ C is in good agreement with the range
by the low-concentration data shown in Fig. 8 determined by of 2.8–3.28 published in former studies. The source shows
the much more sensitive LOPAP technique, for which an av- a fast time response of ∼ 2 min (0 %–90 %) at higher con-
erage deviation between experimental and theoretical HONO centrations and an excellent long-term stability (2σ noise of
https://doi.org/10.5194/amt-15-627-2022 Atmos. Meas. Tech., 15, 627–637, 2022636 G. Villena and J. Kleffmann: A pure and quantifiable HONO source
0.76 %). The HONO emission of the source perfectly corre- Bates, R. G.: Determination of pH, Theory and Practice, John Wiley
lates with the nitrite concentration from the sub-ppb range & Sons, New York, ISBN 0-471-05647-2, 1973.
up to 500 ppb. The rate of NOx formation increases quadrati- Becker, K. H., Kleffmann, J., Kurtenbach, R., and Wiesen,
cally with the HONO concentration from non-detectable val- P.: Solubility of Nitrous Acid (HONO) in Sulfuric
ues at atmospheric relevant HONO concentrations reaching Acid Solutions, J. Phys. Chem., 100, 14984–14990,
https://doi.org/10.1021/jp961140r, 1996.
a NOx content of 1.6 % at 500 ppb. A general equation based
Braman, R. S. and de la Cantera, M. A.: Sublimation Source for Ni-
on the effective Henry’s law solubility is developed, by which trous Acid and Other Nitrogen Compounds in Air, Anal. Chem.,
the HONO concentration of the source can be calculated us- 58, 1533–1537, https://doi.org/10.1021/ac00298a059, 1986.
ing measured experimental parameters, i.e. nitrite concentra- Brust, A. S., Becker, K. H., Kleffmann, J., and Wiesen, P.: UV Ab-
tion, liquid flow rates, gas flow rate, pH of the solution, and sorption Cross Sections of Nitrous Acid, Atmos. Environ., 34,
temperature of the stripping coil. An average deviation be- 13–19, https://doi.org/10.1016/S1352-2310(99)00322-2, 2000.
tween the measured and theoretical HONO concentration of da Silva, G., Kennedy, E. M., and Dlugogorski, B. Z.: Ab Ini-
only ±3.8 % is observed, and a conservative accuracy of the tio Procedure for Aqueous-Phase pKa Calculation: The Acid-
calculated HONO concentration of better than 10 % is esti- ity of Nitrous Acid, J. Phys. Chem. A, 110, 11371–11376,
mated. Thus, for the first time, a HONO source is developed, doi:10/1021/jp0639243, 2006.
which can be used for the absolute calibration of HONO in- Febo, A., Perrino, C., Gherardi, M., and Sparapani, R.: Evaluation
of a High-Purity and High-Stability Continuous Generation Sys-
struments.
tem for Nitrous Acid, Environ. Sci. Technol., 29, 2390–2395,
https://doi.org/10.1021/es00009a035, 1995.
Gingerysty, N. J. and Osthoff, H. D.: A compact, high-purity
Data availability. The underlying data are available upon request. source of HONO validated by Fourier transform infrared and
thermal-dissociation cavity ring-down spectroscopy, Atmos.
Meas. Tech., 13, 4159–4167, https://doi.org/10.5194/amt-13-
Author contributions. GV conducted and evaluated most of the ex- 4159-2020, 2020.
periments. JK developed the HONO source, conducted and evalu- Gu, R., Zheng, P., Chen, T., Dong, C., Wang, Y., Liu, Y., Liu,
ated a few experiments, developed the theoretical calculation of the Y., Luo, Y., Han, G., Wang, X., Zhou, X., Wang, T., Wang,
HONO mixing ratio, and wrote the manuscript. W., and Xue, L.: Atmospheric Nitrous Acid (HONO) at a
Rural Coastal Site in North China: Seasonal Variations and
Effects of Biomass Burning, Atmos. Environ., 229, 117429,
Competing interests. The contact author has declared that neither https://doi.org/10.1016/j.atmosenv.2020.117429, 2020.
they nor their co-author has any competing interests. Heland, J., Kleffmann, J., Kurtenbach, R., and Wiesen, P.: A
New Instrument to Measure Gaseous Nitrous Acid (HONO)
in the Atmosphere, Environ. Sci. Technol., 35, 3207–3212,
Disclaimer. Publisher’s note: Copernicus Publications remains https://doi.org/10.1021/es000303t, 2001.
neutral with regard to jurisdictional claims in published maps and Jurkat, T., Voigt, C., Arnold, F., Schlager, H., Kleffmann, J.,
institutional affiliations. Aufmhoff, H., Schäuble, D., Schaefer, M., and Schumann,
U.: Measurements of HONO, NO, NOy and SO2 in aircraft
exhaust plumes at cruise, Geophys. Res. Lett., 38, L10807,
Acknowledgements. We would like to thank the three anony- https://doi.org/10.1029/2011GL046884, 2011.
mous referees for their comments, which helped to improve our Kirchner, J. J. and Hopkins, P. B.: Nitrous Acid Cross-Links
manuscript. Duplex DNA Fragments through Deoxyguanosine Residues at
the Sequence 5’-CG, J. Am. Chem. Soc., 113, 4681–4682,
https://doi.org/10.1021/ja00012a047, 1991.
Kleffmann, J.: Daytime Sources of Nitrous Acid (HONO) in the At-
Review statement. This paper was edited by Mingjin Tang and re-
mospheric Boundary Layer, Chem. Phys. Chem., 8, 1137–1144,
viewed by three anonymous referees.
https://doi.org/10.1002/cphc.200700016, 2007.
Kleffmann, J. and Wiesen, P.: Technical Note: Quantification of in-
terferences of wet chemical HONO LOPAP measurements under
References simulated polar conditions, Atmos. Chem. Phys., 8, 6813–6822,
https://doi.org/10.5194/acp-8-6813-2008, 2008.
Acker, K., Möller, D., Wieprecht, W., Meixner, F. X., Bohn, Kleffmann, J., Heland, J., Kurtenbach, R., Lörzer, J., and Wiesen,
B., Gilge, S., Plass-Dülmer, C., and Berresheim, H.: P.: A New Instrument (LOPAP) for the Detection of Nitrous Acid
Strong Daytime Production of OH from HNO2 at a (HONO), Environ. Sci. Pollut. Res., 9 (special issue 4), 48–54,
Rural Mountain Site, Geophys. Res. Lett., 33, L02809, 2002.
https://doi.org/10.1029/2005GL024643, 2006. Kleffmann, J., Benter, T., and Wiesen, P.: Heterogeneous Reaction
Alduchov, O. A. and Eskridge, R. E.: Improved Magnus of Nitric Acid with Nitric Oxide on Glass Surfaces under Sim-
Form Approximation of Saturation Vapor Pressure, J. ulated Atmospheric Conditions, J. Phys. Chem. A, 108, 5793–
Appl. Meteorol., 35, 601–609, https://doi.org/10.1175/1520- 5799, https://doi.org/10.1021/jp040184u, 2004.
0450(1996)0352.0.CO;2, 1996.
Atmos. Meas. Tech., 15, 627–637, 2022 https://doi.org/10.5194/amt-15-627-2022G. Villena and J. Kleffmann: A pure and quantifiable HONO source 637 Kleffmann, J., Gavriloaiei, T., Hofzumahaus, A., Holland, F., Kopp- Ródenas, M., Muñoz, A., Alacreu, F., Brauers, T., Dorn, H.-P., Kl- mann, R., Rupp, L., Schlosser, E., Siese, M., and Wahner, effmann, J., and Bloss, W. J.: Assessment of HONO Measure- A.: Daytime Formation of Nitrous Acid: A Major Source of ments: The FIONA Campaign at EUPHORE, in: Disposal of OH Radicals in a Forest, Geophys. Res. Lett., 32, L05818, Dangerous Chemicals in Urban Areas and Mega Cities. Role of https://doi.org/10.1029/2005GL022524, 2005. Oxides and Acids of Nitrogen in Atmospheric Chemistry, edited Lao, M., Crilley, L. R., Salehpoor, L., Furlani, T. C., Bourgeois, by: Barnes, I. and Rudziński, K., NATO Science for Peace and I., Neuman, J. A., Rollins, A. W., Veres, P. R., Washenfelder, Security Series C: Environmental Security, Springer, Dordrecht, R. A., Womack, C. C., Young, C. J., and VandenBoer, T. C.: A 45–58, https://doi.org/10.1007/978-94-007-5034-0_4, 2013. portable, robust, stable, and tunable calibration source for gas- Seel, F. and Winkler, R.: Das Gleichgewicht phase nitrous acid (HONO), Atmos. Meas. Tech., 13, 5873– salpetrige Säure–Stickoxydkation im System 5890, https://doi.org/10.5194/amt-13-5873-2020, 2020. Schwefelsäure–Wasser, Z. Phys. Chem., 25, 217–232, Ma, J., Liu, Y., Han, C., Ma, Q., Liu, C., and He, H.: Review of het- https://doi.org/10.1524/zpch.1960.25.3_4.217, 1960. erogeneous photochemical reactions of NOy on aerosol – A pos- Stemmler, K., Ammann, M., Donders, C., Kleffmann, J., and sible daytime source of nitrous acid (HONO) in the atmosphere, George, C.: Photosensitized Reduction of Nitrogen Dioxide on J. Environ. Sci., 25, 326–334, https://doi.org/10.1016/S1001- Humic Acid as a Source of Nitrous Acid, Nature, 440, 195–198, 0742(12)60093-X, 2013. https://doi.org/10.1038/nature04603, 2006. Michoud, V., Colomb, A., Borbon, A., Miet, K., Beekmann, M., Taira, M. and Kanda, Y.: Continuous Generation System for Low- Camredon, M., Aumont, B., Perrier, S., Zapf, P., Siour, G., Ait- Concentration Gaseous Nitrous Acid, Anal. Chem., 62, 630–633, Helal, W., Afif, C., Kukui, A., Furger, M., Dupont, J. C., Haef- https://doi.org/10.1021/ac00205a018, 1990. felin, M., and Doussin, J. F.: Study of the unknown HONO day- Večeřa Z. and Dasgupta, P. K.: Measurement of Ambi- time source at a European suburban site during the MEGAPOLI ent Nitrous Acid and a Reliable Calibration Source for summer and winter field campaigns, Atmos. Chem. Phys., 14, Gaseous Nitrous Acid, Environ. Sci. Technol., 25, 255–260, 2805–2822, https://doi.org/10.5194/acp-14-2805-2014, 2014. https://doi.org/10.1021/es00014a006, 1991. Park, J.-Y. and Lee, Y.-N.: Solubility and Decomposition Kinetics Večeřa, Z. and Dasgupta, P. K.: Indoor Nitrous Acid of Nitrous Acid in Aqueous Solution, J. Phys. Chem., 92, 6294– Levels. Production of Nitrous Acid from Open-Flame 6302, https://doi.org/10.1021/j100333a025, 1988. Sources, Int. J. Environ. Anal. Chem., 56, 311–316, Pitts Jr., J. N., Grosjean, D., Van Cauwenberghe, K., Schmid, J. https://doi.org/10.1080/03067319408034109, 1994. P., and Fitz, D. R.: Photooxidation of Aliphatic Amines under Villena, G., Bejan, I., Kurtenbach, R., Wiesen, P., and Kleff- Simulated Atmospheric Conditions: Formation of Nitrosamines, mann, J.: Development of a new Long Path Absorption Pho- Nitramines, Amides, and Photochemical Oxidant, Environ. Sci. tometer (LOPAP) instrument for the sensitive detection of Technol., 12, 946–953, https://doi.org/10.1021/es60144a009, NO2 in the atmosphere, Atmos. Meas. Tech., 4, 1663–1676, 1978. https://doi.org/10.5194/amt-4-1663-2011, 2011. Reed, C., Brumby, C. A., Crilley, L. R., Kramer, L. J., Bloss, W. J., Villena, G., Bejan, I., Kurtenbach, R., Wiesen, P., and Kleffmann, J.: Seakins, P. W., Lee, J. D., and Carpenter, L. J.: HONO measure- Interferences of commercial NO2 instruments in the urban atmo- ment by differential photolysis, Atmos. Meas. Tech., 9, 2483– sphere and in a smog chamber, Atmos. Meas. Tech., 5, 149–159, 2495, https://doi.org/10.5194/amt-9-2483-2016, 2016. https://doi.org/10.5194/amt-5-149-2012, 2012. Ren, X., Gao, H., Zhou, X., Crounse, J. D., Wennberg, P. O., Wayne, L. G. and Yost, D. M.: Kinetics of the Rapid Gas Phase Browne, E. C., LaFranchi, B. W., Cohen, R. C., McKay, M., Reaction between NO, NO2 , and H2 O, J. Chem. Phys., 19, 41– Goldstein, A. H., and Mao, J.: Measurement of atmospheric 47, https://doi.org/10.1063/1.1747986, 1951. nitrous acid at Bodgett Forest during BEARPEX2007, Atmos. Zhou, X., Zhang, N., TerAvest, M., Tang, D., Hou, J., Bertman, S., Chem. Phys., 10, 6283–6294, https://doi.org/10.5194/acp-10- Alaghmand, M., Shepson, P. B., Caroll, M. A., Griffith, S., Du- 6283-2010, 2010. santer, S., and Stevens, P. S.: Nitric Acid Photolysis on Forest Riordan, E., Minogue, N., Healy, D., O’Driscoll, P., and Sodeau, Canopy Surface as a Source for Tropospheric Nitrous Acid, Nat. J. R.: Spectroscopic and Optimization Modeling Study of Ni- Geosci., 4, 440–443, https://doi.org/10.1038/NGEO1164, 2011. trous Acid in Aqueous Solution, J. Phys. Chem. A, 109, 779– 786, https://doi.org/10.1021/jp040269v, 2005. https://doi.org/10.5194/amt-15-627-2022 Atmos. Meas. Tech., 15, 627–637, 2022
You can also read