Community health workers impact on maternal and child health outcomes in rural South Africa - a non-randomized two-group comparison study
←
→
Page content transcription
If your browser does not render page correctly, please read the page content below
le Roux et al. BMC Public Health   (2020) 20:1404
https://doi.org/10.1186/s12889-020-09468-w

 RESEARCH ARTICLE                                                                                                                                    Open Access

Community health workers impact on
maternal and child health outcomes in
rural South Africa – a non-randomized two-
group comparison study
Karl W. le Roux1,2,3,4, Ellen Almirol5, Panteha Hayati Rezvan5, Ingrid M. le Roux6, Nokwanele Mbewu6,
Elaine Dippenaar1, Linnea Stansert-Katzen1,2, Venetia Baker2, Mark Tomlinson1,7† and M. J. Rotheram-Borus5*†

  Abstract
  Background: Home visits by paraprofessional community health workers (CHWs) has been shown to improve
  maternal and child health outcomes in research studies in many countries. Yet, when these are scaled or replicated,
  efficacy disappears. An effective CHW home visiting program in peri-urban Cape Town found maternal and child
  health benefits over the 5 years point but this study examines if these benefits occur in deeply rural communities.
  Methods: A non-randomized, two-group comparison study evaluated the impact of CHW in the rural Eastern Cape
  from August 2014 to May 2017, with 1310 mother-infant pairs recruited in pregnancy and 89% were reassessed at
  6 months post-birth.
  Results: Home visiting had limited, but important effects on child health, maternal wellbeing and health behaviors.
  Mothers reported fewer depressive symptoms, attended more antenatal visits and had better baby-feeding
  practices. Intervention mothers were significantly more likely to exclusively breastfeed for 6 months (OR: 1.8; 95% CI:
  1.1, 2.9), had lower odds of mixing formula with baby porridge (regarded as detrimental) (OR: 0.4; 95% CI: 0.2, 0.8)
  and were less likely to consult traditional healers. Mothers living with HIV were more adherent with co-trimoxazole
  prophylaxis (p < 0.01). Intervention-group children were significantly less likely to be wasted (OR: 0.5; 95% CI 0.3–0.9)
  and had significantly fewer symptoms of common childhood illnesses in the preceding two weeks (OR: 0.8; 95% CI:
  0.7,0.9).
  Conclusion: The impact of CHWs in a rural area was less pronounced than in peri-urban areas. CHWs are likely to
  need enhanced support and supervision in the challenging rural context.
  Keywords: Community health workers, Rural, Eastern cape, South Africa, Wasting, Depression

* Correspondence: cchpublications@mednet.ucla.edu
†
 Mark Tomlinson and MJ Rotheram-Borus are Joint senior authors
5
 Department of Psychiatry and Biobehavioral Sciences, Semel Institute,
University of California, 10920 Wilshire Boulevard, Suite 350, Los Angeles, CA
90024-6521, USA
Full list of author information is available at the end of the article

                                         © The Author(s). 2020 Open Access This article is licensed under a Creative Commons Attribution 4.0 International License,
                                         which permits use, sharing, adaptation, distribution and reproduction in any medium or format, as long as you give
                                         appropriate credit to the original author(s) and the source, provide a link to the Creative Commons licence, and indicate if
                                         changes were made. The images or other third party material in this article are included in the article's Creative Commons
                                         licence, unless indicated otherwise in a credit line to the material. If material is not included in the article's Creative Commons
                                         licence and your intended use is not permitted by statutory regulation or exceeds the permitted use, you will need to obtain
                                         permission directly from the copyright holder. To view a copy of this licence, visit http://creativecommons.org/licenses/by/4.0/.
                                         The Creative Commons Public Domain Dedication waiver (http://creativecommons.org/publicdomain/zero/1.0/) applies to the
                                         data made available in this article, unless otherwise stated in a credit line to the data.
le Roux et al. BMC Public Health (2020) 20:1404 Page 2 of 14
Background District Hospital, situated in the King Sabata Dalidyebo
Rural populations face greater challenges than their Subdistrict of the OR Tambo district, one of the poorest
urban counterparts in accessing good quality health care. municipalities in South Africa [25]. The catchment
Not only are health facilities in rural areas less accessible population is approximately 40,000, with a density of
due to distance and topography, but clinics and hospitals (124 people/km2) [26] and the topography is hilly with
are often under-resourced, poorly maintained [1, 2] and deep river valleys and gorges. This, combined with poor
lack essential medicines [3]. Furthermore, there may be road infrastructure, makes access to healthcare services
a scarcity of trained and skilled healthcare workers in challenging for much of the population.
rural areas, including doctors, pharmacists and nurses
leading to suboptimal health outcomes [2, 4]. Study design
One proposed remedy to the shortage of human This study was an early Phase II non-randomized two-
resources is training and employing lay healthcare group comparison study evaluating the Philani Home-
workers, usually known as village or community health- Visiting Model in the rural Eastern Cape of South
care workers (CHWs). CHWs are typically community Africa, called the Zithulele Mothers-to-be Assessment
members who are trusted and respected, and able to (ZiMBA). Recruitment started in August 2014 and
provide a link between people’s homes and formal ended in May 2017. Mothers were assigned based on the
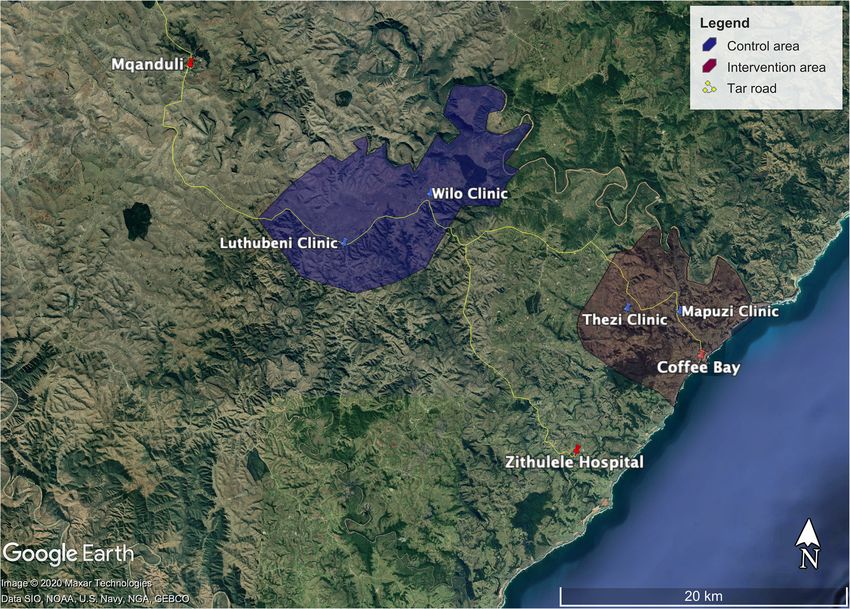
government primary health care (PHC) clinics [5]. The location of clinic: (1) Mapuzi and Tshezi, an area with
efficacy of CHWs in reducing the burden of care in home visiting by CHWs, which we will refer to as the
understaffed and under-resourced health systems “intervention” group or (2) Wilo and Luthubeni, areas
remains a point of debate, with their perceived value with standard clinical care and no CHWs, as the “com-
varying significantly [6, 7]. parison” group. Philani CHWs focusing on maternal and
In 2011, the South African (SA) National Department of child health, had been assigned to conduct home visits
Health (NDOH) launched ‘The Re-engineering of Primary within designated geographical areas (i.e. intervention
Health Care’ policy, which relies heavily on CHWs, to re- areas a year previously). The comparison area was
duce maternal and child mortality and improve access to matched with the intervention area based on clinic
health care [8–11]. Successful CHW programs have pro- coverage, size, and distance from the district hospital by
vided services to over 200 million people over the past 2 tar road, and a similar number of expected pregnancies,
decades in Brazil, Bangladesh and Nepal [12]. CHWs have which was estimated from data of the Zithulele Births
implemented preventive interventions for maternal and Follow-up Study (ZiBFUS) [27]. We ensured that a
child health [13–15]. CHW programs have been shown to buffer zone existed between the two areas to avoid
reduce child mortality [16, 17], reduce maternal depres- “cross-contamination” of intervention effects. See map –
sion [18, 19], improve access to health care [7] and im- Fig. 1.
prove child growth and development [18–20]. Despite
good evidence that well-managed CHW programs can Intervention group
positively influence a range of health outcomes, programs Philani Maternal, Child Health and Nutrition Trust is
often face a myriad of practical obstacles that impact their a Non-Governmental Organization (NGO) that has
effectiveness, particularly when expanded and replicated, been operating in peri-urban townships of Cape Town
and most CHW programs have not been able to be taken since 1979. Philani Mentor Mothers (Community
to scale whilst retaining effectiveness [21]. Health Workers) are positive-deviant women whose
There has, therefore, been a call for more research on children are thriving despite living in poverty [9].
how to best implement CHW programs. This study These mothers are recruited to work in the areas
builds on a series of evaluations of the Philani CHW where they live and are primarily trained to address
program in Khayelitsha, Cape Town, which has shown maternal and child health issues in their communities
long term benefits for maternal and child health out- at the level of the household. They perform regular
comes [18, 19, 22–24]. This paper evaluates whether the house-to-house visits in their designated neighbor-
CHW home-visiting model is equally effective in a hoods and identify both pregnant mothers and mal-
deeply rural area where health providers and patients nourished children who are then offered to entry into
face many additional challenges in seeking and consist- the program and followed up with regular home
ently receiving care. visits. The Community Health Workers (CHWs) build
strong relationships with their clients and encourage
Methods mothers to attend antenatal care, immunize their chil-
Setting dren, weigh them regularly and breastfeed exclusively
The study was initiated in the rural Eastern Cape, in the for 6 months; they advise mothers about health-care
catchment area of four clinics referring to Zithulele regimes, mental-health issues, antenatal care, optimalle Roux et al. BMC Public Health (2020) 20:1404 Page 3 of 14 Fig. 1 Control and intervention areas, Eastern Cape, South Africa infant feeding, accessing grants and accessing preven- Comparison group tion of mother-to-child HIV transmission (PMTCT) The Philani Mentor Mother program is not active in this [22]. CHW are also trained to identify and refer area. Mothers and children in the comparison group household members with possible TB and to support have access to free primary health care at clinics and free people living with HIV. A critical aspect of the inter- maternity and child healthcare (up to 6 years) at govern- vention is the peer support provided to mothers who ment hospitals, which includes HIV care. are struggling by women from their own community, who have faced similar challenges. Sample In 2010, the program was expanded to a deeply rural All pregnant women attending antenatal care during the area around Zithulele District Hospital, and by 2013 to study period and who agreed to participate were re- the Coffee Bay area - both in the OR Tambo district of cruited by trained interviewers stationed at each of the the Eastern Cape. The CHW program was integrated four clinics listed above, during the recruitment period. into primary health-care services in the King Sabata Women living in the areas covered by the four clinics Dalindyebo sub-district authority, and provides several who presented to Zithulele Hospital around the time of advantages over other CHW programs, including a delivery, but who were not previously recruited, were strong emphasis on care in households and the commu- also recruited into the study. Participants who were deaf, nity rather than at primary care clinics, a total 6-week mute or with significant psychiatric issues at initial standardized training both in the classroom and the contact were excluded. All women signed an informed field, meticulous record-keeping of patient follow-ups, consent form. In addition, those under the age of 18 had daily in-the-field support and supervision visits by super- a parent or guardian sign consent. visors ensuring accountability and the recruitment of Figure 2 depicts the participant flow chart. Of the positive-deviant mothers [9]. 1490 mothers approached at antenatal clinics and the
le Roux et al. BMC Public Health    (2020) 20:1404                                                                        Page 4 of 14

 Fig. 2 Participant flow chart - by intervention (Thezi-Mapuzi) and comparison (Luthubeni-Wilo) groups

hospital, 180 women were not eligible due: no pregnancy                    employment or learner status, and the presence of a
(n = 21), miscarriages and intrauterine deaths (n = 53),                   live-in partner or husband. Economic resources were
early birth deaths (n = 13), refusal at baseline interview                 identified as monthly income (> 2000 South African
or other reasons (n = 11), and not completing the                          Rand [ZAR]), receipt of the child support grant, access
baseline interview (n = 82). A total of 1310 women were                    to electricity and safe water, and the number of adults
recruited into the study, stratified by location of clinic:                and children that live in the household.
(1) Mapuzi and Thezi (Intervention group; n = 636); or
(2) Wilo and Luthubeni (Comparison group; n = 674).                        Alcohol use
Baseline assessments were performed soon after the                         Mothers were asked if they ever used alcohol before
birth of the baby (median, 2 days) and at 6-months post-                   pregnancy, and if they continued to use alcohol after dis-
birth (median, 180 days). In the analysis, babies who died                 covering they were pregnant.
by 6-months (n = 21), twins or triplets (n = 17), and
HIV-seropositive children (n = 3) were excluded. There                     Maternal health
were two maternal deaths by 6 months. Although child                       Maternal antenatal cards detailed the medical care the
deaths did affect the overall study sample, maternal                       mother received before pregnancy and the number of
deaths did not, as long as there was a proxy for the                       antenatal visits she attended. We collected previous
mother’s interview (i.e. caregiver like a grandmother)                     pregnancy history including poor outcomes and the
who could complete the assessment.                                         number of live births.

Measures                                                                   Maternal mental health
Demographic characteristics                                                Depressive symptoms were measured using the
Background characteristics collected included maternal                     Edinburgh Postnatal Depression Scale (EPDS). The
age, highest education level achieved (years), current                     EPDS is a 10-item scale with four Likert-type responses
le Roux et al. BMC Public Health   (2020) 20:1404                                                            Page 5 of 14

for each item, with mothers self-reports indicating           of > 5 SD or < − 5 SD may have represented measure-
possible depressed mood with scores > 13 and probable         ment errors and were replaced by 5 or − 5 in order to
clinical depression ≥18 that has been extensively used in     reduce the effect of outliers in our analyses (i.e. HAZ
South Africa [24, 28–30] and has been found to “reliably      [n = 21, 0.6%], WAZ [n = 20, 0.6%], and WHZ [n = 123,
and validly measure perinatal depression symptom              3.5%]).
severity or screen for probable postnatal depression in
African countries” (29, p1).                                  Immunizations and vitamin a
                                                              Data collectors asked the mothers what immunizations
HIV status and adherence to PMTCT                             the child had received up to and including 6-months
HIV testing during pregnancy was confirmed either by          (plus Vitamin A) and confirmed these answers with the
self-report or by the mother’s antenatal card at baseline.    child’s RtHC.
Mother’s HIV status, receipt of ARVs before and during
pregnancy, and disclosure of HIV status were also             Child illnesses
recorded.                                                     Mothers were asked at the 6-months assessment if the
                                                              child had experienced any child illness in the past 2
Paternal characteristics                                      weeks including diarrhea, vomiting, cough, shortness of
At baseline, data collectors record if the child lives with   breath, fever, and/or runny nose. Mothers were asked if
the father, and the father’s HIV status and substance         the mother has taken the child to the hospital, clinic,
use.                                                          traditional healer, private doctor, or private pharmacy in
                                                              the past 3 months.
Breastfeeding
current breastfeeding at the birth interview was recorded     Child development
and how soon the infant was put to the breast. At the 6-      WHO gross motor developmental milestones were
months assessment, mothers self-reported whether they         measured at 6-months. The presence or absence of the
were exclusively breastfeeding for three and 6 months. If     following motor skills were assessed: (1) sitting without
a mother was not exclusively breastfeeding, data collec-      support; (2) standing with support; (3) hands-and-knees
tors asked whether and when the mother started using          crawling; (4) walking with assistance; and (5) standing
formula, and whether she was mixing formula with baby         alone [32]. Depending on the child’s age (age unit:
porridge.                                                     months), a child was determined to be either on target
                                                              or behind target based on the assessment of the trained
Child outcomes                                                interviewer.
Birth outcomes
Birthplace of the child was either at the hospital, clinic,   PMTCT Cascade
or on the way to the hospital/clinic versus at home. Low      Among the mothers living with HIV (MLH), the PMTC
birth-weight was defined as any infant that weighed less      T cascade focused on six tasks: (1) receipt of antiretro-
than 2500 g at the time of birth. Finally, Apgar scores       viral (ARVs) before the birth of the baby; (2) nevirapine
were recorded at birth at 5 min, ranging from 1 to 10         (NVP) administered to the infant after delivery; (3)
using information from the government Road to Health          continuation of Anti-retroviral Therapy (ART) for
Card (RtHC), which is a health record kept by the             mother post-delivery; (4) infant received HIV PCR
mother.                                                       testing; (5) maintenance of a single feeding method (i.e.
                                                              exclusive breastfeeding for 3 months); and (6) the infant
Growth measures                                               received co-trimoxazole by the 6-months assessment.
Trained and certified interviewers weighed children
(kilograms) and measured their length (centimeters)           Data analysis
using a measuring mat at birth and 6-months. Birth            The key baseline demographics and maternal character-
weight (g/kg) was also recorded from the RtHC. Infant         istics were compared between intervention and compari-
anthropometric data was then converted to z-scores            son groups, using the Student’s t-test or Mann-Whitney
based on the World Health Organization’s (W.H.O) age-         U test for continuous variables, and the chi-square (χ2)
adjusted norms [31]. A z-score below − 2 standard             test or Fisher’s exact test for categorical variables. We
deviation (SD) was considered a serious growth deficit: <     also examined participants who were lost to follow-up
− 2 for height-for-age z-scores (HAZ) was considered          (11%; n = 147), by comparing their baseline characteris-
stunted, < − 2 for weight-for-age z scores (WAZ) was          tics to mothers who were retained at 6-months assess-
considered underweight, and < − 2 for weight-for-height       ment (n = 1142/1310) stratified by intervention and
z scores (WHZ) were considered wasted. Growth scores          comparison groups.
le Roux et al. BMC Public Health (2020) 20:1404 Page 6 of 14
Our primary analysis compared the distribution of characteristics grouped by intervention condition. The
maternal and child outcomes by intervention and median age of mothers was 24 years (Range, 14–50
comparison groups at 6-months using t-test and χ2 test years), with schooling for 8.8 years (SD, 2.6). About 38%
for continuous and categorical outcomes, respectively. of mothers (n = 493) were married or lived with a part-
Among MLH, we compared additional tasks in the ner (p ≤ 0.05); unemployment rates were extremely high
PMTCT cascade between intervention and comparison (72.1%) (p = 0.02). Mothers in the intervention group
groups using χ2 test. had lower total grant income (p < 0.01), and on average,
Longitudinal mixed-effects models were used to as- had more antenatal visits (p < 0.01) and more previous
sess the intervention effect for maternal and child pregnancies (p < 0.01) than those in the comparison
outcomes that were measured over time. In particular, group.
we applied linear mixed-effects regression models The two groups varied in the municipal services avail-
with restricted maximum likelihood estimation for able in each area: mothers in the comparison group were
continuous outcomes, and mixed-effect logistic regres- about twice as likely to have electricity (p < 0.01) and not
sion models for binary outcomes. The mixed-effects have safe water (p < 0.01) than mothers in the interven-
models for maternal and child outcomes assessed over tion group.
time, included fixed-effects for maternal HIV status, As shown in Table 1, about one-third of mothers
access to electricity and safe water, having total grant reported living with HIV (n = 391; 30%), and just less
income above 2000 South African Rand (ZAR), inter- than half (n = 176; 45.1%) were on HAART before the
vention, time, and interaction between intervention pregnancy. Almost all MLH received ART during
and time. The time variable used in the longitudinal pregnancy (98.7%), a majority of which were taking a
models for maternal outcomes corresponds to time- single fixed dose combination (FDC) or Tenofovir/
points (baseline and 6-months) where mothers were Emtricitabine/Efavirenz (TEE) every day. MLH were
assessed in the study, and for child outcomes refer to much more likely to disclose their HIV status to family
the actual age of children (age unit: months). (n = 278; 77.9%) than to their partners (15.1%), but no
For child outcomes assessed only at 6-months, we differences were observed across the two groups and the
omitted the child random-effects. Multivariate negative average number of people disclosed to was two people
binomial regression models were fitted for count (SD = 0.8).
outcomes, where the likelihood ratio test was adapted to Regarding parental characteristics, only 15.7% of
assess whether the negative binomial model was more mothers lived with the father of their child and about
appropriate than the Poisson model. For child outcomes one-third of MLH reported that they knew that the HIV
that were assessed over time from baseline to 6-months, status of the father of their child was positive (29.5%);
the effect modification was assessed by fitting interaction most mothers (53.3%) were not aware of the father’s
terms between maternal HIV status, time, and interven- HIV status.
tion in the longitudinal models. Similarly, for those child There were no significant differences in mean WAZ,
outcomes that were only measured at 6-months, this HAZ, and WHZ scores and the rate of low birth-weight
was assessed by including an interaction term between infants, those stunted, underweight, and wasted across
maternal HIV status and intervention in models. Further the two groups at birth, but the percentage of children
examination was carried out to assess whether maternal wasted (WHZ < − 2) at birth was very high at 35%.
HIV status modifies the effect of intervention on
outcomes. Maternal outcomes at 6-months
All mixed-effects models accounted for repeated Table 2 compares mothers in the intervention and com-
measures for participants by including random inter- parison groups on EPDS outcomes at 6-months. While
cepts. Random slope for time was also assessed, and if findings from the adjusted analyses highlighted higher
needed, included in the models in addition to fixed- EPDS scores for mothers in the comparison group com-
effects and random intercepts. All analyses were pared to the intervention group (mean difference (MD):
conducted using Stata SE software Version 15. -0.9; 95% CI: − 1.7, − 0.2), there were no differences in
the prevalence of having a depressed mood (EPDS > 13)
or probable clinical depression (EPDS ≥18). No other
Results significant differences on maternal outcomes between
Baseline differences the intervention and control conditions were found.
Follow-up assessments were completed by 89% of
mothers and those lost to follow-up (n = 147) were simi- Child outcomes at 6-months
lar to those retained (n = 1142) (details available from As Table 3 shows, no significant differences were ob-
authors). Table 1 summarizes the background served between the intervention and comparison groupsle Roux et al. BMC Public Health (2020) 20:1404 Page 7 of 14
Table 1 Baseline characteristics of the sample by Intervention (n = 636) and comparison (n = 674) groups
Intervention Comparison Total
(n = 636) (n = 674) (n = 1310)
n (%) n (%) n (%)
Demographic characteristics
Maternal age, median [range] 24 [14, 46] 23 [14, 50] 24 [14, 50]
Highest education level, mean (SD) 8.7 (2.9) 8.9 (2.4) 8.8 (2.6)
**
Employment
Employed 48 (7.6) 32 (4.8) 80 (6.1)
School 123 (19.4) 161 (24.0) 284 (21.8)
Unemployed 464 (73.1) 478 (71.2) 942 (72.1)
Married or lives with partner* 257 (40.4) 236 (35.1) 493 (37.7)
Total grant income (> 2000 Rand)*** 177 (28.6) 247 (37.9) 424 (33.4)
Total child support grant 577 (92.1) 588 (93.3) 1145 (92.7)
Access to electricity*** 272 (42.8) 553 (82.1) 825 (63.0)
Access to safe water***a 607 (95.4) 264 (39.2) 871 (66.5)
Number of adults in household, mean (SD) 3.4 (1.9) 3.6 (2.0) 3.5 (2.0)
Number of children in household, mean (SD) 4.0 (1.9) 4.1 (1.9) 4.1 (1.9)
Alcohol
Use alcohol during pregnancy 48 (7.6) 42 (6.2) 90 (6.9)
Use alcohol before pregnancy 36 (5.7) 46 (6.8) 82 (6.3)
Continued to use alcohol after pregnancy discovery 2 (18.2) 6 (37.5) 8 (29.6)
Maternal and Mental health
Antenatal care 635 (99.8) 672 (99.7) 1307 (99.8)
Total antenatal visits, mean (SD)*** 4.3 (1.6) 3.9 (1.7) 4.1 (1.7)
Total previous pregnancies, mean (SD) *** 1.5 (1.6) 1.3 (1.5) 1.4 (1.6)
Number of live births, mean (SD) 2.1 (1.4) 2.0 (1.4) 2.1 (1.4)
EPDS, median [range] 5 [0–27] 5 [0–30] 5 [0–30]
EPDS > 13 79 (12.4) 86 (12.8) 165 (12.6)
EPDS ≥18 26 (4.1) 31 (4.6) 57 (4.4)
HIV and Reproductive Health Behavior
Tested for HIV during pregnancy 568 (89.6) 604 (89.9) 1172 (89.5)
Mothers living with HIV 187 (29.6) 204 (30.4) 391 (30.0)
Ever receipt ARVs 183 (97.9) 202 (99.5) 385 (98.7)
ARVs before pregnancy 90 (48.1) 86 (42.4) 176 (45.1)
ARVs currently (Single pink pill-FDC or TEE) 172 (94.0) 194 (96.5) 366 (95.3)
Disclosed HIV status 173 (92.5) 184 (90.6) 357 (91.5)
Husband/boyfriend/partner 28 (16.2) 26 (14.1) 54 (15.1)
Family (Mother/Sister/Mother-in-law, Other) 137 (79.2) 141 (76.6) 278 (77.9)
Other (Friend/Mentor-mother/CHW/Neighbor) 8 (4.6) 17 (9.2) 25 (7.0)
Number of people disclosed to, mean (SD) 1.7 (0.8) 1.8 (0.9) 1.8 (0.8)
Paternal characteristics
Child lives with father 108 (17.0) 98 (14.5) 206 (15.7)
Father alcohol use 319 (51.9) 346 (54.7) 665 (53.3)
Father tobacco use 188 (29.8) 197 (29.8) 385 (29.8)
Father drug use 32 (5.2) 25 (3.9) 57 (4.5)le Roux et al. BMC Public Health (2020) 20:1404 Page 8 of 14
Table 1 Baseline characteristics of the sample by Intervention (n = 636) and comparison (n = 674) groups (Continued)
Intervention Comparison Total
(n = 636) (n = 674) (n = 1310)
n (%) n (%) n (%)
Father living with HIV+ 57 (30.5) 58 (28.6) 115 (29.5)
Breastfeeding
Breastfeeding at baseline interview 601 (94.5) 644 (95.6) 1245 (95.0)
Breastfeed within 1 h of birth 546 (85.8) 556 (82.5) 1102 (84.1)
Child outcomes at birth
Birth in hospital *** b 591 (92.9) 649 (96.3) 1240 (94.7)
LBW (less than 2500 g) 65 (10.5) 73 (11.2) 138 (10.9)
WAZ, mean (SD) −0.6 (1.1) −0.6 (1.1) −0.6 (1.1)
Underweight (WAZ < −2 SD) 57 (9.2) 63 (9.7) 120 (9.5)
HAZ, mean (SD) 0.2 (1.5) 0.2 (1.5) 0.2 (1.5)
Stunted (HAZ < −2 SD) 41 (6.5) 48 (7.2) 89 (6.8)
WHZ, mean (SD) −1.8 (2.3) −1.6 (2.2) −1.7 (2.2)
Wasting (WHZ < -2 SD) 220 (37.2) 213 (33.5) 433 (35.3)
Apgar Score at 5 min, mean (SD) 10.0 (0.7) 9.9 (0.8) 10.0 (0.8)
Apgar Score at 5 min (7 and above) 588 (99.5) 641 (98.8) 1229 (99.1)
*
p < 0.1; p < 0.05; p < 0.01
** ***
a
Safe water includes rainwater tank, communal tap running water, communal tap hand pump, hospital tap, running water tap on land, and non-safe water
consists of river and well; b Hospital/clinic or on the way to hospital vs. Home
Abbreviations: EPDS Edinburgh Postnatal Depression Scale (EPDS). LBW Low birth weight (LBW); WAZ Weight-for-age z-score (WAZ). HAZ Length/height-for-age
z-score (HAZ)
in the adjusted analysis of the growth measures of HAZ experiencing vomiting, cough and a runny nose in chil-
and WAZ. However, the intervention group had higher dren of the intervention group were lower compared to
mean for WHZ (MD: 0.3; 95% CI: 0.1, 0.6), and lower children in the comparison group. The incident rate ra-
odds of wasting (WHZ < -2SD) (OR: 0.5; 95% CI: 0.3, tio for symptoms of common childhood illnesses was
0.9) than the comparison group, as well as a trend to- also lower for the intervention group (IRR: 0.8; 95% CI:
ward a lower odds for being underweight (WAZ < − 2) 0.7, 0.9; p < 0.05).
(OR: 0.4; 95% CI: 0.1, 1.0; p < 0.01). Children in the intervention group had significantly
Intervention mothers had higher odds of exclusive lower odds of consulting with a traditional healer (OR:
breastfeeding for 6 months (OR: 1.8; 95% CI: 1.1, 2.9) 0.2; 95% CI: 0.1, 0.8) and a private pharmacy (OR: 0.2;
and lower odds of mixing formula with baby porridge 95% CI: 0.1, 0.4) than children in the comparison group.
(OR: 0.4; 95% CI: 0.2, 0.8). In addition, the odds of No significant differences were observed between the
Table 2 Maternal outcomes at 6-months grouped by intervention and comparison groups
Intervention Comparison Estimated Mean Difference
(n = 565) (n = 577) Intervention vs. Comparison
Depression Mean SD Mean SD Differencea 95% CI
EPDS score **
4.5 5.0 5.3 5.4 −0.9 c,d,††
(−1.7, − 0.2)
Median [range] ** 3 [0–33] 4 [0–26]
Estimated Odds Ratio
Intervention vs. Comparison
Depression n % n % ORb 95% CI
** c,e
EPDS score > 13 30 6.3 47 9.9 0.5 (0.3, 1.1)
EPDS score ≥ 18 14 2.9 18 3.8 0.6 c,e
(0.2, 1.8)
Multivariate models controlled for: maternal HIV status, access to electricity and safe water, and grant income above 2000 ZAR
*
p-value < 0.1,, ** p-value < 0.05, (t-tests or χ2 tests).† p-value < 0.1, †† p-value < 0.05, for regression analyses
a
Mixed-effects linear regression for continuous outcomes. b Mixed-effects logistic regression for binary outcomes
c
Random-intercept for mother
d
Random-slope for time using unstructured covariance
e
Random-slope for time using identity covariance structurele Roux et al. BMC Public Health (2020) 20:1404 Page 9 of 14
Table 3 Child outcomes at 6-months grouped by intervention and comparison groups
Intervention Comparison Estimated Mean Difference
(n = 565) (n = 574) Intervention vs. Comparison
Mean SD Mean SD Differencea 95% CI
Growth measures
Height-for-age Z-score (HAZ)** 0.5 1.6 0.7 1.6 −0.2e,f (−0.4, 0.1)
e,f
Weight-for-age Z score (WAZ) 0.4 1.3 0.3 1.2 0.1 (−0.1, 0.3)
Weight-for-height Z-score (WHZ) *** 0.3 1.5 −0.0 1.6 0.3e,f ††† (0.1–0.6)
Estimated Odds Ratio
Intervention vs. Comparison
n % n % ORb 95% CI
Growth measures
Stunted (HAZ < -2 SD) 33 5.9 23 4.1 1.6e,f (0.6, 3.9)
Underweight (WAZ < −2 SD) 13 2.3 22 3.9 0.4e†
(0.1, 1.0)
Wasting (WHZ < -2SD) *** 27 4.8 56 9.4 0.5†† (0.3, 0.9)
Breastfeeding
Currently breastfeeding 274 48.5 301 52.4 0.5e,g (0.1, 5.4)
Estimated Odds Ratio
Intervention vs. Comparison
n % n % ORc 95% CI
Breastfeeding
Exclusive Breastfeeding for 3 months 349 61.8 352 61.3 1.6 (0.8, 3.3)
Exclusive Breastfeeding for 6 months 177 31.3 156 27.2 1.8†† (1.1, 2.9)
If not breastfeeding exclusively, started mixing formula with Nestum/Baby porridge***380 80.3 447 88.3 0.4†† (0.2, 0.8)
*
Immunizations current 302 57.5 280 52.0 1.1 (0.8, 1.6)
Vitamin A has been given 140 26.7 139 25.8 1.3 (0.8, 2.0)
Child illness during the past 2 weeks
Diarrhoea 136 24.1 130 22.7 1.3 (0.9, 1.9)
Vomiting** 49 8.7 78 13.4 0.5†† (0.3,0.9)
Cough 250 44.3 279 48.6 0.6†† (0.4, 0.8)
Shortness of breath 95 16.8 115 20.0 0.8 (0.5, 1.2)
Fever 157 27.8 188 32.8 0.8 (0.6, 1.1)
Runny nose** 143 25.3 185 32.2 0.7†† (0.5, 0.9)
Medical Visits (past 3 months)
Hospital visit** 24 4.3 43 7.5 0.5† (0.3, 1.1)
Clinic for illness 300 53.1 313 54.5 0.8 (0.6, 1.2)
Consulted with traditional healer*** 6 1.1 24 4.2 0.2†† (0.1, 0.8)
Consulted with private doctor* 29 5.1 46 8.0 0.6 (0.3, 1.2)
Consulted with a private pharmacy*** 29 5.1 79 13.8 0.2†† (0.1, 0.4)
WHO Development
On/Ahead target vs Behind target 399 93.0 415 91.2 1.3 (0.7, 2.6)
Estimated Incident Rate Ratio
Intervention vs. Comparison
n % n % IRRd 95% CI
Total Count of Symptoms during the past 2 weeks
0 190 33.6 173 30.1 0.8†† (0.7,0.9)
1 137 24.3 128 22.3le Roux et al. BMC Public Health (2020) 20:1404 Page 10 of 14
Table 3 Child outcomes at 6-months grouped by intervention and comparison groups (Continued)
Intervention Comparison Estimated Mean Difference
(n = 565) (n = 574) Intervention vs. Comparison
2 106 18.8 104 18.1
3 74 13.1 81 14.1
4 34 6.0 53 9.2
5 21 3.7 26 4.5
6 3 0.5 9 1.6
Multivariate regression models controlled for: maternal HIV status, access to electricity and safe water, and having total grant income above 2000 ZAR
*
p-value < 0.1,, ** p-value < 0.05, *** p-value < 0.001 (t-tests or χb tests); † p-value < 0.1, †† p-value < 0.05, ††† p-value < 0.001 for regression analyses
a
Mixed-effects linear regression for continuous outcomes; b Mixed-effects logistic regression for binary outcomes; c Multivariate logistic regression for binary
outcomes; d Multivariate negative binomial regression for count outcomes
e
Random-intercept for child
f
Random-slope for time using unstructured covariance
g
Random-slope for time using identity covariance structure
two groups in terms of having up-to-date immuniza- Discussion
tions, receiving vitamin A, WHO developmental mile- Home-visits by Philani CHWs had limited, yet import-
stones, clinic visits for illness, or consulting with a ant, health effects on mothers and their children. Mater-
private doctor in the past 3 months, but there was a nal depressive symptoms were fewer and child health
trend towards fewer hospital visits for illness in the care behaviours were enhanced. Antenatal visits were
intervention group (OR: 0.5; 95% CI 0.3, 1.1). higher, and exclusive breastfeeding rates at 6-months
Maternal HIV status tended to modify the effect of the were higher (especially amongst HIV negative women)
intervention on exclusive breastfeeding for 6 months and mothers were less likely take their children to a
(p = 0.09; likelihood ratio test). In particular, the effect of traditional healer. MLH in the intervention group were
the intervention was strong for mothers who were not more likely to be giving their children co-trimoxazole at
HIV infected (OR: 2.1; 95% CI: 1.2, 3.4), indicating about 6-months. Children tended to have fewer hospital visits,
a two-fold increase in the odds of exclusive breastfeeding fewer symptoms of illness in the preceding two weeks,
compared to the non-MLH in the comparison group were marginally less likely to be underweight-for-age
(see Table 4). There was no intervention effect observed and were significantly less likely to be wasted in the
on exclusive breastfeeding at 6 months for MLH. Mater- intervention group than the comparison group.
nal HIV status did not modify the effect of the interven- Many of these impacts can be attributed to specific in-
tion on any of the other maternal or child outcomes. terventions by CHWs: higher antenatal care attendance,
higher exclusive breastfeeding rates and lower traditional
healer visits are likely to be linked to strong repeated
Interventions to protect HIV-exposed infants messages given by CHW during home visits. Other ef-
MLH completed PMTCT tasks and other interventions fects may be more indirect – lower average depression
to protect their HIV-exposed infants (Fig. 3) at similar scores may be due to the benefits of peer support, while
rates with high compliance in terms of receiving ARVs nutritional and health benefits may be due to better
before or during pregnancy (n = 382; 98.0%); administer- breastfeeding practices by women who were regularly
ing infants Nevirapine (NVP) syrup soon after birth (n = visited and supported in this by CHW.
370; 94.9%); adhering to ARVs at 6-months (n = 282; Mothers in the intervention condition had lower aver-
94.6%) and completing infant PCR testing (n = 278; age depressed mood scores, but the clinical impact of
93.6%). However, MLH in the intervention group were this is difficult to quantify, as mean EPDS scores were
much more likely to be giving infants co-trimoxazole at well below 13. Most studies of maternal depression
6-months (37.7% vs 17.1%; p < 0.01) compared to MLH (even those using a screening tool) find rates of at least
in the comparison group. 20% [33, 34]. The impact of CHW on depression is con-
sistent with previous findings in both peri-urban [35, 36]
and rural settings (L Stansert Katzen et al. 2019 – in
Table 4 Effect modification by maternal HIV status for submission). This may be attributed to the emotional
exclusively breastfeeding for 6 months and practical support provided by CHW during home-
Exclusively breastfeeding for 6 MLH Non-MLH
visits and this is an important area for future research.
months Additionally, it is notable that this study is the second
OR 95% CI OR 95% CI
from the Eastern Cape where overall EPDS scores are
Intervention vs. comparison group 0.9 (0.4, 2.3) 2.1 (1.2, 3.4)
much lower when compared to urban settings [37]. Thele Roux et al. BMC Public Health (2020) 20:1404 Page 11 of 14 Fig. 3 Interventions to protect HIV-exposed infants lower levels of depression may be attributed to stronger relatively high at about 61.6% (five times higher than in family ties and community resources, despite poverty peri-urban settings [43]. and inadequate government services, and a healthier liv- Finally, in terms of clinical symptoms and care behav- ing environment as compared to peri-urban settlements. iours, infants in the intervention group were significantly More research is required to elucidate this. less likely to have experienced one of six symptoms of Home visiting resulted in fewer underweight infants as common childhood illnesses, and independently had less well as wasted infants over time. Other studies have vomiting, coughing and coryza (runny nose) than chil- shown that maternal characteristics such as mother’s dren in the comparison group. This may be due to the antenatal care and place of delivery were predictive of health benefits of higher exclusive breastfeeding rates in underweight, stunted and wasted infants. However, these the intervention group or other care behaviours data were cross-sectional and not longitudinal [20]. imparted by CHW to mothers. Hospital visits, a proxy As expected, our findings of wasting is similar to a for potentially serious illnesses, were also marginally less meta-analyses that found wasting is more prevalent in common in the intervention group. (Most women take rural areas than compared to urban settings [38] and are their children to their nearest PHC clinic when unwell, more prevalent in households with low SES compared to children who are very ill or do not respond to clinic higher SES [39]. However, the percentage of children treatment are referred to the district hospital. On occa- who are wasted at birth (35%) is striking, even as this sion, severely ill children will be taken directly to the improves to 4.6% (intervention) and 9.4% (control) by 6 hospital). Mothers in the comparison group were more months. Additionally, mothers in the intervention group likely to take their children to traditional healers and to attended significantly more antenatal visits during preg- private pharmacies for health consultations. The latter is nancy, which is linked to better pregnancy outcomes most likely due to the fact that the comparison area is [40] and in line with WHO Antenatal Guidelines that significantly closer to the nearest big town which has a promote additional antenatal visits. Intervention group private pharmacy with a consulting nurse on the prem- mothers also engaged in healthier infant feeding behav- ises. Consulting traditional healers is common in rural iours. The appropriate feeding of infants is seen as crit- villages of South Africa, and may result in children being ical to their health, growth and well-being [41], and exposed to harmful or even fatal treatments [44, 45]. It mothers who received the intervention were more likely is interesting that mothers in the comparison group to exclusively breastfeed their infants for 6 months, and were nearly five times the odds more likely to seek a were less likely to mix cereal porridge into their formula traditional healer’s advice or treatment than those in the bottle if not exclusively breastfeeding - which is regarded intervention group. This may be attributed to CHWs as a potentially harmful feeding practice [42]. A key themselves having trust in local government PHC clinics aspect of the support CHWs provide is feeding advice – and therefore facilitating access to clinics and the district and it was important that there were higher levels of hospital for mothers in the intervention group by pro- exclusive breastfeeding at 6 months and less mixing of viding referral letters or accompanying mothers to porridge with formula. Breastfeeding rates were facilities.
le Roux et al. BMC Public Health   (2020) 20:1404                                                                             Page 12 of 14

  The effect modification of HIV on exclusive breast-         Conclusion
feeding at 6 months was notable: removing MLH from            This study shows limited but important effects of a
the analysis shifted the odds ratio of this practice          CHW home-visiting program in a deeply rural area of
from 1.8 to 2.1 for the intervention group (Table 4).         South Africa. It appears that the positive impact of
We suspect that this is due to the strong ART                 CHWs on health outcomes is more difficult to achieve
programme at Zithulele Hospital and its clinics,              in the rural context than in more densely populated
where pregnant mothers are carefully counselled and           urban and peri-urban areas [18]. This needs to be con-
encouraged to exclusively breastfeed, thereby increas-        sidered when implementing rural CHW programs and
ing the proportion of mothers in the control area             greater investments in transport and support of CHWs
who are well counselled and therefore choose to               may be required to ensure the effectiveness of the inter-
exclusively breastfeed, diluting the measurable impact        vention. It is important to recognise that the CHWs
of the CHW breastfeeding counselling and support in           assessed in this study had only been established in the
the intervention area.                                        area for 12–18 months and that assessments of other
  For MLH, the rate of co-trimoxazole uptake from 6           CHW programs occurred after these programs had em-
weeks after birth was significantly higher in the interven-   bedded themselves into communities over many years
tion group than in the comparison group, yet, at 37%,         [18]. Nevertheless, mothers who were visited by CHWs
was still concerningly low. This may have been due to         before and for up to a 6 months after delivery exclusively
co-trimoxazole syrup stock-outs in clinics at the time of     breastfed for longer, attended antenatal care more often,
the study or nurses may have been unaware of co-              had lower levels of depressive symptoms and higher
trimoxazole guidelines for HIV-exposed infants. It is         trust in government healthcare services. Their children
however encouraging that compliance of other interven-        were also significantly less likely be wasted at 6-months.
tions to protect HIV-exposed infants (see Fig. 3) in both     In conclusion, CHWs have an important role to play in
conditions was higher than 90% - even in this deeply          the provision of PHC services in rural areas, but need to
rural area - likely an important factor undergirding the      be managed in the light of the rural context and
dramatic decrease in HIV incidence in children in South       supported accordingly.
Africa over the past years [46].
                                                              Abbreviations
  The Cape Town randomized controlled trial evaluating        CHW: Community health workers; PHC: Primary healthcare clinics; SA: South
the CHW program showed more substantial impacts on            African; NDOH: National Department of Health; NGO: Non-Governmental
mothers and their babies, particularly in “Interventions      Organization; PMTCT: Prevention of mother-to-child HIV transmission;
                                                              ZAR: South African Rand; EPDS: Edinburgh Postnatal Depression Scale;
to protect HIV-exposed infants”, there referred to as the     RtHC: Road-to-Health-Card; W.H.O: World Health Organization; HAZ: Height-
“PMTCT cascade” [18]. However, since the study in             for-age z scores; WAZ: Weight-for-age z scores; WHZ: Weight-for-height z
Cape Town was performed in 2008, the implementation           scores; MLH: Mothers living with HIV; ARV: Antiretroviral; NVP: Nevirapine;
                                                              ART: Anti-retroviral therapy; FDC: Fixed dose combination; TEE: Tenofovir/
of government PMTCT protocols have improved                   Emtricitabine/Efavirenz
markedly in PHC clinics to close to 90% as illustrated
above. The impact of CHW is therefore more difficult to       Acknowledgements
quantify with baseline compliance rates so high.              Not applicable.

                                                              Authors’ contributions
                                                              KLR, MT, ILR, and MJR designed the study. KLR, NM, and ILR were responsible
Limitations                                                   for the preparation and implementation of the project. KLR was responsible
                                                              for the overall design of the manuscript, and ED, LS, KLR, MT, MJR, EA and
While the matching of the two arms was mostly success-        PHR all wrote sections of the manuscript. KLR, MT, MJR, PHR, VB, and NM
ful, there were significant differences between the two       provided critical revisions to the manuscript.. EA and PHR were responsible
areas in terms of access to safe drinking water and elec-     for data analytics. ILR and NM helped train community health workers. ED
                                                              and VB supervised field operations and managed the acquisition of data in
tricity. The intervention area had good access to safe        collaboration with LSK and KLR. All authors have read and approved the
municipal water, but poor access to electricity, while in     manuscript.
the comparison area the inverse was true. It is difficult
to know what the impact of this balance of municipal          Funding
                                                              This study was funded by the National Institute of Mental Health (NIMH;
services was on the mothers and their babies and              R01MH111391), the ELMA Foundation and the Church of Sweden. None of
whether one or other area was “advantaged” by this            the funders were involved in the design of the study, nor were they
difference, although these were corrected for in the          involved in the collection, analysis, and interpretation of data and in writing
                                                              the manuscript.
analyses. A cluster randomized controlled trial would be
more robust to avoid confounders in further evaluations.      Availability of data and materials
We also did not assess the intervention dosage or have        The raw datasets generated and/or analyzed during the current study are
                                                              not publicly available due to the sensitivity and availability of geographic
access to maternal HIV testing results and had to rely        data, but anonymized data sets are available from the corresponding author
on self-report.                                               on reasonable request.
le Roux et al. BMC Public Health (2020) 20:1404 Page 13 of 14
Ethics approval and consent to participate 14. Horwood C, Butler L, Barker P, Phakathi S, Haskins L, Grant M, et al. A
Permission to recruit pregnant women at health facilities was granted by the continuous quality improvement intervention to improve the effectiveness
Eastern Cape Department of Health through the Office of Epidemiological of community health workers providing care to mothers and children: a
Research and Surveillance Management and ethics approval was granted by cluster randomised controlled trial in South Africa. Hum Resour Health.
Health Research Ethics Committee at Stellenbosch University, N14/03/019. 2017;15(1):39.
Informed consent had been obtained from participants. All participants 15. Moshabela M, Sips I, Barten F. Needs assessment for home-based care and
signed a written informed consent form. Participants under the age of 18 the strengthening of social support networks: the role of community care
had a parent or guardian sign a written informed consent form. workers in rural South Africa. Glob Health Action. 2015;8:29265.
16. Brenner JL, Kabakyenga J, Kyomuhangi T, Wotton KA, Pim C, Ntaro M, et al.
Consent for publication Can volunteer community health workers decrease child morbidity and
Not applicable. mortality in southwestern Uganda? An impact evaluation. PLoS One. 2011;
6(12):e27997.
Competing interests 17. Haines A, Sanders D, Lehmann U, Rowe AK, Lawn JE, Jan S, et al. Achieving
The authors declare that they have no competing interests. child survival goals: potential contribution of community health workers.
Lancet. 2007;369(9579):2121–31.
Author details 18. le Roux I, Tomlinson M, Harwood JM, O'Connor MJ, Worthman CM, Mbewu
1
Institute for Life Course Health Research, Department of Global Health, N, et al. Outcomes of home visits for pregnant mothers and their infants: a
Stellenbosch University, Tygerberg, South Africa. 2Zithulele Training and cluster randomized controlled trial. AIDS. 2013;27(9):1461–71.
Research Centre, Zithulele Hospital, Ginyintsimbi Village, Eastern Cape, South 19. Tomlinson M, Rotheram-Borus MJ, le Roux IM, Youssef MK, Nelson S,
Africa. 3Family Medicine Department, Walter Sisulu University, Mthatha, South Scheffler A, et al. Thirty-Six-Month Outcomes of a Generalist
Africa. 4Primary Healthcare Directorate, University of Cape Town, Cape Town, Paraprofessional Perinatal Home Visiting Intervention in South Africa. Prev
South Africa. 5Department of Psychiatry and Biobehavioral Sciences, Semel Sci. 2016.
Institute, University of California, 10920 Wilshire Boulevard, Suite 350, Los 20. Olusanya BO, Wirz SL, Renner JK. Prevalence, pattern and risk factors for
Angeles, CA 90024-6521, USA. 6Philani Maternal, Child Health and Nutrition undernutrition in early infancy using the WHO multicentre growth
Trust, Site C, Khayelitsha, Cape Town, South Africa. 7School of Nursing and reference: a community-based study. Paediatr Perinat Epidemiol. 2010;24(6):
Midwifery, Queens University, Belfast, UK. 572–83.
21. Wilford A, Phakathi S, Haskins L, Jama NA, Mntambo N, Horwood C.
Received: 11 March 2020 Accepted: 28 August 2020 Exploring the care provided to mothers and children by community health
workers in South Africa: missed opportunities to provide comprehensive
care. BMC Public Health. 2018;18(1):171.
References 22. Rotheram-Borus MJ, le Roux IM, Tomlinson M, Mbewu N, Comulada WS, le
1. Silal SP, Penn-Kekana L, Harris B, Birch S, McIntyre D. Exploring inequalities Roux K, et al. Philani plus (+): a Mentor mother community health worker
in access to and use of maternal health services in South Africa. BMC Health home visiting program to improve maternal and infants' outcomes. Prev
Serv Res. 2012;12:120. Sci. 2011;12(4):372–88.
2. TAC. State of Provincial Healthcare System SPotlight on KwaZulu- - - Natal 23. Rotheram-Borus MJ, Tomlinson M, le Roux IM, Harwood JM, Comulada S,
May 2018, (May). 2018. O'Connor MJ, et al. A cluster randomised controlled effectiveness trial
3. Harris B, Goudge J, Ataguba JE, McIntyre D, Nxumalo N, Jikwana S, et al. evaluating perinatal home visiting among south African mothers/infants.
Inequities in access to health care in South Africa. J Public Health Policy. PLoS One. 2014;9(10):e105934.
2011;32(Suppl 1):S102–23. 24. Tomlinson M, Rotheram-Borus MJ, Harwood J. et al. Community health
4. Singh P, Sachs JD. 1 million community health workers in sub-Saharan workers can improve child growth of antenatally-depressed, South African
Africa by 2015. Lancet. 2013;382(9889):363–5. mothers: a cluster randomized controlled trial. BMC Psychiatry. 2015;15;225.
5. Olaniran A, Smith H, Unkels R, Bar-Zeev S, van den Broek N. Who is a https://doi.org/10.1186/s12888-015-0606-7.
community health worker? - a systematic review of definitions. Glob Health 25. Writer S. The richest and poorest municipalities in South Africa Businesstech.
Action. 2017;10(1):1272223. co.za: BusinessTech; 2016.
6. Strachan DL, Kallander K, Ten Asbroek AHA, Kirkwood B, Meek SR, Benton L, 26. King Sabata Dalindyebo. Wazimap. 2016 [cited February 14, 2020]. Available
et al. Interventions to improve motivation and retention of community from: https://wazimap.co.za/profiles/municipality-EC157-king-sabata-
health workers delivering integrated community case management (iCCM): dalindyebo/.
stakeholder perceptions and priorities. Am J Trop Med Hyg. 2012;87(5 27. Le Roux K, Akin-Olugbade O, Katzen LS, Laurenzi C, Mercer N, Tomlinson M,
Suppl):111–9. et al. Immunisation coverage in the rural eastern cape - are we getting the
7. Swider SM. Outcome effectiveness of community health workers: an basics of primary care right? Results from a longitudinal prospective cohort
integrative literature review. Public Health Nurs. 2002;19(1):11–20. study. S Afr Med J. 2016;107(1):52–5.
8. Austin-Evelyn K, Rabkin M, Macheka T, Mutiti A, Mwansa-Kambafwile J, 28. Cox JL, Holden JM, Sagovsky R. Detection of postnatal depression.
Dlamini T, et al. Community health worker perspectives on a new primary Development of the 10-item Edinburgh postnatal depression scale. Br J
health care initiative in the eastern cape of South Africa. PLoS One. 2017; Psychiatry. 1987;150:782–6.
12(3):e0173863. 29. Tsai AC, Scott JA, Hung KJ, Zhu JQ, Matthews LT, Psaros C, et al. Reliability
9. le Roux K, le Roux I, Mbewu N, Davis E. The Role of Community Health and Validity of Instruments for Assessing Perinatal Depression in African
Workers in the Re-Engineering of Primary Health Care in Rural Eastern Cape. Settings: Systematic Review and Meta-Analysis. PLoS ONE. 2013;8(12):
S Afr Fam Pract. 2015;57(2):116–20. e82521. https://doi.org/10.1371/journal.pone.0082521.
10. Siruma A, Hornby D, Srinivas S. An assessment of maternal health issues in 30. Tomlinson M, Rotheram-Borus MJ, Scheffler A, le Roux I. Antenatal
two villages in the eastern cape province of South Africa. Int J Environ Res depressed mood and child cognitive and physical growth at 18-months in
Public Health. 2014;11(9):9871–84. South Africa: a cluster randomised controlled trial of home visiting by
11. Swartz A, Colvin CJ. It's in our veins': caring natures and material community health workers. Epidemiol Psychiatr Sci. 2018;27(6):601–10.
motivations of community health workers in contexts of economic 31. W.H.O. WHO Child Growth Standards based on length/height, weight and
marginalisation. Crit Public Health. 2015;25(2):139–52. age. Acta Paediatr Suppl. 2006;450:76–85.
12. Perry HB, Zulliger R, Rogers MM. Community health workers in low-, middle- 32. De Onis M. WHO motor development study: windows of achievement
, and high-income countries: an overview of their history, recent evolution, for six gross motor development milestones. Acta Paediatr Suppl. 2006;
and current effectiveness. Annu Rev Public Health. 2014;35:399–421. 450:86–95.
13. Gilmore B, McAuliffe E. Effectiveness of community health workers 33. Hartley M, Tomlinson M, Greco E, Comulada WS, Stewart J, le Roux I, et al.
delivering preventive interventions for maternal and child health in low- Depressed mood in pregnancy: prevalence and correlates in two Cape
and middle-income countries: a systematic review. BMC Public Health. 2013; Town peri-urban settlements. Reprod Health. 2011;8:9.
13:847.le Roux et al. BMC Public Health (2020) 20:1404 Page 14 of 14
34. Cooper PJ, Tomlinson M, Woolgar L, Murray M, Molteno C. Post-partum
depression and the mother-infant relationship in a south African peri-urban
settlement. Br J Psychiatry. 1999;175(6):554–8.
35. Tsai AC, Tomlinson M, Dewing S, le Roux IM, Harwood JM, Chopra M, et al.
Antenatal depression case finding by community health workers in South
Africa: feasibility of a mobile phone application. Archiv Women Ment
Health. 2014;17(5):423.
36. Tomlinson M, Rotheram-Borus MJ, le Roux IM, Youssef M, Nelson SH,
Scheffler A, et al. Thirty-six-month outcomes of a generalist paraprofessional
perinatal home visiting intervention in South Africa on maternal health and
Child health and development. Prev Sci. 2016;17(8):937–48.
37. Christodoulou J, Le Roux K, Tomlinson M, Le Roux IM, Katzen LS, Rotheram-
Borus MJ. Perinatal maternal depression in rural South Africa: Child
outcomes over the first two years. J Affect Disord. 2019;247:168–74.
38. Ozaltin E, Hill K, Subramanian SV. Association of maternal stature with
offspring mortality, underweight, and stunting in low- to middle-income
countries. JAMA. 2010;303(15):1507–16.
39. Finlay JE, Ozaltin E, Canning D. The association of maternal age with infant
mortality, child anthropometric failure, diarrhoea and anaemia for first
births: evidence from 55 low- and middle-income countries. BMJ Open.
2011;1(2):e000226.
40. W.H.O. WHO recommendations on antenatal care for a positive pregnancy
experience. World Health Organization. 2016.
41. Victora CG, Bahl R, Barros AJ, Franca GV, Horton S, Krasevec J, et al.
Breastfeeding in the 21st century: epidemiology, mechanisms, and lifelong
effect. Lancet. 2016;387(10017):475–90.
42. Rubertsson S. Go with the (milk) flow - infant feeding practices and
premature introduction of solids in rural eastern Cape South Africa. Lund
University; 2018.
43. le Roux IM, Tomlinson M, Harwood JM, O'Connor MJ, Worthman CM,
Mbewu N, et al. Outcomes of home visits for pregnant mothers and their
infants: a cluster randomized controlled trial. AIDS. 2013;27(9):1461–71.
44. Bland RM, Rollins NC, Van den Broeck J, Coovadia HM, Child HG. The use of
non-prescribed medication in the first 3 months of life in rural South Africa.
Tropical Med Int Health. 2004;9(1):118–24.
45. Peltzer K, Phaswana-Mafuya N, Treger L. Use of traditional and
complementary health practices in prenatal, delivery and postnatal care in
the context of HIV transmission from mother to child (PMTCT) in the
eastern cape, South Africa. Afr J Tradit Complement Altern Med. 2009;6(2):
155–62.
46. Barron P, Pillay Y, Doherty T, Sherman G, Jackson D, Bhardwaj S, et al.
Eliminating mother-to-child HIV transmission in South Africa. Bull World
Health Organ. 2013;91(1):70–4.
Publisher’s Note
Springer Nature remains neutral with regard to jurisdictional claims in
published maps and institutional affiliations.You can also read