Company Overview January 2023
←
→
Page content transcription
If your browser does not render page correctly, please read the page content below
Company Overview
January 2023

               1
Disclaimer
 Forward-Looking Statements. Statements in this presentation and the accompanying oral presentation that are not statements of historical fact are forward-looking statements. Such forward-looking statements include, without
limitation, statements regarding the Company’s future results of operations or financial condition, business strategy and plans, and objectives of management for future operations. Words such as “anticipate,” “believe,” “contemplate,”
“continue,” “could,” “estimate,” “expect,” “intend,” “may,” “plan,” “potential,” “predict,” “project,” “should,” “target,” “toward,” “will,” or “would,” or the negative of these words or other similar terms or expressions are intended to identify
forward-looking statements, though not all forward-looking statements necessarily contain these identifying words. You should not rely on forward-looking statements as predictions of future events. We have based the forward-looking
statements primarily on our current expectations and projections about future events and trends that we believe may affect our business, financial condition, and results of operations. The outcome of the events described in these
forward-looking statements is subject to risks, uncertainties, and other factors. Moreover, we operate in a very competitive and rapidly changing environment. New risks and uncertainties emerge from time to time, and it is not possible
for us to predict all risks and uncertainties that could have an impact on the forward-looking statements. The results, events, and circumstances reflected in the forward-looking statements may not be achieved or occur, and actual
results, events or circumstances could differ materially from those described in the forward-looking statements. We undertake no obligation to update any forward-looking statements made in this presentation to reflect events or
circumstances after the date of this presentation or to reflect new information, actual results, revised expectations or the occurrence of unanticipated events, except as required by law. We may not actually achieve the plans, intentions
or expectations disclosed in our forward-looking statements, and you should not place undue reliance on our forward-looking statements. Our forward-looking statements do not reflect the potential impact of any future acquisitions,
mergers, dispositions, joint ventures or investments. Such forward-looking statements are subject to known and unknown risks, uncertainties, assumptions and other important factors, many of which are outside Dutch Bros’ control that
could cause actual results to differ materially from the results discussed in the forward-looking statements, including those related to disruptions in our supply chain, ability to hire and retain employees, inflation, changes in consumer
demand, increased minimum wages, increased commodity costs, the conflict between Russia and Ukraine, taxes and tax rates, the COVID-19 pandemic, and other risks, including those described under the heading “Risk Factors” in
our Annual Report on Form 10-K for the year ended December 31, 2021 filed with the SEC on March 11, 2022, our Quarterly Report on Form 10-Q for the period ended September 30, 2022 filed with the SEC on November 10, 2022,
and in our future reports to be filed with the SEC. Forward-looking statements contained in this presentation are made as of this date, and Dutch Bros undertakes no duty to update such information except as required under applicable
law.

Non-GAAP Measures. The Company prepares and presents its consolidated financial statements in accordance with generally accepted accounting principles in the United States (“GAAP”). However, management believes that certain
non-GAAP financial measures, such as Adjusted Selling, General, and Administrative and Company-operated Shop Contribution provides investors with additional useful information in evaluating the Company’s core operating
performance. These non-GAAP financial measures, which may be different than similarly titled measures used by other companies, are presented to enhance investors’ overall understanding of our financial performance and should not
be considered a substitute for, or superior to, the financial information prepared and presented in accordance with GAAP. We believe that these non-GAAP financial measures provide useful information about our financial performance,
enhance the overall understanding of our past performance and future prospects and allow for greater transparency with respect to important measures used by our management for financial and operational decision making. We are
presenting these non-GAAP financial measures to assist investors in seeing our financial performance using a management view and because we believe that these measures provide an additional tool for investors to use in comparing
our core financial performance over multiple periods with other companies in our industry. We urge you not to rely on any single financial measure to evaluate our business.

 Market and Industry Data. This presentation contains estimates and information concerning our industry, including market position and the size and growth rates of the markets in which we participate, that are based on industry
publications and reports and other information from our internal sources. This information involves a number of assumptions and limitations, and you are cautioned not to give undue weight to these estimates. We have not
independently verified the accuracy or completeness of the data contained in these industry publications and reports. The industry in which we operate is subject to a high degree of uncertainty and risk.

Dutch Bros, our Windmill logo ( ), Dutch Bros. Blue Rebel and our other registered and common law trade names, trademarks and service marks are the property of Dutch Bros Inc. All other trademarks, trade names and service marks appearing in this
presentation are the property of their respective owners. Solely for convenience, the trademarks and trade names in this presentation may be referred to without the ® and ™ symbols, but such references should not be construed as any indicator that their
respective owners will not assert their rights thereto.

                                                                                                                             2
3

WHO WE ARE
BROS is a uniquely positioned growth company

  1.   A BEVERAGE company focused on Speed, Quality, and Service. Beverage
       occasions lead to daily repetition.
  2.   Our Blue Rebel® proprietary ENERGY drink and a high degree of
       CUSTOMIZATION are key points for differentiation
  3.   Delivering consistent Revenue and unit GROWTH throughout a period of
       generational disruption (COVID) speaks to our ability to EXECUTE

                                     4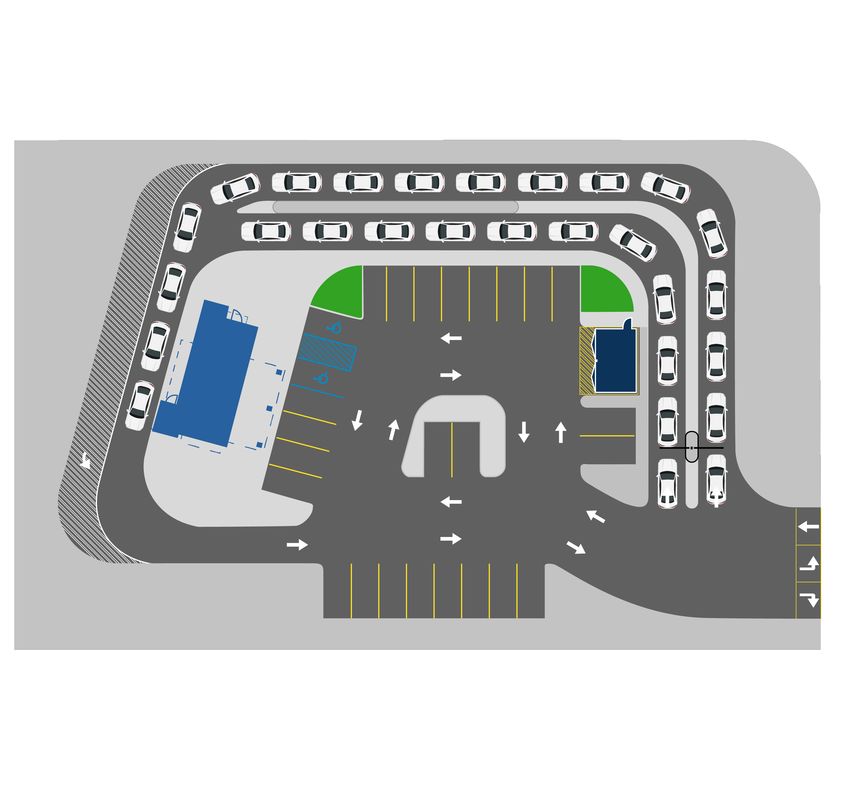
CONSISTENT AND PREDICTABLE GROWTH

                        What We’ve Delivered                             What’s Next:
 Consistent Revenue       • Doubled shops, tripled revenue since 2019      • 5-year goal of 800 shops by 2023 will be
                                                                               exceeded
and New Shop Growth       • Opened 30+ shops in 6 consecutive quarters
                                                                           • $1B TTM Revenue late 2023, early 2024
                                                                           • Reach 1,000 shop milestone in H1 2025

   Expanding AUVs          • New shop AUVs (+35% vs. class of 2017 and Prior)
 Demonstrate Demand        • Newer shop AUVs are steady and consistent
                           • AUVs strong despite aggressive fortressing to balance service times, capture share
    for Dutch Bros

   New Shops have         • Quick maturation curve, reaching 30%+ year-2 EBITDA target several quarters post
                            open
    Predictable and       • New shops are beginning to have positive effect on overall margins
 Attractive Economics     • Achieving G&A leverage while making investments in growth capabilities

                                                 5
Why We are Confident for the Future

   Simple and Elegant         • 90% drive-thru
                              • Flexible systems + simple ingredient basket + high customization
         Model                • High AUVs spread across dayparts with a solid evening business

 Differentiated Customer     • Consistent, great service, makes Dutch Bros a highlight to any customer’s day
                             • This creates lasting relationships that stick
         Service

 Compelling Product Mix      • Beverages are more routine than food
                             • Energy unlocks secondary afternoon daypart and new customer segments
                             • On-trend with cold beverages (80% TTM), enabler for high customization

  Strong Development         • Experienced real estate team, robust pipeline primed to deliver reliable, quality growth

        System

 Many Levers Still to Pull   • Loyalty program in early innings
                             • Middle of P&L initiatives to improve drink build and take out/redeploy costs

                                                   6
BUSINESS SNAPSHOT (Q3 2022)
641
Q3 Systemwide Shops
(+27% YoY) $313M $199M
671 Systemwide Sales
Q3 Revenue
Q4 Systemwide Shops (+53% YoY)
(+25% YoY)
90% 63%
Penetration of Loyalty
Drive Thru Mix
Transactions
20.0%
$1.9M $8.60 Company-Operated Shop Gross
Profit
Company-Operated
Systemwide Avg Check 25.6%
Shop AUV Company-Operated Shop
Contribution Margin1
58% Operating in
Company-Operated
14
Shop Mix States
1
Company-operated shop contribution margin is a non-GAAP measure, the GAAP to non-GAAP reconciliation are provided on slide 10.
7LONG-TERM GROWTH:
PROMISED AND DELIVERED
• From 2019-2022, shops almost doubled and revenue tripled (based on guidance)
• 6 consecutive quarters with at least 30 shop openings
SHOP COUNT REVENUE ($M)
150 new shops $950M - $1B
to 800+ total
2%
A G R: 2 671
C 45%
R : $725
538 C AG
441
$498
370
$327
$238
2019 2020 2021 2022 2023 Guidance 2019 2020 2021 2022 Guidance 2023 Guidance
8AUVS EXPANDING: WHILE OPENING NEW MARKETS AND
FORTRESSING AS WE GO
• New shops opened since 2017 have 35% higher AUVS’s
TTM AUV BY AGE CLASS ($M) DRIVERS OF AUV GROWTH
$2.50 • Newer, larger prototypes have
$2.00
$1.98 $1.96
$2.09 $2.07 superior circulation and
throughput potential
$1.50
$1.50
• Successful real estate
$1.00 strategy execution: targeting
higher-potential trade zones,
$0.50
while keeping rents affordable
$—
Class of 2017 & Class of 2018 Class of 2019 Class of 2020 Class of 2021
Prior
2021 Q4 2022Q1 2022Q2 2022Q3
9COMPELLING 4-WALL ECONOMICS
• 4-wall contribution margin recovering from COVID disruption, reaching 25.6%
in Q3, including 2.6% of preopening costs
Company-Operated Shop Results ($M)
2021 2022
Q4 Q1 Q2 Q3
$ % $ % $ % $ %
Company-operated shop revenues $ 114.2 100.0 % $ 130.2 100.0 % $ 160.5 100.0 % $ 173.5 100.0 %
Company-operated shop gross
profit1 16.6 14.5 % 16.6 12.8 % $ 31.2 19.4 % 34.7 20.0 %
Depreciation and amortization 5.3 4.6 % 7.1 5.5 % $ 8.3 5.2 % 9.6 5.6 %
Company-operated shop
contribution1 2 $ 21.8 19.1 % $ 23.8 18.3 % $ 39.5 24.6 % $ 44.3 25.6 %
Preopening costs $ 6.2 5.4 % $ 6.0 4.6 % $ 3.6 2.2 % $ 4.5 2.6 %
1
Preopening costs are included in Company-operated shop gross profit and Company-operated shop contribution.
2
Company-operated shop contribution is a non-GAAP measure.
10BROS VS. HIGH GROWTH PEERS
BROS compares favorably to our high-growth, company-operated peers around their IPO
3-YEAR REVENUE CAGR1 3-YEAR UNIT COUNT CAGR1
Beginning 1-Year Prior to Beginning 1-Year Prior to
IPO IPO
BROS (2019 - 2022 Guidance) 69%
BROS (2019 - 2022) 50%
SHAK (2014 - 2017) 46%
SHAK (2014 - 2017) 43%
CMG (2005 - 2008) 29%
CMG (2005 - 2008) 20%
SBUX (1991 - 1994) 71%
SBUX (1991 - 1994) 55%
1
Revenue and unit count are based on U.S. company-owned shops except for SBUX which represents North American company-owned retail and CMG revenue which includes international units.
Note: Data points in the charts on this slide for SHAK, CMG, and SBUX come from each company’s public filings. Dutch Bros makes no representation regarding the accuracy or reliability of such data
points or the information on which they are based. The comparisons in the charts on this slide are based upon our historical data and are not indicative of, nor intended to forecast, future performance.
11TRAFFIC DRIVING STRATEGIES FOR 2023
Even as we expand, real opportunities for growth and improvement are achievable
Aspect Initiatives Desired Outcomes
Loyalty Targeted 1:1 offers for rewards members Increase frequency, menu exploration
Increased throughput, higher consistency,
Tap System Deploy Rebel and cold brew tap systems in new and select existing shops waste reduction
Improve scheduling and labor deployment to increase on/off peak Increased throughput, improved broista and
Labor Deployment efficiency customer experience
Improved broistas experience, and increased
Shop Layout Improve shop ergonomics to simplify processes throughput
Improved broistas and customer experience,
POS Enhancement Simplify order experience and increase POS versatility and increased throughput
Train broistas and customers on time-saving benefits of paying with Increased throughput, higher stored value
Dutch Pass stored value. Shave time off payment process in fast-paced environment usage (via points offer incentives, initially)
12LONG-TERM (5-10 YEAR) GROWTH TARGETS
ANNUAL SYSTEM SHOP GROWTH Mid-Teens Annual Growth
SYSTEM SAME-SHOP SALES Low Single Digits
REVENUE GROWTH ~20%
ADJ. EBITDA Higher Than Revenue Growth
Note: This slide includes goals that are forward-looking, are subject to significant business, economic, regulatory and competitive uncertainties and contingencies, many of which are beyond the control
of the Company and its management and are based on assumptions with respect to future decisions, which are subject to change. Actual results will vary and those variations may be material. Nothing
in this presentation should be regarded as a representation by any person that these goals will be achieved, and the Company undertakes no duty to update its goals.
13Appendix
1
14 STATES TODAY WITH PATH TOWARDS
4,000+ SHOPS IN 10-15 YEARS
       65                                                                             4,000+
                                                                                      POTENTIAL
  155
            36                                                             LONG-TERM DUTCH BROS LOCATIONS
                                                                             Balance between infill and new geographies
                                                                             • Fortressing increases market share /
       28                                                                       acceptable wait times via Sales Transfer
 124           22
                            39                                               Company-operated focus
                                            4             3                  • All new states company-operated

             71                                 14                6
                          8                                                  “Smiley Face” expansion strategy
                                                                             • Focusing development around the mouth of
                                                                               the “smile”
                                         96                                  • From PNW, through CA and Southwest, Texas,
                                                                               Southeast, up to Mid-Atlantic
  Dutch Bros Locations1                                                      • TAM excludes Northeast, Midwest, and dense
  Future Development                                                           urban cores (i.e. SFO, DTLA)
  Outside 4,000+ Shop Target
                                                                             Near-term focus on CA and TX
                                                                             • ~60% of development in 2023

                 Note 1: State count is as of December 31, 2022
                                                                      15
THE DUTCH BROS EXPERIENCE
Walk-up ordering
window
1 4
CUSTOMERS CUSTOMER
ENTER QUEUE RECEIVES
for single drive-thru
1 HANDCRAFTED
window via multiple BEVERAGE
feeder lanes and leaves via exit lane
4
h
Shop
Dutc
2 RUNNERS GREET
3 ‘ESCAPE LANE’
CUSTOMERS PROVIDES
with tablets to explain CONVENIENT EXIT
menu, take personalized Runners serve customer
orders and facilitate prior to reaching window,
payments 3 if their order is complete
2 prior to customers’ ahead
in line
16HIGH DEGREE OF CUSTOMIZATION LED
BY COLD BEVERAGES
• 80%+ of menu is cold and ~50% is coffee-based
• Our proprietary energy drink product (Blue Rebel) is 27% of net sales1, reaching new customer occasions and anchoring afternoon/
late night daypart
Diverse Beverage Mix On-Trend “Cold” Format Across Multiple Dayparts
Rolling 12 Months Thru Q3 2022 Rolling 12 Months Thru Q3 2022 Net Sales Distribution by Daypart
Rolling 12 Months Thru Q3 2022
Coffee/Cold Brew 48%
Before 10am 27%
Rebel 23% Cold 84%
Tea/Lemonade 10% 10am - 3pm 37%
Frost/Smoothie 6%
3pm - 8pm 27%
Cocoa/Chai 7% Hot 16%
After 8pm 9%
Other 6%
—% 10% 20% 30% 40% 50% 60% —% 20% 40% 60% 80% 100% —% 10% 20% 30% 40%
1
For the nine months ended September 30, 2022.
17ACHIEVING G&A LEVERAGE
1. SG&A as a % of total revenue decreased 690bps to 22.8% from 29.7% in Q1 2022
2. Removing equity-based compensation and one-time expenses, adjusted SG&A was 17.5% in Q3, down 110bps vs. the prior year
3. SG&A includes our regional operator costs, that we expect to scale moderately over time as shop spans broaden
G&A Progression
2021 ¹ 2022
($ in thousands) Q1 Q2 Q3 Q4 Q1 Q2 Q3
Total revenues $ 98,785 $ 129,208 $ 129,803 $ 140,080 $ 152,156 $ 186,381 $ 198,648
Selling, general, and administrative 2 $ 35,986 $ 33,488 $ 153,700 $ 41,355 $ 45,214 $ 42,342 $ 45,378
As a percentage of total revenue 36.4 % 25.9 % 118.4 % 29.5 % 29.7 % 22.7 % 22.8 %
Adjustments
Equity-based compensation (14,650) (8,332) (124,779) (9,955) (9,900) (10,446) (10,649)
Expenses associated with equity offering (76) (2,253) (3,332) (862) — — —
Donations associated with equity offering — — (1,392) (2,400) — — —
COVID-19: prepaid costs not utilized — — — — (1,200) — —
Milestone events — — — — (2,434) — —
Total adjustments $ (14,726) $ (10,585) $ (129,503) $ (13,217) $ (13,534) $ (10,446) $ (10,649)
Adjusted selling, general, and administrative $ 21,260 $ 22,903 $ 24,197 $ 28,138 $ 31,680 $ 31,896 $ 34,729
As a percentage of total revenue 21.5 % 17.7 % 18.6 % 20.1 % 20.8 % 17.1 % 17.5 %
Compared to the prior year (0.7)% (0.6)% (1.1)%
1
Refer to NOTE 2 — Basis of Presentation and Summary of Significant Accounting Policies in our Quarterly Report on Form 10-Q for the quarter ended September 30, 2022 regarding our revised historical results related to an
immaterial error correction for employee sick leave accrual.
2
Selling, general, and administrative includes depreciation and amortization.
1819
You can also read