COMPANY PRESENTATIO N - JANUARY 2021 - Italmobiliare
←
→
Page content transcription
If your browser does not render page correctly, please read the page content below

COMPANY
 COMPANY
 PRESENTATIO
PRESENTATION
   N

JANUARY 2021
DISCLAIMER
                                                                                                                                                                 02
Information reported in this document (the "Document") has been compiled by Italmobiliare S.p.A. ("Italmobiliare" or the "Company") from public
sources and no representation or warranty, express or implied, is made, given or accepted by or on behalf of Italmobiliare as to the accuracy,
completeness or fairness of the information or opinions contained herein. Neither Italmobiliare nor any other person accepts any liability whatsoever
for any loss arising from any use of, or otherwise in connection with, the Document.
The information set out herein may be subject to updating, revision, verification and amendment and such information may change materially.
Italmobiliare undertakes no obligation to update or keep current the information contained in this document and any opinions expressed in them is
subject to change without notice or revise its outlook or forward-looking statements, whether as a result of new developments or otherwise.
Forward Looking Statement
This Document may contain forward-looking statements. These statements are based on current expectations and projections about future events
and, by their nature, are subject to inherent risks and uncertainties. They relate to events and depend on circumstances that may or may not occur
or exist in the future, and, as such, undue reliance should not be placed on them. Actual results may differ materially from those expressed in such
statements as a result of a variety of factors, including: continued volatility and further deterioration of capital and financial markets, changes in
commodity prices, changes in general economic conditions, economic growth and other changes in business conditions, changes in laws and
regulations and the institutional environment (in each case in Italy or abroad), and many other factors, most of which are beyond Italmobiliare
control. Italmobiliare expressly disclaims and does not assume any liability in connection with any inaccuracies in any of these forward-looking
statements or in connection with any use by any party of such forward-looking statements.
Not an Offer of Securities
The information provided in this Document is for informational purposes only and is not intended to be, nor should it be considered to be, an
advertisement or an offer or a solicitation of an offer to buy or sell any securities. The information herein, or upon which opinions have been based,
has been obtained from sources believed to be reliable, but no representations, expressed or implied, or guarantees, can be made as to their
accuracy, timeliness or completeness. All opinions and information set forth herein are subject to change without notice. Past performance should
not be taken as an indication or guarantee of future performance, and no representation or warranty is made regarding future performance.
Before entering into any transaction, you should take steps to ensure that you understand and have made an independent assessment of the
appropriateness of the transaction in light of your own objectives and circumstances, including the possible risks and benefits of entering into such
transaction. You should also consider making such independent investigations by discussing the transaction with your professional tax, legal,
accounting, and other advisors.
This Document is being delivered for information purposes only to a very limited number of persons and companies who are ‘qualified investors’
within the meaning of section 86(7) of FSMA purchasing as principal or in circumstances under section 86(2) of FSMA, as well as persons who have
professional experience in matters relating to investments and who fall within the category of persons set out in Article 19 of the Financial Services
and Markets Act 2000 (Financial Promotion) Order 2005 (the “Order”) or are high net worth companies within the meaning set out in Article 49 of the
Order or are otherwise permitted to receive it (together, the "Relevant Persons"). This Document is distributed only to and directed only at Relevant
Persons and must not be acted on or relied upon by persons who are not Relevant Persons. Any other person who receives this Document should
not rely or act upon it. By accepting this Document and not immediately returning it, the recipient is deemed to represent and warrant that: (i) they
are a person who falls within the above description of persons entitled to receive the Document; (ii) they have read, agree and will comply with the
contents of this notice; and (iii) they will use the information in this Document solely for evaluating their possible interest in acquiring securities of the
Company. If you are in any doubt as to the matters contained in this Document (including whether you fall within the definitions of Qualified Investor
or Relevant Person) you should consult an authorised person specialising in advising on investments of the kind contained in this Document. Any
investment or investment activity to which this Document relates is available only to Qualified Investors and Relevant Persons.
03
        Italmobiliare: Overview
INDEX

        Investment Portfolio

        Focus on portfolio companies

        Closing remarks

        Appendix
Identity & mission and strategic approach

                    IDENTITY                                                   INVESTMENT STRATEGY
“Italmobiliare Investment Holding holds and
manages a diversified investment and equities                       Focus on Italian champions operating in resilient
portfolio with a strategic vision underpinned by a                  industrial, services, and consumer sectors
financial and industrial history going back more                    with strong brands, distinctive capabilities, and
                                                         FOCUS
than 150 years”                                                     international presence
                                                                    Flexible approach on investments, usually
                                                                    focused on entrepreneurs skills and talent

                    MISSION
                                                                    Contribution to value creation of portfolio
“Playing a pro-active and continuous role in the
growth and enhancement of the portfolio aiming                      companies with strategic and financial
at developing, innovating, and diversifying                         support for organic and M&A growth, as well
internationally its investments with an effective    VALUE CREATION as identification of synergies between portfolio
governance and risk management model,                 AND NETWORK companies and Italmobiliare itself
integrating ESG principles”
                                                                    Private equity investments provide Italmobiliare
                                                                    and its direct investee companies a global
                                                                    footprint for business opportunities

                                                                 Leverage on Italmobiliare's long history of
                                                                 listed holding of multinational companies to

 04
                                                      GOVERNANCE
                                                                 provide support to investee companies on
                                                                 matters as governance, sustainability, code of
                                                                 ethics, etc.
•      Investment holding since 1946

     I t al m obiliare a t a gl an c e        •      Majority shareholder: Pesenti family, active in the Italian business community
                                                     for over 150 years

                                              •      Focus on equity investments

                                              •      NAV: Euro 1.7 bn(1)

                                              •      Listed on STAR segment of Borsa Italiana

                                              •      Market cap: approx. Euro 1.2 bn(2)

                                              •      Total shareholders return last 5 years: 83%(2)

                                              •      Ordinary dividend of €0.6 per share (2.1%yield)(2)

                                              •      Extraordinary dividend in 2020 of €1.2 per share

05
                                         (1) As of September 30, 2020, net of treasury shares
                                         (2) As of January 8, 2021, share price of Euro 29 per share, market cap net of treasury shares, ordinary dividend 2019 of €0.6 per share
Our History
                                                                                                                                                   in January acquisition of a
                                                                                                       Sale of Italcementi                         20% stake in Officina Profumo
                                                                                                       for a mix of cash                           Farmaceutica di Santa Maria
                                                                                                       and assets                                  Novella, increased to 80% in
                                                                                                       incl. Italgen,                              September
                                                                                                       BravoSolution and
                                                                                                                               Purchase of 60%     Distributed €76m of ordinary
                                                                                                       HeidelbergCement
                                                                                                                               in Caffè            and extraordinary dividend
                                                                                                       shares
                                                                                                                               Borbone and of
                                                                                                                               40% in Iseo         In December acquisition of
                                                                                                                                                   93% of Casa della Salute and
                                                                                                                                                   60% of Callmewine
                   Asset                     Focus on Italcementi
                                                                                   Portfolio
                   diversification:          and sale of financial
                                                                                   diversification                                                 In January 2021 sale of certain
                   RAS, IBI, Falck,          participations (RAS, IBI)
                                                                                                                                                   assets of Sirap to Faerch Group
                   Bastogi, etc.

     1946        1962-78              1979           1984                1992       1993-05           2016         2017          2018            2019        2020

                                                                                                                                         Acquisition of a 30% stake
Italcementi, founded                                                                                                                     in Autogas Nord
                             In 1979 Italmobiliare                                            Conversion of
in 1864, carves out          acquires the control          Italcementi acquires                                                          Cancellation of 90% of
                                                                                              Italmobiliare
into newly created           of Italcementi and in         Ciments Français                                                              treasury shares
                                                                                              saving shares      Share buy back for
Italmobiliare the            1980 is listed on the         becoming a world
                                                                                                                 €100m
non-building                                               leading player in the                                                         Sale of stake in Jaggaer
                             Milan Stock                                                      Acquisition of
materials related            Exchange                      cement industry
                                                                                              Clessidra SGR      Purchase of stake       Tecnica acquisition of Riko
assets                                                                                                           in Tecnica Group        Sport and Lowa's
                                                                                                                                         minorities
                                                                                                                 Sale of BravoSolution
                                                                                                                 and acquisition of a    Listing on STAR segment
                                                                                                                 stake in Jaggaer        of Borsa Italiana

06
                                                                                                                                         Acquisition of 80% in
                                                                                                                                         Capitelli
Investment Portfolio
         Deployment of a new portfolio of strategic participations after the disposal
         of Italcementi in 2016                                                                                                                                           07
      Italmobiliare manages a diversified investment portfolio with a NAV of over Euro 1.7 bn(1)

     NAV                                                                       INVESTMENTS
     Euro 1.66 bn(1)                                                                Listed companies
                                                                                   and other financial                  Portfolio companies              Private Equity Funds
                                                                                        investments
             Other investments
                     45
                                         Real Estate and related                                                                                                         2016
 Financial assets,   3%
                                                 activitiesInvestments in listed
trading and cash                                    50                                                                          2017             2018    Portfolio companies
                                                               companies
       389                                          3%             90
       24%
                                                                   5%
                                                                                                                                              2019
                                                                                                                          2020
 Private equity                                                                                                                                                          CRF
      134
       8%                                                                                                                                     2019                      Fund II 2016
                                                                                                                                                                        Fund III 2019
                                                                                                                           2018
                                                                                                                                               2020(2)                  2018
                                                  Portfolio
                                                 companies                                                                                                              Fund IV 2019
                                                    949                                                                                2016                             Fund V 2020
                                                    57%
                                                                                                                                                                        2019
                                                                                                                                               2016
                                                                                                                                                                        2019
                                                                                                                         1990
                                                                                                                                               2020(2)
                                                                                                                                                                        2020
          (1) As of September 30, 2020
                                                                                                                         Italmobiliare core
                                                                                                                              business
                                                                              (2) Not included in NAV as of Sept 2020
Net Asset Value development
 Transition towards target capital allocation in progress

€1,421m                                               €1,741 m                                           €1,656 m                                                     TARGET
December 31, 2018                                     December 31, 2019                                  September 30, 2020

                                                                       Real                                                 Real
                                                                     Estate &                                             Estate &                                    Financial investments,
                  Real Estate &                                                                                     Other Other
            Other    Other                                   Other    Other   Listed                                                     Listed                          trading & liquidity
                                                          investments 3% Participations                          investments 3%
         investments 4%             Listed                    3%                                                                     Participations                            >10%
             5%                                                                                        Financial     3%
                                Participations                                  9%                                                         5%                              Private Equity
                                     23%                                                             investments,                                                              >10%
                                                                                                       trading &
  Financial                                                                                             liquidity                                                          Other assets
investments,                                       Financial                                               24%                                                                50%
    Private Equity                                                                                                                           Companies
                                   Companies
          9%                                                                                                                                    57%
                                      35%                 Private Equity
                                                                9%

                                                                                                                                                                 Decrease for disposal
                                                                                                                                                                 and mark-to-market of
                                        (€ m)                                                (€ m)                                                     (€ m)      stake in Heidelberg
Listed participations                    326         Listed participations                     165        Listed participations                          90    Increase for investment in
Portfolio companies                      497         Portfolio companies                       745        Portfolio companies                           949       Santa Maria Novella
                                                                                                                                                                  and overall portfolio
Private Equity                           129         Private Equity                            158        Private Equity                                134       revaluation
Financial investments, trading &         345         Financial investments, trading &                     Financial investments, trading &
                                                                                               570                                                      389     Decrease for investment
liquidity                                            liquidity                                            liquidity
Other investments                         73                                                                                                                     in Santa Maria Novella
                                                     Other investments                          54        Other investments                              45
                                                                                                                                                                and dividend distribution
Real estate & other                       51         Real estate & other                        49        Real estate & other                            50

                                                                                                                                                                              08
NAV                                     1,421        NAV                                    1,741        NAV                                           1,656
NAV per Share                           33.9€        NAV per Share                          41.5€        NAV per Share                                 39.2€
NAV Discount                          46,3%          NAV Discount                           41,8%        NAV Discount                                 24.8%

 Note: NAV net of treasury shares, discount calculated as of NAV's date
NAV development in the first nine months of 2020

                                               Increase for investment in
        Effect of disposals and price             Santa Maria Novella                               Decrease for
         performance of remaining                 (€160m) and overall                             divestments and         Mainly mark-to-market of
             Heidelberg shares                    portfolio revaluation                               capital           Fin.Priv. (Mediobanca stake)
                                                                                                    distributions           and other listed assets
                                                                                                                        partially offset by investment
                                                                                                                            in Cold Chain Capital

                                                            204                   (180)

                                       (76)
                                                                                                        (24)               (9)

                                                                              Investment in Santa Maria
                                                                              Novella (€160m), dividend
                                                                               distribution (€76m) net of
              1.741                                                             disposal of listed assets
                                                                                                                                               1.656

       NAV @31/12/2019 Investments in listed Portfolio companies             Financial assets,     Private equity   Other investments   NAV @30/09/2020
                           companies                                        trading and cash

Note: data in €M; NAV net of treasury shares

                                                                                                                                                         09
9M 2020 results and key highlights
                                                                                                                    10
                ▪ NAV of Euro 1,656 m as of September 30, 2020 with a decrease of Euro 85 m from December 31, 2019 (Euro
                  1,741 m) mainly effect of negative performance of financial markets following the global outbreak of Covid
   NAV            19 which impacted the value of Heidelberg shares and dividend distribution (Euro 76m), partially
 dynamics         compensated by the increase of overall value of portfolio companies (Euro +42 m effect of an increase of
                  Caffè Borbone value and a decrease of Tecnica Group value)

                ▪ Portfolio Companies results in the first nine months of 2020:
                  • Overall EBITDA improvement YoY (+16% on the basis of the pro forma aggregated performances of the
                     single companies)
Performance       • Positive results of Caffè Borbone (revenues +23% YoY, EBITDA +37% YoY), Capitelli (revenues +4% YoY, stable
 of Portfolio        EBITDA YoY) and Sirap (EBITDA +48% YoY)
 Companies        • Covid 19 impacted mainly Tecnica Group (revenues -10% YoY, EBITDA +17% YoY), Santa Maria Novella
                     (revenues -22% YoY), and Iseo (revenues -14% YoY) but with improving results vs 1H2020
                  • Other portfolio companies Italgen and Autogas reported a decreasing revenues but good EBITDA
                     performances in the period
                ▪ In January 2020 invested Euro 40 m for a 20% stake in Santa Maria Novella
Investments     ▪ In September acquired an additional 60% interest in Santa Maria Novella with an investment of Euro 120 m
and cash-ins      increasing ITM stake in the company from 20% to 80%
                ▪ Net cash in of Euro 22 m from Private Equity funds during the period

 Dividend       ▪ In May 2020 distributed of an ordinary DPS of 0.60 Euro (0.55 Euro in 2018)
distribution      and an extraordinary DPS of 1.2 Euro, for a total of Euro 76 m
                ▪ In December 2020 two investments in i) a 93% stake in Casa della Salute, which operates a network of
                  outpatient healthcare clinics, for Euro 24 million and ii) a 60% stake in Callmewine active in e-commerce of
 Subseque         wine and spirits for Euro 13 million.
 nt events      ▪ On January 4th 2021 sold certain asset of Sirap group in Italy, Spain and Poland to packaging group Faerch for
                  an EV of Euro 162 m (approx. 10,5x EBITDA). The transaction prudentially is expected to have a neutral impact
                  on NAV value
Italmobiliare shareholding structure
▪ Major shareholder is Efiparind B.V., 100% owned by the Pesenti family
▪ Italmobiliare Board of Directors composed by 12 members, majority of independent directors, in office until the
approval of 2022 results
S H A R E H O L D I N G S T R U C T U R E (1) BOARD OF DIRECTORS
Of which shareholders with >1% stake:
• BCP (5.0%)(2)
L. Zanetti
• Norges Bank (2.3%) E. Fornero
(Chairperson) Independent
• Antonio Fenaroli (2.0%)
Director
• Inarcassa (1.4%)
L. Strazzera according to
S. Mazzoleni
(Deputy Chair) TUF
Free float C. Pesenti
L. Minoli
32,0% (CEO)
Indipendent
Director
V. Bertazzoni C. Palmieri according to TUF
and
Code of Conduct
Efiparind G. Bonomi M. Soldi
Treasury shares
49,3%
0,7%
M. Cartia d’Asero A. Salerno Non-executive
Mediobanca Director
6,8%
Serfis
TUF: Italian law on finance
11,2%
11
(1) As of April 2020
(2) of which 0.853% of voting rights attached to shares and 4.148% of long positions with physical settlement and settlement in cashChairperson and CEO profiles
Graduated with honours from Bocconi Degree in Mechanical Engineering from Milan
University, where she is Associate Professor with Polytechnic, Master in Economics and
tenure of Corporate Finance, as well as Management from Bocconi University.
Research Fellow of the Baffi-Carefin Research
Along with the positions held in the Italmobiliare
Centre and Academic Director of the
Group (including CEO of Italcementi from 2004
Bachelor Degree in Economics and Finance.
until 2016, when the Italcementi investment was
Previously, she was Director of the Master of sold), he has also been a member of the
Science in Finance at Bocconi University, Boards of Directors of leading companies for
LAURA ZANETTI Visiting Scholar at both the MIT (Massachusetts CARLO PESENTI several terms of office.
Chairperson CEO
Institute of Technology) and the LSE (London
He is currently Chairman of Clessidra SGR and
School of Economics and Political Science).
of the Pesenti Foundation, and a member of
She is a Certified Public Accountant, the Board of Directors of Tecnica Group, Caffè
Registered Auditor, Director and Statutory Borbone and Officina Profumo Farmaceutica
Auditor of di Santa Maria Novella. He is also a Director of
various leading companies, and a member of Fondazione San Patrignano.
the Board of Assonime. Permanent member of the General Board of
She is the author of many articles on Confindustria, of which he was Vice President
corporate governance, corporate finance (2014-2016). Member of the Advisory Board of
Assolombarda.
12
and company valuations.
He is a member of the Board of ISPI and Co-
Chairman of the Italy-Thailand Business Forum.Environmental, social and governance 13
Governance Sustainability Report
VALUES AND PRINCIPLES The guiding criteria underlying Italmobiliare's
The investment activity of Italmobiliare aims to investment policies establish basic guidelines in terms
increase, according to criteria of sustainability and of responsibility and sustainability to guarantee all
transparency, the value of its portfolio in the medium- the stakeholders.
long term. For this reason, in addition to the financial reporting
The participation of Italmobiliare in the portfolio requirements, since 2017 Italmobiliare has published
companies is characterized by a proactive approach, the Sustainability Report ('Consolidated non-financial
that promotes the adoption of best governance Statement'), with details on policies and results
practices and the sharing of the basic principles of a achieved in
codified system of values and rules.
protection of the environment, personnel, the
reference community, and in the fight against
corruption according to the principles of the
Company's Code of Ethics.
The Code of Ethics aims to provide the Group with a
solid platform of values as a necessary condition to The Report represents a further step forward in the
guarantee constructive dialogue with all stakeholders, process of interaction with the enlarged community
and reaffirms the safeguard of ethical principles and of all the "stakeholders", and gives an overview of
legality as an essential asset for doing business. the Group's sustainable value creation process.
The Risk and Sustainability Committee, made up of
non-executive and mostly independent directors,
performs advisory and propositive functions in defining
the nature and level of risk deemed compatible with
the strategic objectives; it also assists the Board of
Directors in the field of Sustainability, defined as a set of
principles that underpin the creation of value for allthe
Company's stakeholders.Italmobiliare share price performance | Last 5 years
Last 5 years Italmobiliare share price performance vs reference index Total shareholders return last 5 years
200
Sofina 202%
Investor 142%
180 Italmobiliare:
+58%
March 2017
TIP 136%
160 Share buy-back
September 16, 2019 Lundbergs 110%
140 STAR segment
admission
Exor 91%
120
FTSE all-
shares: +15%
Italmobiliare 83%
100
FFP 69%
80
GBL 39%
60
Eurazeo 36%
40
March 2020
Alba 28%
BoD proposal for
March 2019 distribution of an
20 BoD proposal for extraordinary dividend CIR 26%
July 2016 the cancellation of90%
tender offer on of treasury shares
savings shares
0 Wendel 16%
08-gen-2016 08-gen-2017 08-gen-2018 08-gen-2019 08-gen-2020 08-gen-2021
Source: Thomson Reuters as of January 8, 2021; prices rebased to 100 Source: Thomson Reuters as of January 8, 2021
14Risk factors monitoring
Italmobiliare periodically performs an integrated analysis of the main risk factors and related
mitigation measures
▪ Portfolio risk analysis:
▪ main risk indicators (VaR, CVaR and recovery time) are lower than the average risk indicators of the global equity index
▪ well diversified portfolio with a balanced degree of correlation of the different components
▪ Italmobiliare and each of the portfolio companies periodically monitor and analyze specific risk factors and identify precise
actions for risk mitigation and hedging
▪ Risk factors analyzed: capital markets, regulatory, sustainability, country and currency exposure, commodities,
technological disruption, rates, economic cycle, cybersecurity, etc.
▪ Exposure to different country/area risks: the NAV distribution proportional to the geographic diversification of sales shows a
good level of diversification out of Italy (~50% of NAV linked to sales abroad). Out of the Italian NAV exposure approx. 65% is
related to businesses with a low correlation to GDP (Borbone, Autogas and Italgen)
NAV December 31, 2019(1)
NAV geographic breakdown
Real Estate & proportional to 2019 sales
Other
Other
investments
3% Listed
3%
Participations Extra EU
10% 20%
Italy
Financial
51%
investments, Portfolio
trading & Companies Rest of EU
liquidity 30% 45% 29%
Private Equity
9%
(1) Pro-forma for first 20% investment in Santa Maria Novella
15Portfolio Companies – 9M20 results and assessment
of Covid-19 impact
▪ During the first nine months of 2020, despite the impact of the Covid 19 emergency, the overall performance of the portfolio
16
companies was solid, with a growth in the aggregated EBITDA (+16% YoY) and improving from 1H20 results
▪ The financial and liquidity situation of the Portfolio Companies is closely monitored and does not shows any criticality
▪ Out of portfolio companies' total NAV value, 75% is composed by companies that reported solid results during the semester:
▪ Food sector Portfolio Companies Caffè Borbone and Capitelli reported growing revenues in the first nine months of 2020,
resilient results for Sirap with a strong growth in EBITDA thanks to cost savings and low raw materials' prices
▪ Energy sector companies Autogas Nord and Italgen decreasing revenues for contingent factors but good EBITDA results
▪ Lockdown of distribution channels had a negative impact mainly on Iseo, Tecnica Group and Santa Maria Novella, Tecnica
Group shows strong EBITDA growth thanks to integration of Riko and costs savings
9M20 YoY var. %
- Revenues +23% -11% -14% -15% -22% +4% -5%(1) -14%
- EBITDA +37% +17% -27% +8% -43% -2% +48% -5%
Negative Early closure of From March to Lower Strong growth Strong growth Lower
May impacted Lower unitary
impact on the winter season revenues due to trend in the start in the first two revenues on prices also due
office and in several key by closure of decrease of of 2020 halted months of 2020 certain product to lower
plants and main
vending markets and sales channels average selling by the closure followed by lines affected consumption for
markets offset closure of sales (locksmiths, DIY) price linked to of Italian stores slowdown in by changed lockdown
by strong channels in 1H20 Adopted cost oil price in March March-May consumers' compensated
Covid-19 impact containment by efficiencies
growth of EBITDA increase reduction and followed by due to behaviour on fixed costs
in 9M20 measures to
modern trade thanks to Riko's impact of other countries Ho.Re.Ca. during the
protect
and online acquisition and profitability lockdown on Started push on channel lockdown
channels costs savings Sales in June certain clients e-commerce closure Higher
Temporary Uncertainty on back to 2019 EBITDA increase sales EBITDA profitability for
plant closure in next season's level and in 3Q thanks to post impacted by lower raw
March orders led to sales up 3% YoY integration higher raw material prices
across all
strong cost geographies synergies and materials prices and cost savings
containment focus on initiatives
measures marginality
(1) Pro-forma excluding the effect of perimeter variationItalmobiliare: Overview
INDEX
Investment Portfolio
Focus on portfolio companies
Closing remarks
Appendix
17Portfolio companies
Portfolio
Companies
57%
Strategy: Ebitda growth, organic and M&A business expansion
Revenues
Financials 2019 (€m):
breakdown
Revenues (YoY % var.)
Sector Strategy and drivers by
EBITDA (% margin)
geography
Caffè Borbone (60%) ▪ Double digit organic growth in a growing 173 (+28%)
▪ Coffee
market
97% ITA
52 (30%)
Tecnica (40%) ▪ Support to organic growth, product/brand
▪ Sport 424 (+6%)
portfolio enhancement, group structure 93% Abroad
equipment 60 (14%)
optimization, margin improvement
ISEO (39%) ▪ Partnership with entrepreneurs to support
▪ Access control
and locking
organic and M&A growth 143 (+4%)
Acceleration in the digital and electronic 76% Abroad
solutions
▪ 19 (13%)
space
Gruppo Autogas ▪ Support entepreneur in the acquisition of
(30%) ▪ LPG gas B2C competitor Lampogas 488 (-7%)
100% ITA
New investments
distribution ▪ Resilient yield play, and upside potential 46 (9%)
through bolt-on M&A
Santa Maria Novella ▪ Perfumes and ▪ Accelerating international expansion of an 32(1)
(80%) cosmetics iconic brand 50% Abroad
12 (38%)
Casa della Salute ▪ Outpatient ▪ Accelerating network expansion through new 12 (>+100%)
openings
100% ITA
(93%)(2) healthcare clinics 1 (10%)
Capitelli (80%) ▪ Support organic growth 14 (+21%)
▪ Food (ham)
Market consolidation
100% ITA
▪ 4 (28%)
Callmewine (60%)(2) ▪ Wine e- ▪ Support organic growth and international 13 (+95%)(3)
100% ITA
commerce expansion
Sirap Group (100%) ▪ Food ▪ Historical participation of Italmobiliare 269 (-2%)
packaging Play an active role in market consolidation 67% Abroad
21 (8%)
Historical
▪
Italgen (100%) ▪ Hydro and ▪ Historical participation of Italmobiliare
34 (-5%)
18
renewable ▪ Resilient yield play, efficiency, market 100% ITA
energy consolidation 15 (42%)
(1) Consolidated management accounts including San Carlo S.r.l. Note: data refer to EBITDA adjusted for Tecnica, Sirap, Iseo, Autogas, and Italgen
(2) Not included in NAV at Sept.2020
(3) 2020 expected revenuesPrivate Equity & co-investments Private
Equity
8%
Strategy: global reach and one-stop shop for entrepreneurs willing to partner with Italmobiliare
Geographical Vintage Italmobiliare
Strategy
focus year commitment
Clessidra CCP 3 Italy 2015 ▪ PE leader in Italy € 92 m
▪ Focus on high-quality «Made in Italy»
▪ Latest investment Scrigno, pocket door counter frames
▪ Italmobiliare is anchor investor and owner of GP
Clessidra Credit Italy 2019 ▪ Focused on unlikely to pay bank credits € 12 m
Restructuring Fund ▪ Restructuring
BDT Fund II US 2016 ▪ Focus on family-owned businesses $ 50 m
▪ Advisory and long-term capital
▪ Investments between $200-800m
BDT Fund III US 2019 ▪ Time horizon 8-12 years $ 10 m
Isomer Capital I Europe 2015 ▪ Fund of Venture Capital funds € 8.5 m
▪ 10-15 VC funds in Europe
▪ Exposure to over 400 highly innovative early-stage
companies
ICONIQ Strategic Global 2018 ▪ Growth Capital fund $ 12 m
Partners IV ▪ Global scope
▪ Focus on enterprise software companies
ICONIQ Strategic Global 2020 $ 12 m
Partners V
Lindsay US 2020 ▪ Focus on mid-market industrials, consumer, healthcare and services $ 5m
Goldberg
Connect Ventures III Europe 2019 ▪ Early stage Venture Capital £ 1m
Lauxera Growth I Europe 2020 ▪ Growth medtech €2m
Cold Chain
Capital
Europe 2019 ▪ Focus on HVACR industry : Heating, Ventilation, Air
Conditioning, and Refrigeration
€ 5m
19Listed
Participations
Listed stakes: HeidelbergCement
5%
Strategy: dividend yield, opportunistic divestiture
Dividend yield(2)
% NAV(1) Sector Strategy
2020 2021E
▪ Participation of 0.9%
▪ Current value: € 90 m(1)
5% Building materials ▪ Dividend yield 1.26% 3.0%
▪ Progressive divestiture (overall
reduction of stake from 5.3% to 0.9%)
(1) As of September 30, 2020
(2) Source: Thomson Reuters, based on share price as of December 31, 2019
20Net Asset Value per Share development
21
NAV per share and NAV discount evolution
45 46,3% 50%
44,0% 44,3% 41,5
41,8% 38,8 38,6 39,2 39,2 45%
40 35,5 37,9 37,7
36,8 38,3% 38,5% 38,4%
40%
34,6% 35,2% 34,1 33,9 42,9%
33,7
35 35%
35,4
29,0 29,5 29,0 30%
30 24,9% 24,8%
25%
24,1 24,2 23,9 26,1%
25
21,2 21,0 20%
21,0 20,7 20,3 Current
23,0 18,2 discount(1) 15%
20
10%
15
5%
10 0%
NAV per share Share price NAV discount
(1) assumed NAV equal to NAV as of September 30, 2020
▪ NAV is calculated excluding the value of the treasury shares and according to the following methodologies for each of the main asset class:
▪ Listed participations: value at market price at each reference date
▪ Non-listed participations (portfolio companies): at financial year-end valuation by an independent expert based on market multiples or other
methodologies; valuation will be also updated on the basis of June interim report
▪ Private equity investments: valued at NAV of each fund updated every quarter22
Italmobiliare: Overview
INDEX
Investment Portfolio
Focus on portfolio companies
Closing remarks
AppendixCaffè Borbone (60%)
PROFILE
Caffè Borbone, headquartered in Caivano (Naples), is one of the main producers of single-serve coffee being the third player in
Italy after Lavazza and Nespresso in that segment, and the market leader for capsules compatible with Lavazza® and Nestlé
Nespresso® and Nescafé Dolce Gusto® systems*, thanks to the excellent price / quality ratio
Over the last years, Caffè Borbone has achieved an impressive growth supported by its focus on the fastest-growing segment of
coffee capsules and pods – an innovation that has changed consumer habits – which grew by around 9% in year 2019 in Italy
Caffè Borbone has gradually developed a strong brand awareness at a national level with further growth potential
in the North of Italy, in the modern trade channel, and abroad, where the company has still a limited presence
*All registered trademarks, product designations or brand names used in this document are not owned by Caffè Borbone nor by any company associated with it
PRODUCTS KEY FINANCIALS
Pods Capsules compatible with Lavazza and
(€ m) 2016 2017 2018 2019 9M20
Nestlé (Nespresso and Dolce Gusto)
systems
Revenues 71.9 93.6 135.2 172.6 155.8
YoY % var. +49.0% +30.2% +44.4% +27.6% +23.0%
EBITDA 16.2 20.3 33.7 52.0 52.4
% margin 22.5% 21.7% 24.9% 30.1% 33.6%
YoY % var. +76% +26% +64% +52% +37%
Coffee beans Moka coffee
Net income 10.5 13.7 16.5 34.2 Distributed
€20m
dividends
Capex 2.0 4.4 5.4 2.8
23
Net debt (cash) (15.3) (27.3) 51.2(1) 31.6 22.3
Note: FY 2016-2017 drawn up in accordance with Italian accounting
Distributed €8m
standards and from 2018 in accordance with IFRS
(1) Increase due to inclusion of acquisition financing dividends in 1H19Tecnica Group (40%)
PROFILE BRANDS AND PRODUCTS
Tecnica Group, is the main Italian group active in the sport
sector being the leading manufacturer of outdoor footwear
and ski equipment
The group has collected a portfolio of brands that includes
some of the industry’s historic names: Tecnica (ski boots and
footwear), Nordica (skis and boots), Moon Boot (footwear),
Lowa (trekking shoes), Blizzard (skis) and Rollerblade (inline
skates)
Tecnica is a multinational group that generates more than
90% of its sales abroad and its production plants are located
in Germany, Austria, Hungary, Slovakia and Ukraine
REVENUES BREAKDOWN KEY FINANCIALS
By geography By product type (€ m) 2016 2017 2018 2019 9M20
Italy Moon Other Revenues 341.2 368.0 398.5 424.0 260.2
7% Boot and 2%
skates YoY % var. +2.4% +7.9% +8.3% +6.4% -10.5%
RoW 10%
EBITDA 28.0 31.4 37.7 59.6 37.2
33%
Trekking % margin 8.2% 8.5% 9.5% 14.0% 14.3%
and
outdoor Net income(1) (0.8) 0.9 5.4 11.3
shoes
51% Capex 8.7 10.0 11.7 14.4
Ski
equipment
Europe Net debt (cash) 170.7 125.6 113.4 221.1 215.9
60% 37%
(1) Excluding minorities
24
EBITDA adjusted: €59.6m
Note: 2019 data Increase due to:
+ IFRS16 adoption €5.2m
- adoption of IFRS16 (€37m)
-Non recurring items €3.9m
- Riko-Lowa minorities
-Riko full year pro-forma adj€9.4m
acquisition (€86m)
EBITDA reported: €51.5mIseo Serrature (39%)
PROFILE PRODUCT PORTFOLIO
Iseo Group, headquartered in Pisogne (Brescia, Northern Electronic and digital
Mechanical products
Italy), is one of the main European producers of solutions
mechanical, mechatronic and digital solutions for access
control and security
Since 2010, the Group has developed digital solutions and
innovative security systems for access control thanks to Cylinders Locks Verrou
proprietary software and firmware, and opened a
dedicated research center
Iseo is the second player in the Italian market (13% market
share) and has developed a significant presence abroad –
also through acquisitions – in France, Germany, Spain and Panic Door Padlocks Home Building
devices closers
Middle East automation automation
REVENUES BREAKDOWN KEY FINANCIALS
By geography By product type (€ m) 2016 2017 2018 2019 9M20
RoW Electronic
France Revenues 139.7 143.5 137.7 142.7 89.7
17% 12%
26% YoY % var. +10.8% +2.7% -4.0% +4.3% -14.4%
EBITDA 17.2 17.9 14.3 18.7(1) 8.8
% margin 12.3% 12.4% 10.4% 13.1% 9.8%
Other EU
20% Net income 5.2 5.7 4.1 6.1
Distributed €1.2m
Italy
Capex 4.7 6.5 7.2 4.8 of dividends
Germany
13%
24% Mechanical Net debt (cash) 25.7 26.6 30.4 34.6 31.6
25
88%
Distributed €1.2m dividends in 1H19
Note: 2019 data (1) Adjusted for non recurring costs Impact of €7.8m for adoption of
of €3.4m IFRS16Gruppo Autogas (30%)
PROFILE TRANSACTION STRUCTURE
Autogas Nord Group (based in Genoa operates mainly in Italy AGN financed the acquisition of Lampogas partly through a
in the distribution of LPG gas for domestic use (small tanks, €60m capital increase subscribed by Italmobiliare and partly
meters, small networks), commercial, and industrial uses through bank financing.
In addition, the Group has gradually diversified its business,
exploiting a loyal customer base for cross selling other Autogas
products (electricity and natural gas) and services shareholders
(consultancy for efficiency)
In line with its strategy of market consolidation, and with the 70% 30%
support of Italmobiliare, AGN in November 2018 has acquired Autogas Nord
Lampogas Group, another leading Italian operator active in 100%
the sale of LPG, almost doubling its size and becoming the
second player in the Italian market Lampogas
The sector in Italy is stable and highly fragmented, with further
opportunities of consolidation
REVENUES BREAKDOWN KEY FINANCIALS
By service
(€ m) 2018 2019 9M20
Electric energy, Gruppo Autogas Nord 289 -10% net of LPG price
natural gas, energy effect
Lampogas 237
efficiency
18% Revenues 526.2 487.7 301.4
YoY % var. -7.3% -15.1%
EBITDA 35.7 45.9(1) 32.9
% margin 6.8% 9.4% 10.9%
LPG
Note: 2019 data distribution
Net income 7.8 4.8
Effect of post
Capex 15.5 20.3
26
82%
merger synergies
Net debt (cash) 137.2 127.2 114.7
(1) Adjusted for non recurring items
Distributed €4m of
dividends in 1H19Officina Profumo Farmaceutica
di Santa Maria Novella (80%)
PROFILE STORES AND PRODUCTS
Officina Profumo Farmaceutica di Santa Maria Novella Historical store in Florence DOS in Milan
produces and distributes premium perfumes and cosmetic
products under its own brand
The company is headquartered in Florence with roots in the
oldest pharmaceutical laboratory in Europe founded by
Dominican friars in 1612 with a tradition dating back in the Fragrances
Skin and Candles and Other
and products
14th century perfumes body care home fragrances
A historical tradition and strong heritage contributed to the
creation of an iconic and unique brand with a wide portfolio
of products distributed through a network of monobrand and
wholesale stores in Europe, USA and Asia
REVENUES BREAKDOWN KEY FINANCIALS
(€ m) 2018 2019 9M20
By geography By distribution channel
Revenues 30 32 16.4
3
E-Commerce YoY % var. 0% +6% -21.6%
0
APAC 6%
21% EMEA EBITDA 11 11 12 3.8
61% % margin 38% 37% 38% 23%
DOS
49% Net debt (cash) (19.2) (21.2)
USA
18%
27
Wholesale
45%
Note: 2019 data Note: 2018 and 2019 consolidated management accounts including San Carlo S.r.l.Casa della Salute (93%)
PROFILE GEOGRAPHICAL PRESENCE
Casa della Salute is an integrated operator of health centers,
• 8 centers located in Liguria
built around the concept that a wide array of high-quality
and Piedmont, specifically in:
private health services such as imaging diagnostics and
physiotherapy can be provided at accessible prices and with o Genova (3x)
short waiting lists o Manesseno (GE)
Company’ s growth is driven by a disruptive business model, o Busalla (GE)
based on advanced IT systems and state-of-the-art o Albenga (SV)
equipment, that allows high operational efficiency and prices
o Biella (BI)
close to national healthcare ticket
o Alessandria (AL)
The company doubled its size in 2019 by opening 5 new
centers that enabled the firm to consolidate its position in
Liguria and enter in Piedmont. Further new openings are
expected in 2021 and 2022 Additional costs and
reduction in traffic due to
REVENUES BREAKDOWN BY SERVICE KEY FINANCIALS Covid-19
Other Sales
5% (€ m) 2018 2019 6M20
Sport & Other
7% Centers n. 3 8 8
Revenues 5.7 12.2 6.7
Dentistry Outpatient
YoY % var. +114%
18% 36%
EBITDA 1.2 0.4
% margin 9.7% 6.3%
Laboratory
Net debt (cash) 6.1 7.3
5%
28
Imaging Diagnostic
29%
Five new centers
opened during 2019
Note: 2019 dataCapitelli (80%)
PROFILE
Capitelli, based in the province of Piacenza, is active in the production and sale of cooked ham and other cured
meat products characterized by the high quality and product excellence that are distributed under the brand
"Capitelli"
The company reinvented the cooked ham launching its flagship product "San Giovanni", made with selected meats
and with a unique craft production process, that has recently received a prestigious quality award from the
Espresso's “Guida Salumi d’Italia”
The main customers of the Company are modern trade retailers, and the growth experienced by Capitelli in last
years has been reinforced by consumer trends towards artisanal and high quality food products
PRODUCTS KEY FINANCIALS
Cooked ham "San Giovanni" Other cured meat products
(€ m) 2016 2017 2018 2019 9M20
Revenues 9.9 11.1 11.7 14.0 10.7
YoY % var. +7% +12% +6% +21% +4%
EBITDA 1.1 1.5 2.5 3.9 2.8
% margin 11% 13% 22% 28% 27%
Net income 0.7 0.8 1.7 3.1
Net debt
(4.2) (5.0) (7.2) (10.3) (12.3)
(cash)
29Callmewine (60%)
PROFILE
Callmewine.com is of the leading Italian e-commerce website for wine & other alcoholic products, it offers an extensive
catalogue of around 10,000 labels, ranging from famous, global wine brands to small, niche producers
The company, founded in 2010 by Paolo Zanetti (current CEO), has been able to leverage on the greater consumers' propensity
to buy products online thanks to the combination of digital competence and extensive knowledge of Italian excellence in the
wine sector
Callmewine has managed to reach a growing publicthanks to its wide selection of wines and to the ease of use & contents of the
website, that help and guide consumer’s choice
It is the only company in the Italian market that sustained important growth rates while maintaining a positive profitability. At the
end of 2020 it has launched the French and German versions of the website, first steps towards international expansion
PRODUCTS KEY FINANCIALS
Other
10%
+87% vs. 2017 (€ m) 2016 2017 2018 2019 2020F
Distillates Revenues 3.5 4.0 5.2 6.4 12.5
8% Red wines Var. % +38% 15% +29% +25% +95%
40%
Champagne
EBITDA 0.0 0.2 0.2 0.4
6%
9.641 SKU % margin 0.1% 6.1% 3.9% 5.9%
Sparkling wines Net income 0.0 0.2 0.1 0.3
8%
NFP (cash) 0.4 0.4 0.3 (0.1)
White wines
28%
30Sirap (100%)
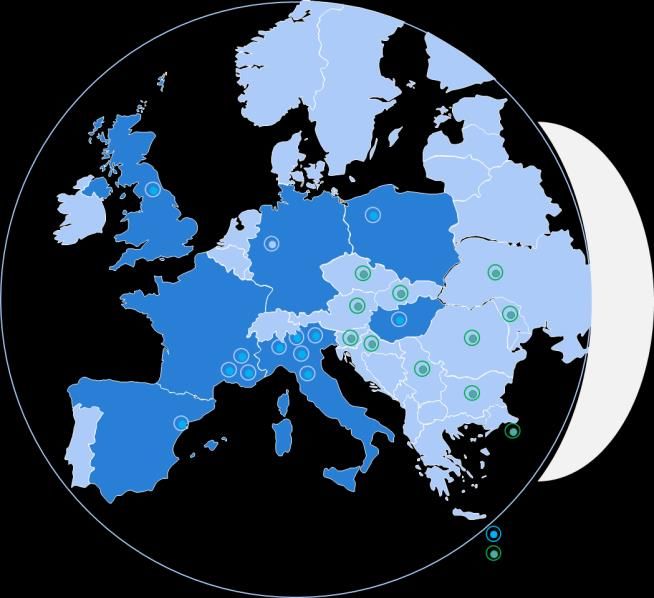
PROFILE GEOGRAPHICAL PRESENCE
Sirap is one of the main producers of fresh food
packaging in Europe, offering rigid containers in XPS
(polystyrene foam), PET and PP (polypropylene) for all
food applications for industry and retail clients
Sirap has an international presence with 12 production
plants, sales companies and warehouses in 17 European
countries
In 2020 Sirap has reached a strategic agreement with
the packaging group Faerch to sell its main assets in
Italy, Spain and Poland (details in the next page)
Production plants
Trading companies
Effect of closure
Note: pre disposal to Faerch
of subsidiaries, LfL
REVENUES BREAKDOWN BY COUNTRY KEY FINANCIALS var. -5%
(€ m) 2016 2017 2018 2019 9M20
Italy Revenues 207.3 207.1 275.1 269.3 183.4
33% YoY % var. -0.1% +32.8% -2.1% -9.7%
Europe
EBITDA 20.5 15.0 16.3 21.3(1) 18.9
48%
% margin 9.9% 7.2% 5.9% 7.9% 10.3%
Net income 6.2 2.3 6.3 1.0
France Capex 10.6 12.6 6.5 9.8
19%
Note: 2019 Net debt (cash) 65.5 67.2 82.3 80.8 72.4
31
Includes effect
Integration of companies acquired Includes effect of new of new IFRS16
at the beginning of 2018 IFRS16 for €+7.9 m for €+3.2 m
(1) Adjusted for non recurring costs (€1.4m)Sirap Group recent transaction
TRANSACTION OVERVIEW
• On January 4th 2021 Sirap has sold all its operational assets in Italy, Spain and Poland to Faerch Group, one of the top
European companies in the food packaging sector
• The enterprise value of the perimeter is approximately Euro 162 m, which corresponds to an EV/EBITDA LTM (June 2019-June
2020) multiple of approximately 10.5x
• Sirap Group will maintain control of its operations in France, Germany, United Kingdom and the Petruzalek Group with a pro-
forma turnover in 2019 of approximately Euro 140 million
• According to a conservative estimate the transaction will have a substantially neutral impact in terms of NAV valuation of
Sirap Group of approx. Euro 50 million as of 30 June 2020
Transaction perimeter
Perimeter of the transaction
Production presence
Sales companies
32Italgen (100%)
PROFILE GEOGRAPHICAL PRESENCE
Italgen is a producer and distributor of electricity from
renewable energy sources, it manages 15 hydropower
plants and over 300 km transmission lines in northern Italy
and has a significant stake in two wind farms in Bulgaria
(18 MW)
In the last decade Italgen has also developed
international renewable energy projects in Egypt,
Morocco and Turkey
Italgen is strongly committed to sustainability, it operates
in full compliance with the environment and has
obtained the most relevant certifications: ISO 9001,
14001 and EMAS (Eco Management Audit Scheme).
KPIs KEY FINANCIALS
(€ m) 2016 2017 2018 2019 9M20
▪ Installed capacity: 58 MW (100% hydro)
Revenues 49.0 37.8 36.0 34.4 21.6
▪ Renewable energy production: 306 GWh/year YoY % var. n.m. n.m. n.m. -4.8% -13.8%
▪ Availability rate: 96% EBITDA 7.0 6.2 8.4 14.6(1) 9.3
% margin 14.3% 16.4% 23.5% 42.4% 43.1%
▪ Equivalent households potentially supplied by
Italgen: 105,000 Net income 0.3 1.3 0.4 7.4
▪ Avoided CO2 emissions: 134,000 Tons/year Capex 6.4 2.5 3.4 3.3
Net debt (cash) 17.0 17.9 21.0 20.1 22.8
33
The trend of revenues from 2015 is due to the switch from final to wholesale
clients that reduced transport rebates with limited effect on margins
Distributed €6m
dividends in 9M20
(1) Adjusted for non recurring costs (€0.4m)Clessidra SGR (100%)
PROFILE
Profile
INVESTMENT STRATEGY
Clessidra SGR is the leading manager of Private Equity funds
exclusively dedicated to the Italian market through the
funds Clessidra Capital Partners, Clessidra Capital Partners II
and Clessidra Capital Partners 3, where Italmobiliare is the
anchor investor
Since inception in 2003, Clessidra completed 23 transactions
with an aggregated EV of € 18 bn and equity of € 1.8 bn
(equity average € 80 m per transaction) and 17 add-ons to
the portfolio companies
In 2019 Clessidra launched Clessidra Restructuring Fund, a
new fund focused on unlikely to pay bank credits,
Italmobiliare has underwritten a commitment to the fund
FUNDS UNDER MANAGEMENT KEY INDICATORS
Currently managed funds 3
9
Current flagship fund CCP 3
Assets Under Management
over time approx. € 3.0 bn
# of investments 23
4
34
5
# of add-on 1735
Italmobiliare: Overview
INDEX
Investment Portfolio
Focus on portfolio companies
Closing remarks
AppendixClosing remarks
A unique opportunity to invest in the leading investment holding in Italy 36
1 Largest listed investment holding focused on the Italian market by asset base
2 Great business network, thanks to over 150 years of activity on the business community
Attractive market fundamentals: Italian companies are underpenetrated by institutional investors and capital
3 markets
4 Long-term investor approach and focus on operational improvement as value creation mantra
Reputable brand within the Italian entrepreneurs community: full coverage of Italian entrepreneurship
5 spectrum with a one-stop shop approach is a deal sourcing competitive advantage
6 Significant cash flow generation of Italmobiliare asset base and growth potential
Proven and experienced management team, with long-term incentives scheme based on NAV and share
7 price performance
Dividend play Growth opportunities Innovative investment platform37
Italmobiliare: Overview
INDEX
Investment Portfolio
Focus on portfolio companies
Closing remarks
AppendixItalmobiliare group exit track record since 2011
38
Date Asset Transaction description
Sept-15 ▪ Sale of 100% of Finter Bank to Vontobel
▪ Italmobiliare proceeds: CHF 85 m (o/w CHF 10 m in Vontobel shares)
2015-2016 ▪ Sale to HeidelbergCement for a total EV: € 7 bn
▪ Italmobiliare proceeds: € 1,7 bn (o/w € 0,9 bn in cash and € 0,8 bn in
HeidelbergCement shares equal to a 5.3% stake)
Mar-17 ▪ Clessidra CCPIII exit
▪ Proceeds: € 245 m
Jul-17 ▪ Clessidra CCPII exit
▪ Proceeds: € 152 m
Aug-17 ▪ Clessidra CCPII exit
▪ Proceeds: € 102 m
Aug-17 ▪ Clessidra CCPII exit
▪ Proceeds: € 86 m
Oct-17 ▪ Clessidra CCPII exit
▪ Proceeds: € 170 m
Nov-17 ▪ Sale of Jaggaer (backed by Accel-KKR) for an EV of € 184 m
▪ Italmobiliare proceeds: € 120 m (o/w € 35 m in Jaggaer shares equal to a 9.5%
stake)
2017-2018 Italmobiliare non-core ▪ Disposal of non-core assets (e.g. real estate assets and stake in Banca Leonardo)
assets
Apr-19 ▪ Clessidra CCPIII exit
▪ IPO
Jul-19 ▪ Sale of ITM 9.5% stake in Jaggaer alongside Accel-KKR to Cinven
▪ Italmobiliare proceeds: $ 102 m
Jan-21 ▪ Sale of Sirap Group's operational assets in Italy, Spain and Poland to Faerch Group
▪ EV of Euro 162 m, EV/EBITDA LTM (June 2019-June 2020) multiple of approximately 10.5xValue creation from the investment in
BravoSolution-Jaggaer 39
▪ As part of the Italcementi transaction, in July 2016 ITM acquired a 75% stake from Italcementi in the e-procurement
solutions provider Bravo Solution
▪ In December 2017, ITM sold BravoSolution to Jaggaer, spend management solution provider backed by private
equity fund Accel-KKR, reinvesting part of the proceeds (~Euro 35 m) in a 9.5% stake in Jaggaer
▪ In August 2019, following the sale of Jaggaer alongside Accel-KKR to Cinven, which values ITM stake USD 102 m(1), ITM
realizes a significant return from its investment in Bravo Solution-Jaggaer
IRR ITM
ITM investment timeline
2016-2019:
+48% (MoM 2,4x)
Majority stake Sale of BravoSolution to Sale of Jaggaer to
purchase from Jaggaer with partial Cinven(1)
Italcementi reinvestment
ITM stake %
83% 9.5%
Net proceeds from Bravo
Solution: €114m
91
Financial NAV value (mar-19): €57m
flows Historical cost (dec-17): €35m
(€ m)
(70) 79 Transaction closed on
August 14th 2019
Jul-16 Dec-17 Aug-19
(1) before taxesPortfolio strategy: Italmobiliare positioning
Minority/ Majority/
Listed Listed
Listed
Listed/
unlisted
stakes ratio
(weighted
for NAV)
50/50
Unlisted Minority/ Majority/
Unlisted Unlisted
Non-Controlling 50/50 Controlling
Majority or controlling stakes:
>50% for unlisted
>25% for listed
4041
Italmobiliare investment team activities
Overview of Investment Opportunities
Summary of the activities of the last 30 months Current pipeline and investment opportunities
▪ Investments in complementary and
Dossier screened: >260 diversified sectors with respect to
the current portfolio and
INVESTMENT characterised by stability and low
Dossier analyzed: ~40 cyclicality
STRATEGY
▪ Research of targets with high
technological content, strong brands
Non binding offers:18 or leadership positions
▪ Potentially even larger investment
targets
Due Diligence: 11
▪ Add-on investments for portfolio
companies
Closed transactions: 8
Several investment opportunities are
being studied in different sectors,
CURRENT including:
PIPELINE ▪ Industrial non cyclical
▪ Different opportunities are still on-going and in ▪ Domotics/high tech
different state of progress ▪ FoodConsolidated Balance Sheet
31 31 December 31 December
(€m) 30 June 2018 30 June 2019 30 June 2020 30 September
December 2018 2019 2020
2017
Non-current assets 995 1,214 1,206 1,243 1,099 1,059
Current-assets 682 593 555 666 805 703
Discontinued
6 6 6 6 7 7
operations
Total assets 1,682 1,813 1,767 1,915 1,911 1,769
Shareholders equity 1,374 1,361 1,302 1,414 1,474 1,348 1,386
• Group 1,373 1,266 1,203 1,312 1,359 1,225 1,255
• Minorities 0 95 100 102 116 123
Non-current
153 217 266 292 259 251
liabilities
Current liabilities 156 235 198 209 177 169
Liabilities related to
discontinued - 0 0 0 1 1
operations
Total liabilities 1,682 1,813 1,767 1,915 1,911 1,769
Net
495 233 222 288 475 384 326
financial
position
42You can also read