General Investor Presentation - September 2017 - Tecnoglass Inc.
←
→
Page content transcription
If your browser does not render page correctly, please read the page content below

General Investor Presentation
September 2017

Disclaimer

Disclaimer
This presentation (including any information which has been or may be supplied in writing or orally in connection herewith or in connection with any further inquiries, this “Presentation”) contains
information regarding Tecnoglass Inc. and its subsidiaries, as applicable, where it holds a direct or indirect interest (together “Tecnoglass” or the “Company”) that is confidential and proprietary to
the Company. We have prepared this document solely for informational purposes. You should not definitively rely upon it or use it to form the definitive basis for any decision, contract,
commitment or action whatsoever, with respect to any proposed transaction or otherwise. By participating in this Presentation, each participant agrees to the terms hereof, as follows: Each
participant will and will cause its directors, officers, employees, affiliates, agents, advisors and representatives to use the information contained in this Presentation only to evaluate the proposed
transaction in respect of the Company and may not communicate, reproduce, distribute or disclose it to any other person, or refer to it publicly, in whole or in part at any time except with our prior
written consent. If you are not the intended recipient of this document, please delete and destroy all copies immediately.
Neither the Company nor any of its representatives makes any representation or warranty, express or implied, as to the accuracy or completeness of the information contained in this Presentation,
and nothing contained herein is, or shall be relied upon as, a promise or representation, whether as to the past or the future. Only those representations and warranties that are made in a
definitive written agreement relating to a transaction in respect of the Company, when and if executed, and subject to any limitations and restrictions as may be specified in such definitive
agreement, shall have any legal effect.
This Presentation does not purport to contain all of the information that may be required to evaluate a potential transaction in respect of the Company, and any person participating in this
Presentation should conduct its own independent investigation and analysis.

Forward Looking Statements
This presentation includes certain forward-looking statements within the meaning of the Private Securities Litigation Reform Act of 1995. including statements regarding future financial
performance. future growth and future acquisitions. These statements are based on Tecnoglass’ current expectations or beliefs and are subject to uncertainty and changes in circumstances. Actual
results may vary materially from those expressed or implied by the statements herein due to changes in economic. business. competitive and/or regulatory factors. and other risks and
uncertainties affecting the operation of Tecnoglass’ business. These risks. uncertainties and contingencies are indicated from time to time in Tecnoglass’ filings with the Securities and Exchange
Commission. The information set forth herein should be read in light of such risks. Further. investors should keep in mind that Tecnoglass’ financial results in any particular period may not be
indicative of future results. Tecnoglass is under no obligation to. and expressly disclaims any obligation to. update or alter its forward-looking statements. whether as a result of new information.
future events. changes in assumptions or otherwise.

Financial Presentation
Certain of the financial information contained herein is unaudited and does not conform to SEC Regulation S-X. Furthermore. it includes EBITDA (earnings before interest. taxes depreciation and
amortization) which is a non-GAAP financial measure as defined by Regulation G promulgated by the SEC under the Securities Act of 1933. as amended. Accordingly, such information may be
materially different when presented in Tecnoglass’ filings with the Securities and Exchange Commission. Tecnoglass believes that the presentation of this non-GAAP financial measure provides
information that is useful to investors as it indicates more clearly the ability of Tecnoglass to meet capital expenditures and working capital requirements and otherwise meet its obligations as they
become due. EBITDA was derived by taking earnings before interest. taxes. depreciation and amortization as adjusted for certain one-time non-recurring items and exclusions.

No offer or solicitation
This announcement is not intended to and does not constitute an offer to sell or the solicitation of an offer to subscribe for or buy or an invitation to purchase or subscribe for any securities or the
solicitation of any vote or approval in any jurisdiction. nor shall there be any sale. issuance or transfer of securities in any jurisdiction in contravention of applicable law. No offer of securities shall
be made except by means of a prospectus meeting the requirements of Section 10 of the Securities Act of 1933. as amended.

                                                                                                                                                                                                            2
Tecnoglass at a Glance
Overview
Company Description Sales Geographic Mix
• Tecnoglass Inc. (NASDAQ: TGLS, “Tecnoglass” or the “Company”) is a leading 2012 LTM 2Q’17
manufacturer of hi-spec architectural glass and windows for the commercial
Others Panama
and residential construction markets Panama 3% Others
2%
• Tecnoglass was founded in 1984
11%
3%
Colombia
o Leadership position in both the U.S. and Colombia
38% 27%
o Continuous commitment to product innovation and quality
• Vertically‐integrated, state of‐the‐art manufacturing complex
U.S. 68% U.S.
o Strategic, cost‐effective location in Barranquilla, Colombia 48%
o Efficient access to Americas, Caribbean and Pacific markets
Colombia
o Established a leading presence through consistent organic growth
• Strong balance sheet and financial flexibility reinforces commitment to long-
Recent company development continued growth strategy into the U.S market
term dividend program at annualized rate of $0.56 per share
Focus on Product Innovation Key Financial Metrics (US$mm)
30+ year track record of innovation and product development has made CAGR ‘12 – LTM 2Q‘17: 21.1%
305.0 308.1
Tecnoglass a company in the vanguard of the industry 242.2
183.3 197.5
Tecnoglass’ broad portfolio of high-end products includes: 130.3
Revenue
2012 2013 2014 2015 2016 LTM 2Q'17
Selected Products
Soft Coated Glass Insulated Glass
CAGR ‘12 – LTM 1Q’17: 27.9% Margin
Laminated / Tempered Glass Aluminum Profiles
16.6% 20.3% 18.9% 23.6% 23.6% 21.2%
Curved and Digital Print Glass Curtain Wall Systems Adjusted 72.0 65.3
57.1
EBITDA(1) 37.3 37.2
21.6
Recent capital investments have been deployed to develop state-of-the-art
manufacturing plants with cutting-edge technology 2012 2013 2014 2015 2016 LTM 2Q'17
Source: Tecnoglass.
Note: 2015 and 2016 financial Information has been retroactively adjusted to reflect the acquisition under common control of ES Windows. 2017 financial statements include four months of GM&P’s operations after 3
being acquired in March 1, 2017.
1. Estimated as Net Income plus income tax provision, interest expense, gain/loss on change in fair value of warrants and earnouts, exchange gain/loss, one timers and D&A.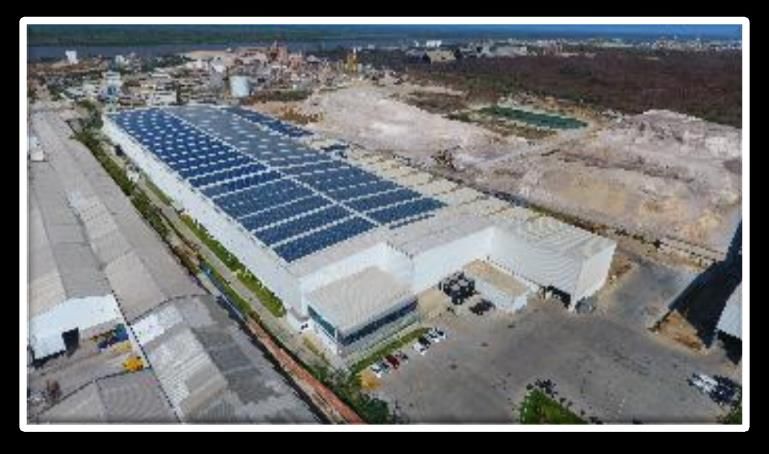
Tecnoglass at a Glance
Supplying Architectural Glass Products to Landmark Properties in the U.S and Latin America
South Miami Dade W Hotel
50 United Nations Plaza Via 57 West Cultural Arts Center Ft. Lauderdale, FL
New York, NY New York, NY Miami, FL
Fordham University Parcel N UB Law
New York, NY Washington, DC Baltimore, MD
Waterway Square Wyly Theather 50 Causeway Street LaSalle School of Business
Houston, TX Dallas, TX Boston, MA Philadelphia, PA
Bahia Centro El Dorado Airport OPM Torre Global Hotel Marriott Centro Criollo de Ciencia Santo Domingo Airport
Santa Marta, Colombia Bogotá, Colombia Buenos Aires, Argentina Ciudad de Panamá, Panamá Aruba, Aruba y Tecnología del Caribe Santo Domingo,
San Juan, Puerto Rico Dominican Republic
Brickell City Centre Grove at Grand Bay Ernst & Young 2929 Weslayan Astoria Cámara Colombiana de Ambar Oceanic
Miami, Florida Miami, Florida Cleveland, Ohio Houston, Texas Houston, Texas Infraestructura Santa Marta, Colombia
Medellín, Colombia
4
Source: Tecnoglass. Tecnoglass’ products are in use in projects in more than 20 countries
Attractive US Market Opportunity
Effectively Positioned to Further Penetrate the US market
Key Growth Drivers Tecnoglass US Footprint(4)
• Apartment and condominium construction industry reached
$38 billion in 2016, growing 10.9% p.a. since 2011
Apartment
• Growth is expected to continue supported by increased
investment in residential construction, aggressive lending into
Condo the multifamily sector, and improved employment conditions
Construction
• Continued migration of the US population towards
metropolitan areas and an increasing number of young
professionals should also boost growth
• Commercial building construction industry reached $196 billion
in 2016, growing 10.7% p.a. since 2011
Commercial
Building
• Industry should continue growing driven by higher corporate
profits, decreasing office vacancy rates , low interest rate
Construction environment, and an increase in backlogs for commercial Tecnoglass’ Main Regions Tecnoglass Present
(81% of US revenues) (19% of US revenues)
constructors
US Construction Glass & Aluminum Market (1,2,3) Glass & Glazing Contractors US Industry Ranking (5,6)
• Tecnoglass market share in the
• Key Recent Accomplishments in US market according to Glass Magazine
US (Top 10) represents immense
Tecnoglass Addressable Market
opportunities for further
26% Tecnoglass S.A. GMP LLC.
30% penetration, given cost
advantages and a very #2 Top Glass & Metal #7 Top Glaziers US
2017 Fabricators US 2017
fragmented market
2017
US$25.3 Bn
Building and Construction
Glass
Sheet Metal for Window & Tecnoglass S.A. Tecnoglass S.A. Tecnoglass S.A.
44% Door #2 Top Glass & Metal #2 Top Glass & Metal #2 Top Glass
Glass & Glazing Contractors, Fabricators US Fabricators US Fabricators US
net of raw material costs 2016 2015 2014
Source: IBIS, Tecnoglass.
1.IBIS World. IBISWorld Industry Report 32721. Glass Product Manufacturing in the US, May 2017.
2.IBIS World. IBISWorld Industry Report 33232. Sheet Metal, Window & Door Manufacturing in the US, May 2017.
3.IBIS World. IBISWorld Industry Report 23815. Glass & Glazing Contractors in the US, June 2017.
4. Includes GMP and Componenti. 5
5.Glass Magazine. The Top Glass and Fabricators, February 2017.https://glassmagazine.com/article/commercial/2017-top-glass-fabricators-list-1716207
6.Glass Magazine. Top 50 Glaziers: 2017 Annual Report-The List, June 2017. https://glassmagazine.com/article/commercial/top-50-glaziers-2017-annual-report-list-1716576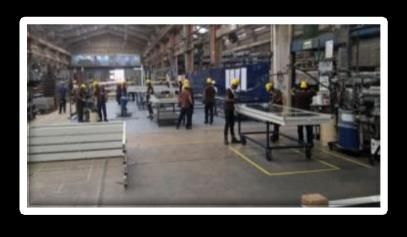
Investment Highlights
  Leading Architectural Glass and Windows Company in Latin America and the U.S.

      Ample Room for Growth Supported by
              Favorable Industry Backdrop      1
Proven Track Record of Strong and Profitable
 Growth Supported by a Robust Backlog and
                     Strategic M&A Activity    2         4       Vertically-Integrated Business Model
                                                                 Drives Operating Efficiencies

                                                         5
                                                                 Built-to-Suit Innovative Products
                                                                 Pacing Ahead of Evolving Industry
Unique Geographic Location Provides Ample
                    Significant Advantages     3                 Trends

                                                         6       Skilled Workforce Supported by
                                                                 Strong Leadership and Corporate
                                                                 Governance Framework

                                                                                                     6
1 Ample Room for Growth Given Supportive Industry Backdrop
1 Commercial construction is Architectural Billing Index(1) Construction Put in Place in the U.S.(2)
expected to grow at strong levels US$bn
reflecting the improvement in the
60
U.S. economy, mostly driven by Score > 50 indicates
1,106
improved construction 1,035 1,067
dining sub-segments 56 997
57 outlook 942
U.S. Market
885
52 54
52
52 52
52 51 52 523 543 565
Additionally, residential and non- 48 49
50
470 500
48 445
residential segments are expected 44
to grow by 5% and 7% respectively 40 42
41
in 2017 472 497 512 523 541
440
ABI Index LTM
― The residential multifamily 2015 2016 2017E 2018E 2019E 2020E
construction is expected to ABI points to continuous improvement in commercial construction
Residential Non Residential
increase by 7% in 2017
― Lodging, Office and Commercial Construction Put in Place in Mid
Tecnoglass' Main Regions
and South Atlantic U.S.(2)
sub-segments are expected to
Mid and South Atlantic(1)
US$bn
drive non-residential construction
Mid Atlantic South Atlantic
with 9%, 8% and 6% expected
growth in 2017 respectively 344
Delaware 321 331
302 312
West Virginia Maryland 292
Virginia
2 Total construction put in place in
North Carolina 174 182 189
the South and Mid Atlantic(1) New York 147 156 167
South Carolina
regions are expected to grow at 3%
in 2017, with a 7% growth for non- Georgia
residential buildings and a stable Pennsylvania 145 146 145 147 149 154
New Jersey
activity for the residential end Florida
markets 2015 2016 2017E 2018E 2019E 2020E
Residential Non Residential
Source: FMI, AIA
1. The American Institute of Architects (AIA) reported the Architecture Billing Index (ABI-July-2017). 50 represents the diffusion center. A score of 50 equals no change to outlook from the previous 7
month. Above 50 shows increase; Below 50 shows decrease. http://www.aia.org/press/releases/
2. Mid Atlantic region is composed of New York, Pennsylvania and New Jersey. South Atlantic is composed of West Virginia, Virginia, Delaware, Maryland, North and South Carolina, Georgia and Florida.
3. Measure of value of construction installed or erected at the site during a given period.1 Ample Room for Growth Given Supportive Industry Backdrop (Cont’d)
Colombian Current GDP´s Performance By Industry (1) Macro Indicators Paving The Way For 2H Ramp-Up (3)
(US$ billion) (in %)
400 ,0 378 410
360
301
350 ,0
291 283 9,0% 5,75%
300 ,0
310
7,75% 7,50%
8,0%
260 7,00%
250 ,0
7,0% 6,50% 6,25%
210
342 155 6,0% 4,50% 5,50% 5,25%
200 ,0
136
273
160
4,50% 4,50% 4,56% 4,42% 4,69%
264 256 5,0%
4,00%
150 ,0
110
3,99% 3,87%
4,0% 3,40%
100 ,0
141 60
2,79%2,86%
123 3,0%
50,0
10
36 27 27 28 13 14 2,0%
- (4 0)
2Q´14 4Q´14 2Q´15 4Q´15 2Q´16 4Q´16 2Q´17 August´17
2.014 2.015 2.016 2017 2Q´16YTD 2Q´17YTD
Forecast Inflation Rate National Bank Interest Rate
Construction Other Total GDP
Colombian Economic Activity Has Slowed Down But Macro
Building Construction Licenses in Colombia (2)
Policy Leads The Way For Improvement
Area Approved by End Market (m² in ‘000 from January to June) Government recently updated its macroeconomic projections for expected
GDP growth of 2% in 2017 and 3% in 2018. (4)
31 3% GDP growth forecasted for the second half, with construction amongst
others, expected to lead the way.
25 25 26
Inflation rates are now within the Central Bank´s target (2-4%), signifying a
23 steep reduction from their recent peak of 8.6% as of 2Q 2016. Likewise, central
18 19 19 bank rates have dropped 225bps from their recent highs to 5.25% as of August.
12 11 Both indicators point to overall improvement in economic activity.
9 8 The construction sector backlog is set to grow low single digits in 2017 mainly
7 9 6 7
3 3 due to a recovery in residential activity, along with the support of government
subsidies and programs which are set to increase demand in the real estate
2.014 2.015 2.016 2017 2Q´16YTD 2Q´17YTD
Forecast market.
Housing Other Total
Local quotes and sales provide visibility for a ramp-up in activity for the next
18 months.
Source:
1. DANE. Real GDP by Economic Activity August 2017. Converted to USD using the FX average rate for each year.
2. DANE. Statistics of Building Construction Licenses – ELIC, June 2017. https://www.dane.gov.co/index.php/estadisticas-por-tema/construccion/licencias-de-construccion 8
3. Central Bank´s Policy Rate – Intervention Rate and Inflation and Target, August 2017. http://www.banrep.gov.co/
4. Minister of Finance. “Colombia General Budget” August 2017. http://www.minhacienda.gov.co/HomeMinhacienda/ShowProperty?nodeId=%2FOCS%2FP_MHCP_WCC-
059064%2F%2FidcPrimaryFile&revision=latestreleasedProven Track Record of Strong and Profitable Growth Supported
2 by a Robust Backlog and Strategic M&A
Backlog has Increased as a Result of Efforts to Expand Geographic Footprint and Enter New Niche Markets,
Such as High-Tech Curtain Walls
Backlog Performance and Growth Evolution(1)
Figures in US$mm
487 1
0,95
0,9
375 396 0,85
0,8
0,75
0,7
280 0,65
0,6
0,55
0,5
0,45
0,4
0,35
0,3
0,25
0,2
0,15
0,1
0,05
0
2014 2015 2016 2Q'17
Total Backlog
Breakdown by Geography Breakdown by End Market
2016 LTM 2Q’17 2016 LTM 2Q’17
2% 2%
5% 3%
22% 3% 2%
25% 20% 26%
52% 95%
51%
92%
USA (Florida) Colombia USA (Northeast / West / Other) Others Commercial Residential (Single Families / Developers) Retail (Dealers)
Source: Tecnoglass.
9
Note: Backlog is shown as of the end of each time period.
(1) Backlog as of 2016 does not assume GM&P contribution to expected revenues.Proven Track Record of Strong and Profitable Growth Supported
2 by a Robust Backlog and Strategic M&A Activity (Cont’d)
Selective Acquisitions Strengthen Tecnoglass’ Vertical Integration
ES Windows and
Acquisition of ES Windows LLC in Florida Allows for Continued Expansion of U.S. Customer Base
GM&P acquisitions
allow Tecnoglass to E.S. Windows, LLC. is a company incorporated in 2014 with the purpose of supporting
further strengthen its the importing and distribution of Tecnoglass’ products in the U.S
presence in the U.S.
and enhance vertical E.S. Windows currently serves Tecnoglass’ main distribution channels into Florida and
other U.S. markets, serving both the residential and commercial construction markets
integration
The purchase further consolidated and vertically integrated its business while providing additional synergies on
Tecnoglass has distribution costs
developed the ability
to continue to
successfully integrate GM&P Acquisition Fueling Additional Growth
acquired businesses
and realize anticipated GM&P Consulting and Glazing Contractors, Inc. excels at design and installation of
benefits of such building enclosure systems such as curtain and window walls
acquisitions
Headquartered in Miami and highly focused on Florida market, with growing
presence in Texas and the Southeast
GM&P has conducted business with Tecnoglass during the last five years and was
formerly the Company’s largest client
Acquisition enhances vertical integration, streamlines distribution logistics and
provides ability to complete some fabrication work internally in the U.S. when
economically advantageous, provides added operational diversification
10
Source: Tecnoglass.2
3 Unique Location Provides Significant Competitive Advantages
Manufacturing and Delivery Cost Efficiencies Provide a Significant Structural Competitive Advantage and
Result in High Barriers to Entry
Main Competitive Advantages Strategically Located Manufacturing Units
o1 Strategic location near three of The Barranquilla port is just 16 kilometers away from our production facilities and shipping to Miami’s main
Colombia’s four main ports: port is a three-day journey, six days to New York and 11 days to Los Angeles (through the Panama Canal)
Barranquilla, Cartagena and Santa
Marta
o Access to all major global markets
Berlin, Germany
o Low shipping rates
Barcelona, Spain
Boston, MA
Ohio New York, NY Napoli, Italy
o2 Diversified distribution Washington, DC Turkey
Las Vegas, NV
San Pedro - Los Angeles, CA
Morocco Israel
o Over 900 clients in North, Central Houston, TX Ft. Lauderdale, FL
Nassau, Bahamas
and South America Progreso, Mexico Rio Haina, Dominican Republic
San Juan, Puerto Rico
o Strong customer relationships Barranquilla - Colombia
Puerto Limon, Costa Rica Trinidad and Tobago
Manzanillo, Panama
o3 Vertically integrated business
model Ecuador Singapore
o Internally supplied glass and Callao, Peru Brazil
aluminum products Arica, Chile
Rio de Janeiro, Brazil
o Strategic raw material sources Santos, Brazil
Val Paraiso, Chile Argentina
2.7 million sq ft
o4 Low manufacturing costs state-of-the-art
manufacturing unit in
o Access to qualified, low-cost labor Barranquilla, Colombia
supported by other
manufacturing and shipping
(NY008J6H)
(NY008J6H) 852890_1.wor
(NY008J6H)
(NY008J6H)
(NY008J6H) 852890_1.wor
852890_1.wor
852890_1.wor
852890_1.wor
efficiencies provide significant
structural competitive advantages
● The Colombian net import trade imbalance provides favorable shipping rates for exports
11
Source: Tecnoglass.4 Vertically-Integrated Business Model Drives Operating Efficiencies
Integrated Production Process…
● Tecnoglass’ top quality products enable the
Operator Product / Service Target Market
company to achieve leading market positions in
the US and Latin America
Commercial and residential
o Family of window systems offers buildings including hotels,
shopping centers, airports,
tailored solutions for specific markets, universities and hospitals
Glass Products
with the US high-end market accounting
for 68% of sales (LTM2Q´17).
Architectural windows systems
● Vertical integration enhances cost structure for high, medium and low rise
benefit High-End Glass & buildings
Aluminium windows6
o Tecnoglass is unique in integrating the
purchase of raw materials, the Contributes more than 90% of
manufacture of glass and aluminum the raw materials for production
products and the subsequent production Aluminium products of Tecnoglass aluminum
used in windows products
of customized glass and windows for
architectural and industrial settings
Main distribution channel into
o Vertical integration allows Tecnoglass to Imports and distributes Florida and other U.S.
products manufactured marketplaces, serving the
price its products competitively while
by the Group residential and commercial
maintaining strict quality control and construction markets.
enhancing time-to-market
Design and installation of Architects, general contractors
o Enhances our distribution capabilities building enclosure systems. and developers to design and
and provides us with a unique Provides engineering and install industry leading glass
opportunity to directly install value-add installation services. enclosures
products in select projects
12
Source: Tecnoglass.5 Built-to-Suit Innovative Products Pacing Ahead of Evolving Industry Trends
Tecnoglass’ High-Quality Products and Exceptional Customer Service Allow it to Better Serve Customers and
Support Organic Growth
Architectural Glass Products Curtain Walls and Other Architectural Systems
• Soft Coat Glass: This product offers excellent thermal insulation, and is designed to
improve the energy efficiency of buildings • Curtain Wall Systems:
• Acts as a window screen suspended outside a building; available in different
• Laminated / Insu-Laminated Glass: Produced by bonding two glass sheets with an
colors, thicknesses, glass types and finishes, and types of ventilation and design
intermediate film in between. As a safety feature, this product fractures into small
complements
pieces if it breaks
• Windows and Doors:
• Insulated Glass: Manufactured with two or more glass sheets separated by an
aluminum or micro-perforated steel profile, buffering noise and improving thermal • Available in different types of glass finishes and structures, normal, hurricane-
control proof, soundproof, safety and thermal, fixed body, sliding windows and
projecting windows
• Silk-Screened Glass: Special paint is applied to glass using automatic machinery
and numerical control, which ensures paint homogeneity and an excellent finish
Aluminium Products
• Bent Glass: Produced by bending a flat glass sheet over a mold, using an
automated heat process, which maintains the glass’ physical properties • Bars, plates, profiles, rods and tubes used primarily in the
manufacture of architectural glass settings, including
• Digital Print Glass: Digital printing allows any kind of appearance required by the windows, doors, spatial separators and similar products
client, offering versatility to projects
Tecnoglass has earned the Miami-Dade County Notice of Acceptance,
one of the most demanding certificates in the industry and a
Tecnoglass’ products comply with Miami-Dade county’s safety code
standards, as its laminated anti-hurricane glass resists impact,
requirement to market hurricane-resistant glass in Florida pressure, water and wind
Source: Tecnoglass. 13Built-to-Suit Innovative Products Pacing Ahead of Evolving Industry Trends
5 (Cont’d)
Increasing Demand for High-Performance and Energy Efficient Glass
The bulk of demand for architectural glass stems from new buildings but, in coming years, retrofit of existing buildings is expected to be a key source of demand by end-users
of architectural glass
o Regulations are increasingly requiring energy-efficient, impact-resistant windows, which indirectly creates a massive market in the retrofit segment
Growing demand for energy efficient buildings is giving rise to a new portfolio of products
o Insulated Glass: An advanced energy-efficient glass, which is now widely being used by architects in residential and commercial buildings
o Low-emissivity glass: Coated with invisible transparent material, which enables reduction of heat loss through windows
o Fire resistant glass: Acts as a defense against smoke and flames, by blocking radiant heat
o Self-cleaning glass: Specific coatings defines the utility of the glass. Hydrophobic coating reacts with sunlight to absorb organic dirt, whereas in hydrophilic coating
rainwater hitting the glass rubs off loosened dirt accumulated on the glass
Introducing High-end Interior Partitions for Commercial Glazing Systems
Partition Wall system elegant, Partition Wall
light and affordable luxury segment
To be used in areas where no visual barrier is required and where transparency High tech oriented system with an elegant look and a rigorous design.
needs to be accentuated. Built to provide acoustic comfort while always maintaining a high performance.
Easily and quickly interchangeable without the integration of additional Highly adaptable with a transformation feature to become a customizable wall.
materials or accessories.
Targeted to all U.S. markets and also fit for residential space.
Fast and easy to install on site.
Targeted to all commercial markets within the U.S. and Latin America.
Source: Tecnoglass. 14Built-to-Suit Innovative Products Pacing Ahead of Evolving Industry Trends
5 (Cont’d)
Tecnoglass’ Commitment to Innovation has Made it a Pioneer in Architectural Glass Technology, Resulting in
a Portfolio of Top-Class Products
A New Generation of Products Already in Production, Will Allow the Company to Penetrate New Markets and Generate New Opportunities
• New approach to glass heat treatment • TecnoBend products are at the forefront of a new architectural
movement: curved glass for non-conventional designs
• Air flotation technology produces practically wave-free glass for both
• We acquired a new Glaston machine for curved glass production, which
clear and low-emissivity glass(1)
results in highly resistant MSDV(2) glass with and without Low-E covering
TecnoAir products entered production in 2Q 2016 The TecnoBend product line of “made-to-measure” curved glass
entered production in early 2016
In addition to the significant investments in property and equipment, in 2015 and 2016 Tecnoglass also invested
approximately US$2.0 million and US$2.2 million, respectively, in research and development
Source: Tecnoglass. 15
(1) Low-emissivity glass minimize the amount of ultraviolet and infrared light that passes through the glass, improving the glass’ insulating properties.
(2) Refers to Magnetron Sputtering Vacuum Deposition (also known as “sputtering”), which is one of the main technologies currently used to manufacture low-emissivity glass.Skilled Workforce Supported by Strong Leadership and Corporate
6 Governance Framework
C Supported by Experienced Management and a Strong Corporate Governance Framework
Committees
Independent
Directors
José M. Daes Audit Nomin. Comp.
CEO and Chairman
A Lorne
Weil
Christian T. Daes
José Manuel Daes Christian Daes Rodolfo Espinosa COO
CEO COO President
Tecnoglass Inc. Tecnoglass Inc. CI Energia Solar Julio A.
Samuel R.
Torres
Azout
Martha L.
Juan Carlos Byorum
Vilariño
Julio A. Samuel R
Torres Azout
Santiago Giraldo Andrea Zambrano
CFO General Counsel
Tecnoglass Inc. Tecnoglass Inc.
Martha L.
Byorum Juan Carlos
Vilariño
● José Daes and Christian Daes each have more than 30 years of
industry experience Lorne Weil
Member Chair
● The executive management team has worked together for
Non-Executive Chairman
● All of Tecnoglass’ Corporate Governance
committees include independent Board
several years at Tecnoglass’ operating subsidiaries Members
Inside Director Independent Director
16
Source: Tecnoglass.Operational Review
Detailed, Integrated Production and Distribution Process
Vertically Integrated Operations Provide Low Cost Base and Operational Flexibility (1)
Suppliers Raw Material Production Process Final Product Sales, Distribution & Installation
3rd Party
Providers of
Glass:
Distributors
Saint Gobain Insulated
PPG Glass Glass
2 Glass
Others Sheets
Production
Process
End
Customers
High-Spec
Windows Installers
Primary Painting
Aluminum
1 Profiles
Production Anodizing
Process
Source: Tecnoglass. 17
(1) Based on 1Q financial results including GM&P, acquired on March 2017.Operational Review
Ongoing Initiatives to Maintain Competitive Advantage with Cutting Edge Technology
Energy Efficiency Lean Manufacturing
Strategy in place to install 25MW of solar power In December 2015 Energia Solar started a re-vamp of its
capacity in order to reduce gas consumption by 7% production process, with an “in-to-out” shift in focus
resulting in tangible results that are already visible
The first stage of the project commenced during 3Q16 in
alliance with Panasonic LA – TESLA and is planned to The project expects to improve other processes:
install solar panels that will produce the first 3 MW of planning, design, engineering, and materials
solar energy.
The project initiated in Tecnoglass S.A. in March of 2016
This investment contemplates tax benefits for the
company, in light of government incentives for clean
energy
Key Metrics:
• In-process product
• Productivity
• Time to delivery
• Workforce intensity
Source: Tecnoglass. 18(1)
Financial Highlights 2Q´2017 vs 2Q´2016
Highlights in US$mm
Revenues grew 1.5% YoY as a result of higher sales into the U.S,
mainly associated with the acquisition of GM&P and successful 2017 2016 $Δ %Δ
penetration into new U.S markets. Key Financial Results 2Q 2Q
Revenues 81,0 79,8 1,2 1,5%
Margins and EBITDA were impacted by i) higher mix of GM&P
Adjusted EBITDA(2) 13,4 17,7 -4,4 -24,6%
(installation and engineering) revenues which carry lower
margins, ii) higher D&A associated with the 2016 Capex Adjusted net income 2,6 9,3 -6,6 -71,5%
investment phase and iii) carrying higher labor and SG&A cost as a Cash at end of period 43,7 37,1 6,6 17,7%
% of sales to service growing backlog and higher expected Gross debt 226,9 211,4 15,5 7,3%
revenues. Expected margins improvement for the second half of
the year on revenue ramp-up and cost efficiencies. Net debt(3) 183,2 174,3 9,0 5,1%
Capex(4) 2,3 9,7 -7,3 -75,7%
To address the higher fixed cost labor structure, the Company has Paid cash interests 0,1 1,9 -1,8 -96,3%
sought efficiencies and trimmed about 5% of its administrative Paid cash dividends 0,7 0,0 0,7 0,0%
headcount and about 7% of its labor headcount compared to Q1
2017 personnel (head count reductions mainly in Q3).
A favorable FX impact for 2Q´2017 resulted in a slight benefit
Healthy cash balance driven by working capital improvements. to reported Colombia revenues compared to 2Q´2016.
Conservative leverage metrics and stable net debt since 2016 FX rate went from an average of $2,994,68 COP per USD for
following completion of growth capex phase. the 2Q´2016 to $2,919,56 COP per USD for the 2Q´2017.
Installed capacity sufficient for 2017 and 2018 growth.
For Q3 2017, announced 12% raise in dividend to annualized rate
of $0.56 per share and reaffirmed commitment to long-term
dividend program.
Notes:
1. Prior-period financial information in 2015 and 2016 has been retroactively adjusted for ES Windows, acquired under common control. 2017. Financial statements includes 4 months of GM&P, acquired on
March 1, 2017. 19
2. 2Q YTD 2017 adjusted EBITDA excludes $5.8mm in extinguishment of debt, bond issuance costs and other non-recurring.
3. Net debt is calculated as gross debt (-) cash & equivalents.
4. Includes acquisition of property and equipment, assets acquired under capital lease and debt.(1,2)
Revenue & Adjusted EBITDA Bridge 2Q´2017 vs 2Q´2016
Revenue increased derived mainly from the U.S. projects attributable to GM&P, partially offset
by Colombia revenue drop given market factors and pent-up construction activity
14
00
. 00
3 Months Analysis - Q2 2017 QTD in US$mm
12
00
. 00
10
00
. 00 12.568
2.051 389
80
. 00
-
- 13.164 681 - -
60
. 00
40
. 00
79.813 80.976
20
. 00
0
2Q 2016 U.S. Colombia Panama/Bolivia Other Foreing 2Q 2017
Revenues Countries Exchange Revenues
Adj. EBITDA impacted by the combination of product mix and higher fixed costs in place to
support growing backlog and lower than expected revenue
30
. 00
0
3 Months Analysis - Q2 2017 QTD in US$mm
25
. 00
0
20
. 00
0
-
15
. 00
0
408 - -
10
. 00
0
17.711 5.853 - 143 324
13.360
5.000
11.858 11.858 12.123 11.799
0
2Q 2016 Adj. Product/Service Volume SGA Non-operating 2Q 2017 Adj.
EBITDA Mix revenues, net EBITDA
Notes:
1. Prior-period financial information in 2016 has been retroactively adjusted for ESWindows, acquired under common control. 2017. Financial statements in 2017 Include 4 months of GM&P,
acquired on March 1, 2017.
2. Adj. EBITDA is estimated as net income plus income tax provision, interest expense, gain/loss on change in fair value of warrants and earnouts,
20
exchange gain/loss, one timers and D&A.2017 Outlook
2017 Revenues projected to be $320 to $330mm, representing a 6.6% growth YoY at mid point
GM&P sales provide meaningful contribution to 2017 revenues.
Poised to benefit from $50mm of 2017 project revenues that have shifted into 2018.
Similar dynamic evident in 2014, resulting in pent-up activity that subsequently shifted growth
into 2015.
Positive mid-term view supported by quoting activity, backlog expansion and pent-up demand.
2017 Adjusted EBITDA projected to be $57mm to $65m
Adjusted EBITDA impacted by lower than expected invoicing resulting from backlog shift.
Higher mix of revenue from GM&P which carries a lower engineering and installation margin.
Higher cost structure during the H1 2017 to support higher expected revenues.
Early Q3 2017 activity shows ramp-up in legacy revenues, which coupled with personnel
reduction and other cost saving initiatives should enhance margins compared to H1 2017.
21Arris at The Yards - Washington DC
Appendix
22Financial Review
Consolidated Income Statement & Non-GAAP Reconciliation
Figures in US$mm 2012 2013 2014 2015 2016 LTM 2Q'17 CAGR/Avg. 2Q 2016 2Q 2017
Revenues 130,3 183,3 197,5 242,2 305,0 308,141 21,1% 79,8 81,0
Cost of Sales (95,5) (127,9) (131,2) (151,4) (192,4) (203,379) 18,3% (51,8) (58,4)
Gross Profit 34,9 55,4 66,3 90,9 112,6 104,762 27,7% 28,0 22,5
Margin % 26,8% 30,2% 33,6% 37,5% 36,9% 0,340 33,2% 35,1% 0,3
Operating Expenses (23,9) (28,1) (39,1) (51,3) (64,8) (69,112) 26,6% (15,3) (17,1)
Operating Income 11,0 27,3 27,2 39,6 47,8 35,650 29,9% 12,7 5,4
Margin % 8,4% 14,9% 13,8% 16,3% 15,7% 0,116 13,4% 15,9% 0,1
Gain (loss) on change in fair value of warrant liability 0,0 7,6 (1,7) (24,9) 0,8 (11,822) n.m. 6,7 0,0
Gain (loss) on change in fair value of earnout shares 0,0 2,1 (10,8) (10,9) 4,7 (2,360) n.m. 3,3 0,0
Non-operating Income (Loss), net 3,6 4,0 12,2 15,1 2,8 (1,568) n.m. 0,2 (7,8)
Interest Expense (5,5) (7,9) (8,9) (9,3) (16,8) (22,866) 37,2% (4,2) (5,2)
Income Before Taxes 9,1 33,1 18,0 9,7 39,3 (2,966) n.m. 18,7 (7,6)
Income Tax Provision (3,2) (8,7) (8,5) (20,7) (16,1) (5,358) 12,0% (4,1) 4,1
Minority Interest 0,0 0,0 0,0 0,0 0,0 (0,072) n.m. 0,0 (0,1)
Net Income (Loss) 5,9 24,4 9,5 (11,0) 23,2 (8,396) n.m. 14,7 (3,6)
Margin % 4,5% 13,3% 4,8% (4,5%) 7,6% (0,027) 3,8% 18,4% (4,4%)
Adj. Net Income (Loss) Reconciliation
Net Income (Loss) 5,9 24,4 9,5 (11,0) 23,2 (8,396) n.m. 14,7 (3,6)
Foreign currency transactions losses (gains) (0,7) (1,3) (10,8) (10,1) 1,4 5,409 n.m. 1,0 8,7
Gain (loss) on change in fair value of warrant liability 0,0 (7,6) 1,7 24,9 (0,8) 11,822 n.m. (6,7) 0,0
Gain (loss) on change in fair value of earnout shares 0,0 (2,1) 10,8 10,9 (4,7) 2,360 n.m. (3,3) 0,0
One Timers 0,0 0,0 0,0 0,0 4,5 10,237 n.m. 0,0 1,6
Tax impact of adjustments at statutory rate 0,3 4,4 (0,7) (10,3) (0,2) (11,931) n.m. 3,6 (4,1)
Adjusted Net Income (Loss)(1) 5,5 17,8 10,5 4,4 23,4 9,500 13,0% 9,3 2,6
Margin % 4,2% 9,7% 5,3% 1,8% 7,7% 0,031 5,3% 11,6% 3,3%
Adjusted EBITDA Reconciliation
Net Income 5,892 24,432 9,511 (11,020) 23,180 (8,396) n.m. 14,7 (3,6)
Gain (loss) on change in fair value of earnout shares 0,000 (2,120) 10,807 10,858 (4,674) 2,360 n.m. (3,3) 0,0
Gain (loss) on change in fair value of warrant liability 0,000 (7,626) 1,711 24,901 (0,776) 11,822 n.m. (6,7) 0,0
Income Tax Provision (Benefit) 3,223 8,696 8,538 20,691 16,072 5,358 12,0% 4,1 (4,1)
Interest Expense 5,513 7,886 8,900 9,274 16,814 19,705 32,7% 4,2 5,2
Foreign currency transactions losses (gains) (0,676) (1,255) (10,790) (10,059) 1,387 5,409 n.m. 1,0 8,7
One Timers 0,000 0,000 0,000 0,000 4,509 10,237 n.m. 0,0 1,6
Depreciation and Amortization 7,668 7,238 8,543 12,464 15,522 18,820 22,1% 3,7 5,5
Adjusted EBITDA 21,620 37,251 37,220 57,109 72,034 65,314 27,9% 17,7 13,4
Margin % 16,6% 20,3% 18,9% 23,6% 23,6% 21,2% 20,7% 22,2% 16,5%
Source: Tecnoglass. 23
Note: 2015 and 2016 financial Information has been retroactively adjusted to reflect the acquisition under common control of ES Windows. 2017 financial statements include one month of GM&P’s operations after
being acquired in March 1, 2017.
(1) Excludes change in fair value of warrant and earnout liabilities.Financial Review
Consolidated Balance Sheet & Non-GAAP Reconciliation
Figures in US$mm 2012 2013 2014 2015 2016 LTM 2Q'17 CAGR/Avg. 2Q 2016 2Q 2017
Cash & Equivalents 2,1 2,9 15,9 22,7 26,9 43,7 96% 37,1 43,7
Trade Accounts Receivable, net 37,4 50,9 44,7 67,1 92,3 106,3 26% 109,8 106,3
Inventories 21,6 24,2 29,0 48,7 55,1 61,1 26% 59,3 61,1
Other Current Assets 27,3 76,9 46,5 32,7 36,4 25,8 -1% 44,7 25,8
Total Current Assets 88,4 154,8 136,1 171,2 210,7 236,9 24% 250,9 236,9
Property, plant and equipment 63,0 87,4 104,0 136,0 170,8 165,1 24% 157,4 165,1
Other Long-Term Assets 2,5 6,0 10,4 14,3 13,2 43,7 88% (157,4) 43,7
Total Long-Term Assets 65,6 93,4 114,4 150,2 184,0 208,8 29% 0,0 208,8
Total Assets 154,0 248,2 250,5 321,4 394,7 445,7 27% 250,9 445,7
Short-Term Debt and Current Portion of Long-term Debt 7,1 29,7 54,9 17,6 2,7 5,5 -6% 70,5 5,5
Trade Accounts Payable 25,8 37,7 34,0 39,0 30,6 56,5 19% 61,4 56,5
Other Current Liabilities 23,7 41,1 23,8 77,4 45,1 43,1 14% 63,6 43,1
Total Current Liabilities 56,6 108,5 112,7 133,9 78,4 105,0 15% 195,5 105,0
Long-Term Debt 50,1 48,1 39,3 121,5 196,9 18,9 -19% 140,9 18,9
Corporated Bond 0,0 0,0 0,0 0,0 0,0 202,6 n.m. 0,0 202,6
Other Long-Term Liabilities 0,0 44,8 52,3 28,2 5,8 6,7 n.m. 6,3 6,7
Total Long-Term Liabilities 50,1 92,9 91,6 149,7 202,8 228,2 40% 147,2 228,2
Total Liabilities 106,7 201,3 204,3 283,6 281,2 333,2 29% 342,7 333,2
Equity atributable to non controlling Interest 0,0 0,0 0,0 0,0 0,0 1,2 n.m. 0,0 1,2
Equity atributable to controlling Interest 47,3 46,9 46,2 37,8 113,6 111,3 21% 78,3 111,3
Total Shareholders' Equity 47,3 46,9 46,2 37,8 113,6 112,5 21% 78,3 112,5
Credit Metrics
Total Debt 57,3 77,8 94,2 139,1 199,6 226,9 36% 211,4 226,9
Cash & Equivalents 2,1 2,9 15,9 22,7 26,9 43,7 96% 37,1 43,7
Net Debt 55,1 75,0 78,3 116,4 172,7 183,2 31% 174,3 183,2
Total Debt / Adjusted EBITDA 2,6x 2,1x 2,5x 2,4x 2,8x 3,5x 2,7x 11,9x 17,0x
Net Debt / Adjusted EBITDA 2,5x 2,0x 2,1x 2,0x 2,4x 2,8x 2,3x 9,8x 13,7x
Adjusted EBITDA / Interest Expense 3,9x 4,7x 4,2x 6,2x 4,3x 3,3x 4,4x 4,2x 2,6x
Source: Tecnoglass. 24
Note: 2015 and 2016 financial Information has been retroactively adjusted to reflect the acquisition under common control of ES Windows. 2017 financial statements include one month of GM&P’s
operations after being acquired in March 1, 2017.You can also read